
Sideways movement was expected for Monday.
Price has moved lower, not sideways, remaining just above the invalidation point on the hourly chart.
Summary: Upwards movement is expected to 1,198 – 1,202. The target may be met in one to three days time. Overall, all wave counts still require more upwards movement for the structure to complete.
To see weekly charts for bull and bear click here.
New updates to this analysis are in bold.
BULL ELLIOTT WAVE COUNT
DAILY – TRIANGLE
Click chart to enlarge.
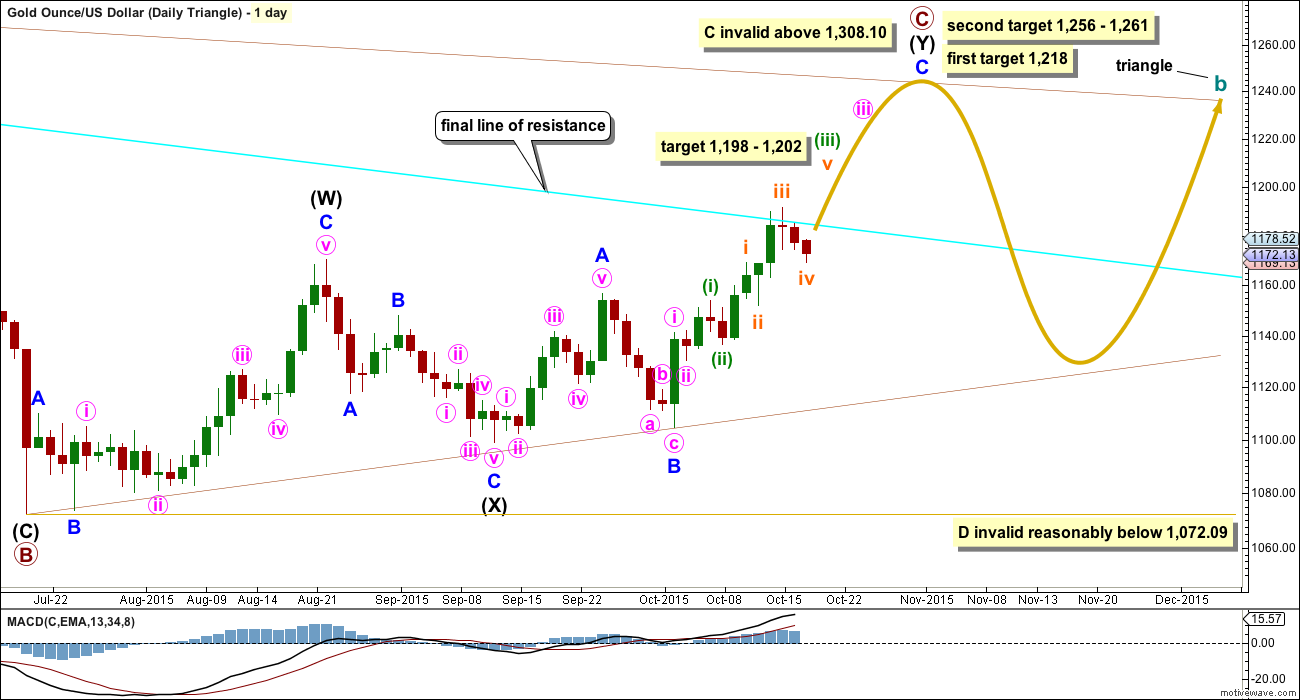
This first daily chart looks at what a triangle would look like for cycle wave b. The triangle would be a running contracting or barrier triangle. Within the triangle, primary wave C up must be a single or multiple zigzag. Primary wave C may not move beyond the end of primary wave A above 1,308.10.
This idea slightly diverges from the other two ideas for cycle wave b as an expanded flat or combination.
The expected direction is still exactly the same, and the current upwards structure is still seen as an impulse. The first short term target at 1,198 – 1,202 is also the same. This target is where minuette wave (iii) would reach 2.618 the length of minuette wave (i) and subminuette wave v would reach equality in length with subminuette wave i.
The first target at 1,218 is where primary wave C would reach 0.618 the length of primary wave B. If price gets up to the first target and the structure of minor wave C is a complete five wave impulse, then it may be over there.
The second target at 1,256 is where minor wave C would reach 2.618 the length of minor wave A, and at 1,261 primary wave C would reach 0.8 the length of primary wave A.
For the triangle idea, for cycle wave b, a five wave impulsive structure only needs to complete upwards. The next wave down for primary wave D should be fairly time consuming, lasting about 2 to 6 months. Primary wave D may not move beyond the end of primary wave B at 1,072.09 for a contracting triangle. Alternatively, primary wave D may end about the same level as primary wave B at 1,072.09 for a barrier triangle, as long as the B-D trend line remains essentially flat. In practice this means primary wave D can end slightly below 1,072.09 and this wave count remains valid. This is the only Elliott wave rule which is not black and white.
DAILY – COMBINATION
Click chart to enlarge.
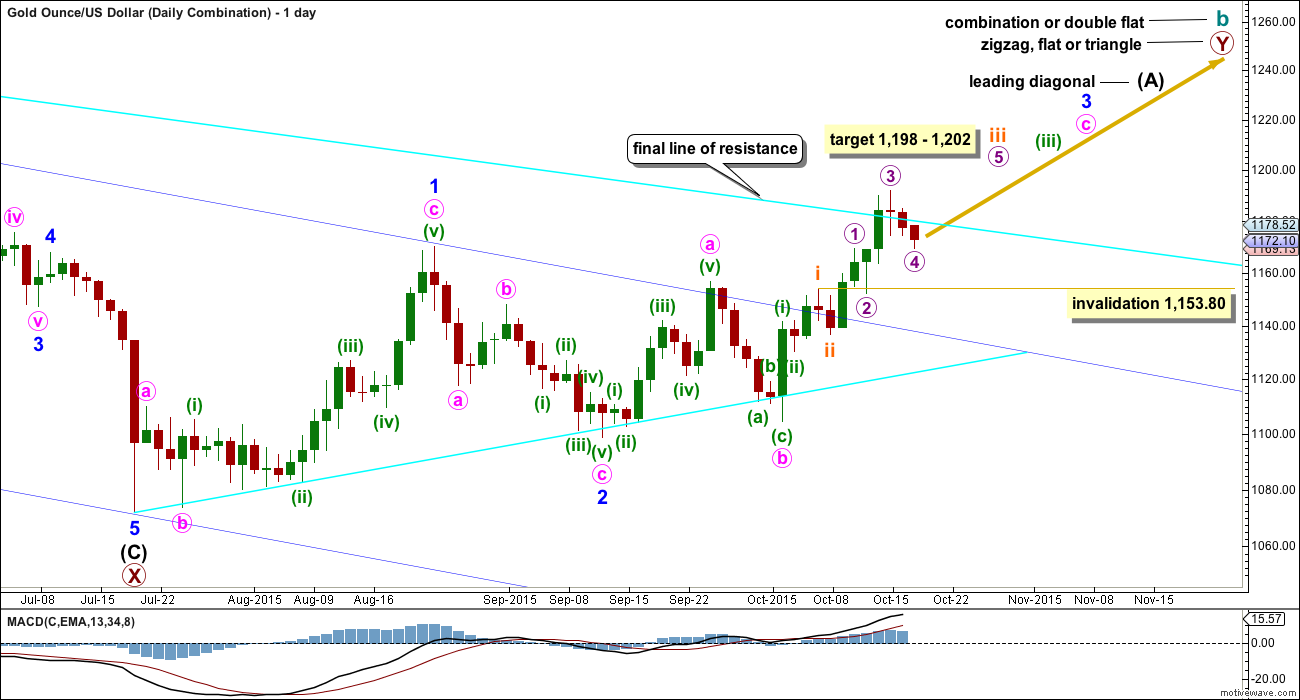
If cycle wave b is a combination, then the first structure in the double combination (or double flat) was an expanded flat. The double is joined by a three in the opposite direction labelled primary wave X which was a zigzag.
The second structure in the double may be another flat for a double flat, or it may be a zigzag or triangle for a double combination. Because a triangle for primary wave Y would essentially make the whole of cycle wave b the same as a triangle for cycle wave b, this chart will focus only on a possible zigzag for primary wave Y.
If primary wave Y is a zigzag, then intermediate wave (A) must be a five wave structure and may be unfolding as a leading diagonal.
If primary wave Y is a flat correction, then intermediate wave (A) must be a three wave structure and may be unfolding as a double zigzag (this idea is how the first chart, Daily – Triangle, labels upwards movement).
For all possibilities, a five wave impulse is still required to complete upwards. The short term target for subminuette wave iii is still the same at 1,198 – 1,202.
Subminuette wave iv may not move into submineutte wave i price territory below 1,153.80.
DAILY – EXPANDED FLAT
Click chart to enlarge.
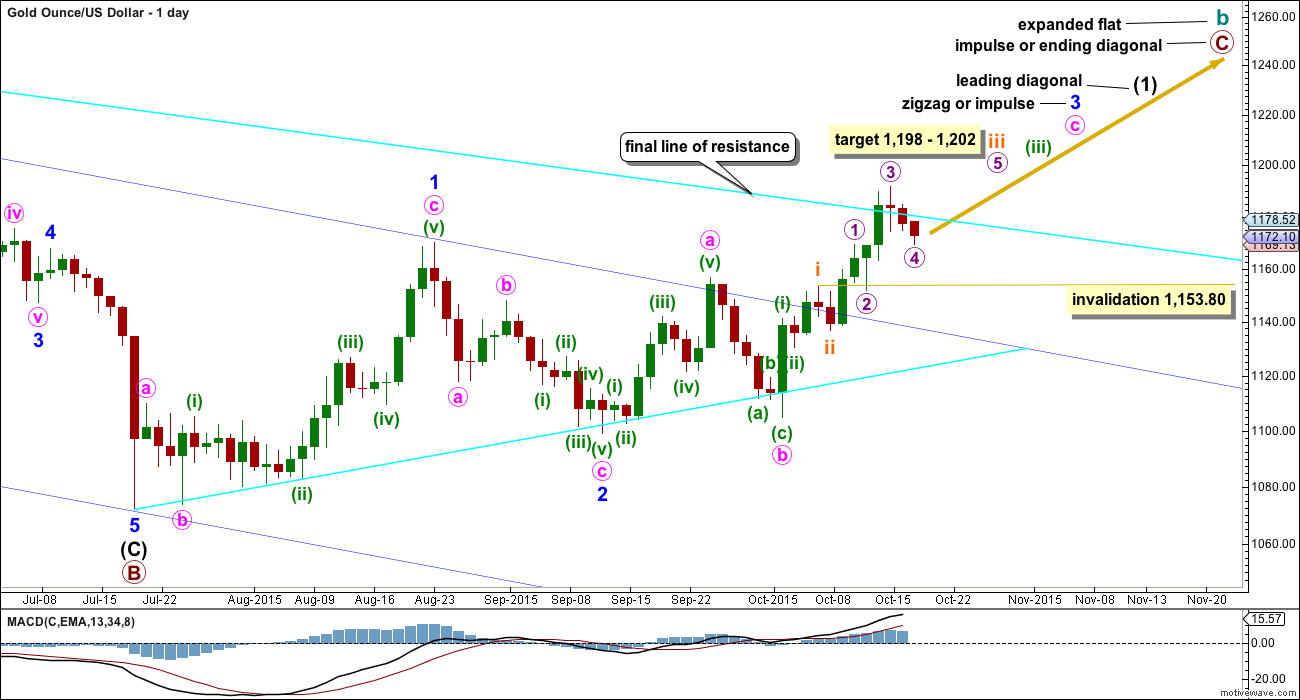
Cycle wave b may also be a flat.
If cycle wave b is an expanded flat, then primary wave C must be a five wave structure. If the current diagonal unfolds as a contracting diagonal (most common), then it would be intermediate wave (1) of a five wave impulse upwards for primary wave C. If the current leading diagonal unfolds as an expanding diagonal, then the degree of labelling within primary wave C may be moved up one degree because an expanding diagonal may be an ending diagonal for primary wave C in its entirety.
At 1,197 minor wave 3 will pass equality in length with minor wave 1. Above that point the diagonal must be expanding and not contracting.
A leading diagonal requires the second and fourth waves to subdivide as zigzags. The first, third and fifth waves are most commonly zigzags, but sometimes may appear to be impulses. So far minor wave 1 fits well as a zigzag.
Minor wave 2 is 0.73 the depth of minor wave 1, nicely within the normal range of between 0.66 to 0.81 for a second wave within a diagonal.
Third waves within leading diagonals are most commonly zigzags, but sometimes they may be impulses. Minor wave 3 is now showing some increase in upwards momentum beyond that seen for minor wave 1. Minor wave 3 has moved above the end of minor wave 1 above 1,170.19.
There now looks like a five up on the daily chart within minor wave 3. This may be minute wave a within a zigzag or it may also be minute wave i within an impulse.
Current upwards movement would be minute wave c or minute wave iii. Either way, it must subdivide as an impulse. On the hourly chart so far the structure still looks incomplete.
The hourly chart below will suffice for all three bull wave count ideas. For the triangle idea, the labelling would be the same except it should be moved up one degree.
MAIN HOURLY CHART
Click chart to enlarge.
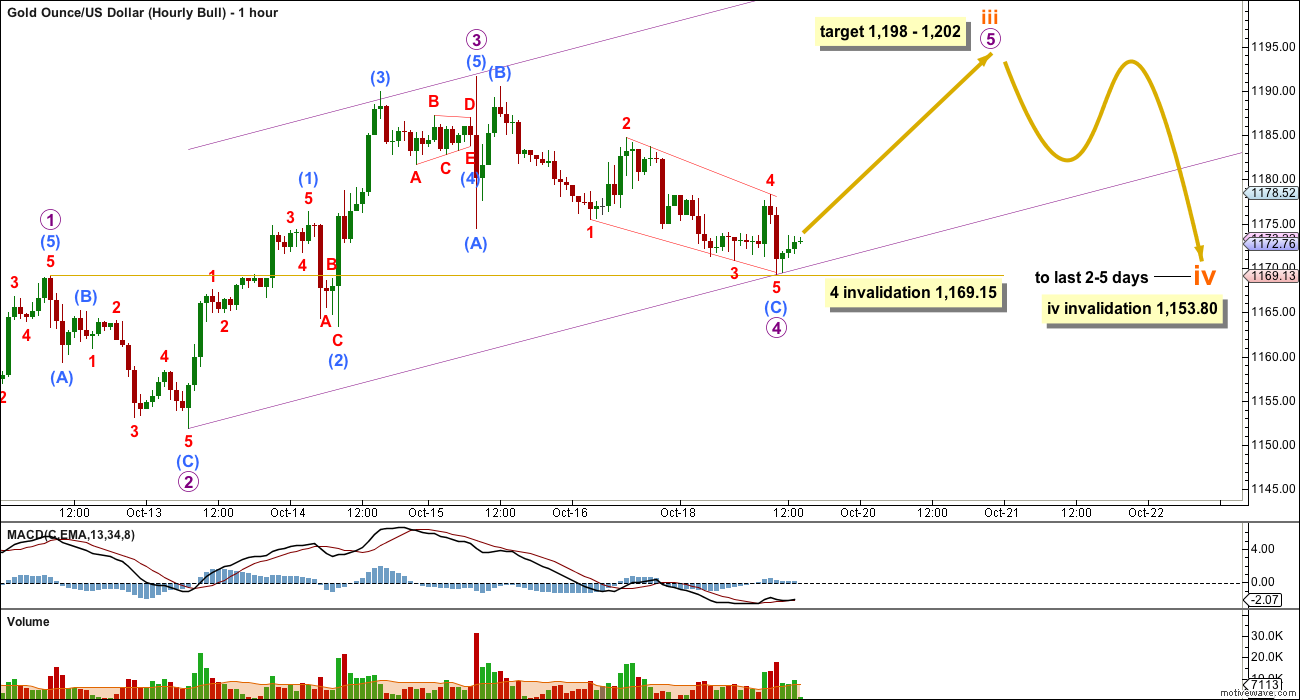
Micro wave 4 breached the channel which was drawn about this upwards movement for subminuette wave iii using Elliott’s first technique. Sometimes fourth waves are not contained within the channel which is why Elliott developed a second technique to use when the fourth wave breaches the channel. Redraw the channel using the second technique: the first trend line from the ends of micro waves 2 to 4, then a parallel copy on the end of micro wave 3. This redrawn channel may show where micro wave 5 ends.
At 1,198 subminuette wave iii would reach 2.618 the length of subminuette wave i. At 1,202 micro wave 5 would reach equality in length with micro wave 1.
Micro wave 2 was a relatively deep 0.53 zigzag. Micro wave 4 fits as either a regular flat or a zigzag (submicro wave (A) will fit as either a three or a five and submicro wave (B) is more than 90% the length of submicro wave (A) ). Submicro wave 4 is also deep at 0.56. There may be some alternation if micro wave 4 is seen as a flat, but only in structure. There is inadequate alternation in depth. Alternation is a guideline not a rule, and is almost always seen but as we know almost always is not the same as always. Because of this problem I am considering the alternate below, but this still remains my main and preferred hourly wave count because it has a good look at the daily chart level.
This first hourly wave count requires upwards movement to complete the impulse for subminuette wave iii. This may last one to three days. Along the way up, price may find support at the lower edge of this channel.
ALTERNATE HOURLY CHART
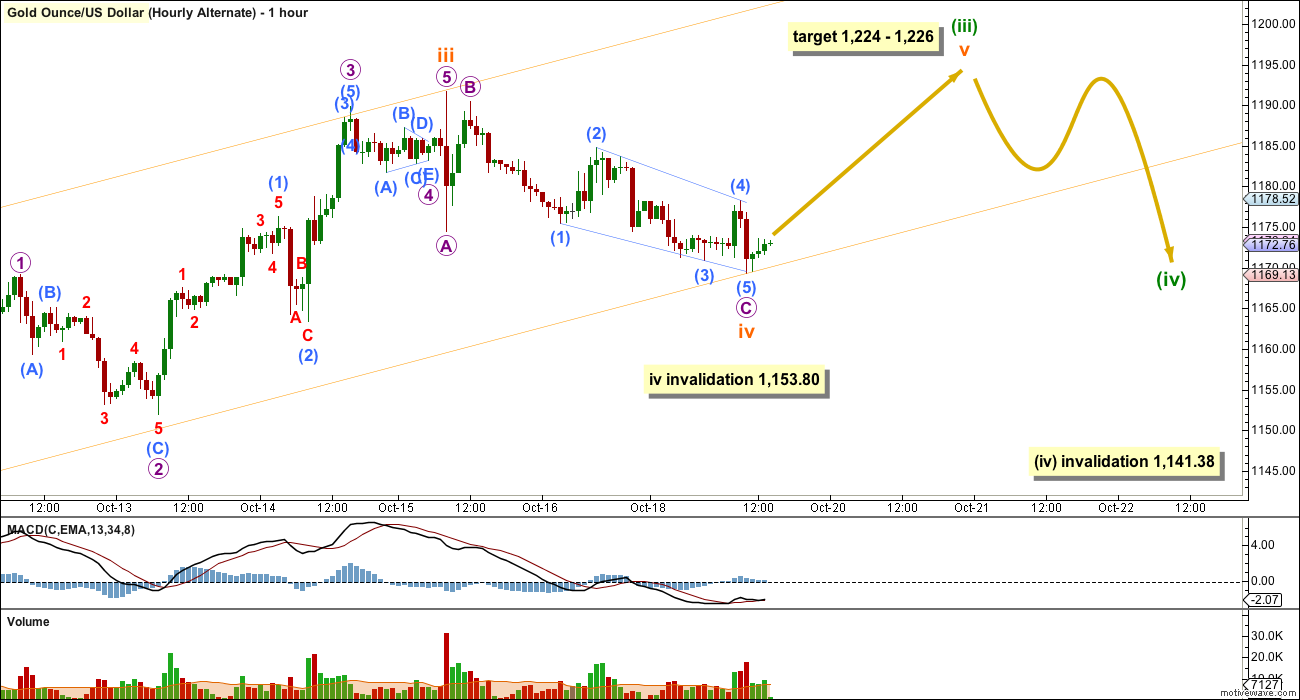
Click chart to enlarge.
What if subminuette wave iii is actually over? And it does not look like a perfect five wave impulse on the daily chart?
The subdivisions within it will fit on the five minute chart. Sometimes Gold exhibits swift strong fifth waves which force its fourth wave corrections to be quick and shallow. This may have happened for submicro wave (4) within subminuette wave iii.
This idea sees the current correction as one degree higher for subminuette wave iv. If it continues further, it may not move into submineutte wave i price territory below 1,153.80.
There is no Fibonacci ratio between subminuette waves i and iii.
Subminuette wave ii was a deep 0.73 zigzag. Subminuette wave iv may be either a regular flat or a zigzag and is shallow at 0.41 of subminuette wave iii. This alternate wave count has better alternation between subminuette waves ii and iv.
The channel is different. Draw the first trend line from the low of subminuette wave ii (seen on the daily chart) to the low of subminuette wave iv, then place a parallel copy on the high of subminuette wave iii. Along the way up, this channel may show where downwards corrections find support (but only if subminuette wave iv is complete as labelled; if the channel is breached before a new high, then subminuette wave iv may be continuing further and the channel will not be useful).
The target is higher. At 1,226 minuette wave (iii) would reach 2.618 the length of minuette wave (i) and at 1,224 subminuette wave v would reach equality in length with subminuette wave iii.
This alternate wave count also expects upwards movement for about one to three days towards the target. The biggest difference is it allows for the possibility of more downwards movement first.
BEAR ELLIOTT WAVE COUNT
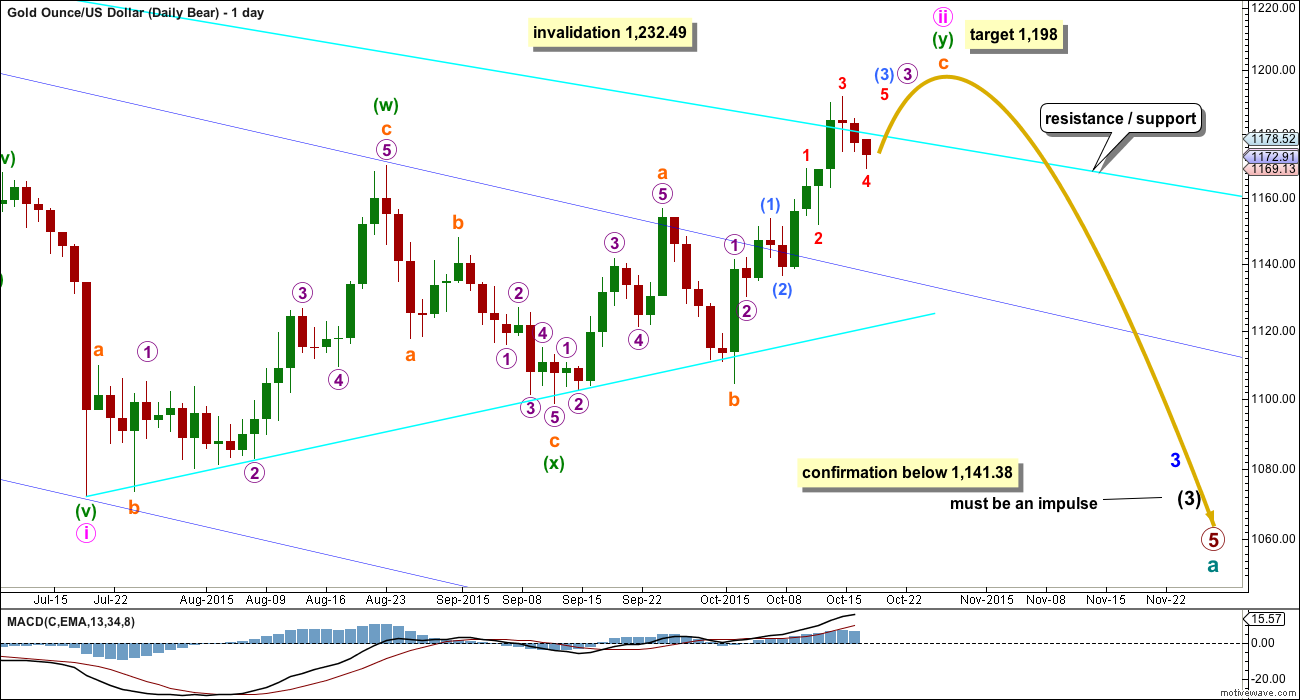
Click chart to enlarge.
The final line of resistance (bright aqua blue line copied over from weekly charts) is only overshot and not so far properly breached. While this line is not breached the bear wave count will remain possible. Simple is best, and the simplest method to confirm a trend change is a trend line. While price remains below this line, it must be accepted that Gold has been in a bear market since 2011 and we don’t have technical confirmation that the bear market has ended.
The only option now for a bear wave count is to see minute wave ii continuing higher as a double zigzag.
Minute wave ii has strongly breached the dark blue base channel drawn about minor waves 1 and 2. When a lower degree second wave correction breaches a base channel drawn about a first and second wave one or more degrees higher, then the probability of the wave count reduces, particularly at higher time frames.
The structure of upwards movement for the bear wave count is exactly the same as the bull for the short term: a five wave impulse is unfolding upwards and it is incomplete.
Minute wave ii may not move beyond the start of minute wave i above 1,232.49. A new high above that price point would be final price invalidation of any bear wave count. That would fully eliminate the concept that Gold remains in a bear market. No bear wave count should be considered above that point.
TECHNICAL ANALYSIS
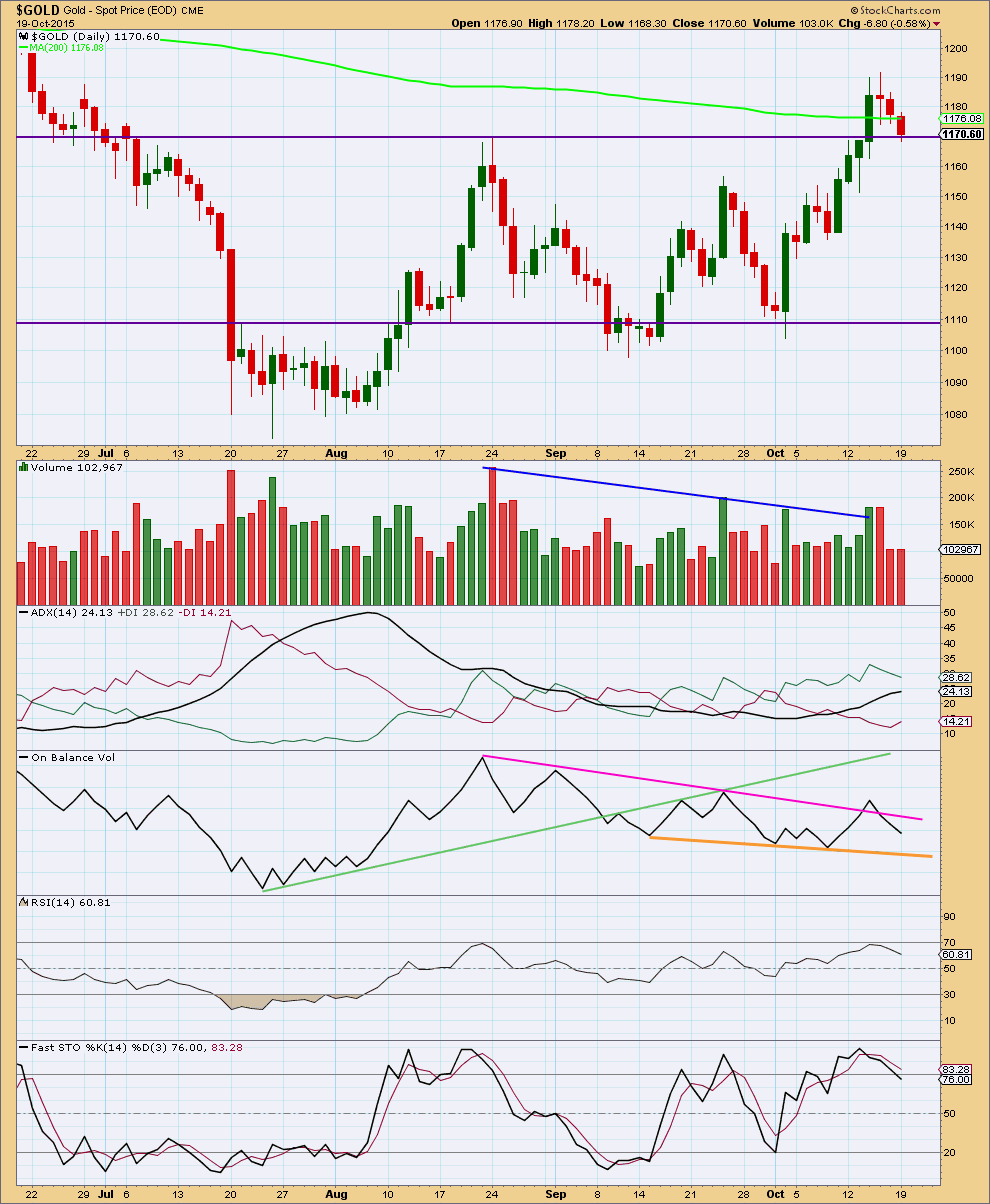
Click chart to enlarge. Chart courtesy of StockCharts.com.
Note: This regular technical analysis is updated after NY close.
Monday’s downwards movement comes with only very slightly increased volume, volume is almost flat and well below the downwards day of 15th October. As price fell for three days overall volume still is declining. Price may find strong support at the horizontal trend line.
Friday’s red candlestick completes an evening doji star candlestick pattern, although the pattern is weak because the third candlestick closes only about halfway in the body of the first candlewick (the deeper the close of the third candlestick the stronger the pattern). This is a warning that we may have a high in place; an evening doji star is a bearish reversal pattern. These candlestick patterns do not always work as expected though. As with all technical analysis indicators they need to be weighed up with other pieces of evidence.
I would expect price to find strong support now at the horizontal trend line which previously provided resistance. When price breaks through trend lines and then throws back, if ADX indicates a clear trend is evident, then it offers a good opportunity to join the trend.
ADX is now above 20 and still pointing upwards indicating a new trend. The trend is upwards with the +DX line above the -DX line.
The pink trend line is not working well for On Balance Volume. It is not technically significant enough. OBV may now find some support at the orange trend line, but that too is too short lived and not tested enough to be highly technically significant. It may provide some weak support.
RSI is not yet overbought. There is room for further upwards movement.
I added Kaufman’s Moving Average (red line) because ADX indicates a trend and price has broken out of a consolidation zone. This may be useful to show where this upwards trend may find support.
Overall, it looks like Gold has broken out of the recent consolidation and the breakout was upwards, despite the strongest volume day during the consolidation being downwards. The strongest piece of technical analysis on this chart is the horizontal trend line. It is very likely to provide support.
This analysis is published about 03:35 p.m. EST.
The main hourly wave count was invalidated, the alternate hourly wave count is confirmed.
The structure is still incomplete, I expect tomorrow a green candlestick and new highs.
The target for the next multi day interruption to the trend is 1,222 – 1,226.
This target may be met in a Fibonacci 5 days if the fifth wave is equal in duration with the third wave, as well as length.
Silver is not as strong as gold today…a sign to me that the upward move may be close to an end if we are going to have any bearish activity. I just initiated a position in JDST. Yesterday JDST was strong, but gave back most of its gains today. It appears that it is holding up right now, but if it breaks below $22 for any length of time, I will sell at a loss. I am looking for $27 – $28 until I sell.
One other tidbit of note, FCX, which has been very strong the last few days, is now lagging the other miners, a sign to me of exhaustion for this move. Is it over? I don’t know, but I’m guessing that we are close to a pullback–doesn’t have to turn the miners or metals bearish overall, though.
Gold price at this stage is just unable to get past the previous three lows 1180-83 and appears to be heading for topping soon… The only good thing that came out today was a break of either side of Monday trade range…. Takes a sustained break and coast above 1181 to seek higher; a sustained break and coast below 1173 to seek lower… Seems Gold price is floating within this range undecided, very confusing lol….
I’m a beginner so bear with me….
I understand the weekly gold bear chart and the completion of wave 5 but
in your gold bull wave count you are trying to confirm if there is a trend change from bear to bull, correct? We could be in the process of completing what you call primary wave C (or Y) and cycle wave b. What happens after cycle wave b completes? The weekly chart shows and arrow down to cycle wave c and (a) to about $1000, is that right? We are still going down to $1000 in the bull wave count too to complete cycle wave c (a)? thx
Cycle wave b will take a few months to complete yet for the bull wave counts.
When the end of cycle wave b is known then a target may be calculated for cycle wave c. I don’t know where it begins at this stage so I cannot calculate a target for it to end. The arrow to about 1,000 is only there to show a wave down should unfold, not that it should end about 1,000. No target is given for its end.
Cycle c should be a five wave structure down, last one to several years, and most likely take price at least slightly below cycle a to avoid a truncation. That’s all I can say about it at this stage.
But unless we break out to new highs above $1900 you believe gold is in a Grand Super Cycle Wave IV correction which from your May 8, 2015 post indicates that:
“If grand super cycle wave IV ends within the price territory of the fourth wave of one lesser degree, then it would reach down as low as $612.56 to $271.04. It would be most likely to end close to (a bit above) the end of the fourth wave of one lesser degree, so just above 271.04. This is most typical of fourth waves.”
I guess I was thinking, that with the possible end of primary wave 5 in late July of this year, this 4 year correction was over but it’s not over unless we break above the Sept 2011 highs. Unless that happens, we still have super cycle waves (a) (b) and (c) to complete before Grand Super Cycle IV correction is finished?
Exactly.
And since Grand Super Cycles last “generations” I have probably seen gold at its highest for my lifetime. Wow. This is a bit shocking for me to digest but it makes sense if there is a stock market crash too. Gold will likely crash with it. Amazing. Thank you.
As always, this comes with the caveat that I may be wrong.
It’s my analysis, not a definitive map of the future.
In TA section of Lara’s report indicator ADX has been introduced.
“When price breaks through trend lines and then throws back, if ADX indicates a clear trend is evident, then it offers a good opportunity to join the trend.
ADX is now above 20 and still pointing upwards indicating a new trend. The trend is upwards with the +DX line above the -DX line.
Backtesting of ADX indicator proves how well it works with patience.
ADX is a lagging indicator and may not provide absolute low price entry but one can catch the price just near beginning of trending or start of impulse move down or up.
Study the chart of YINN 3xetf bull for China stock market.
Instablog on GLD and DUST
http://seekingalpha.com/instablog/172149-jsira/4463946-is-gold-recent-run-over-i-think-so#comments_header
DUST daily got a BUY on Monday and NUGT daily got a Sell Monday which are big signs of direction change especially when they were both at extremes the end of last week.
It is hard to consider gold moving up $50 now when it just went up $70 over the last 2 weeks.
Seems more likely gold would drop a few days first, before going up another $50.
“DUST daily got a BUY on Monday” and so far on Tuesday it went down 10%. What’s your signal say now? Is it still a BUY?
thx
I believe that the 195 minute time frame for DUST was more accurate today and at 7:30 am this morning it gave a SELL for DUST and NUGT bottomed at 2:00 pm Monday and got a BUY today at 7:30 am at 195 minute on MACD Indicator.
Richard
Like you to post your chart with signals. Thanks
$USD
Lara is bullish
Rambus is bullish
EWI has a free Forex week and they are saying that the $USD is starting a 3rd wave of 5 of 5 up, so a big move up should be imminent. With this move up likely lasting 6 months or more, one would expect that gold should start it’s next move down very soon….
Charts are based on the EWI count
Weekly COT data telling gold needs to come down. WOW!!!!
But EW count of Lara is saying gold will go up. Gold is going higher.
My indicators are on buy signal short term.
Lara’s ADX is indicating trend is upwards. Watch and follow this indicator.
Hi lara..
Excellent analysis..thnk u for ur efforts..
What makes it intresting that gold took long 4yrs to breach this bear market line like the one which happend with quite good volume…
If this is a start of a medium term bull run..than what will b the target for this bull trend…
Sushil
Let me give a try to answer your question.
If gold has turn to bear market bull trend in cycle wave b than there is no fib relation for wave b to wave a or wave 1. Go to historical gold tab on right side bar and note that there is invalidation for the wave count. $1923.
Ok..thnk u
The invalidation point would be the high of $21.73 from 1923.
It’s not $1,923. That’s the year.