
A small red doji candlestick fits both Elliott wave counts nicely, for the short term.
Summary: Both Elliott wave counts expect a small consolidation has begun. However, we do not have confirmation at the hourly chart level yet. Only a breach of the channel on the hourly chart would provide confidence that the correction has begun. We must accept that price may yet make lower lows before the correction arrives while price remains within the channel. When the channel is breached expect one to three days of choppy upwards / sideways movement which may not move above 1,156.83. Today the probability that the correction has begun is higher due to a small red doji for Thursday’s session on lighter volume, with divergence between price and MACD on the hourly chart at the last low.
Changes to last analysis are bold.
To see the bigger picture on weekly charts click here.
BEAR ELLIOTT WAVE COUNT
Click chart to enlarge.
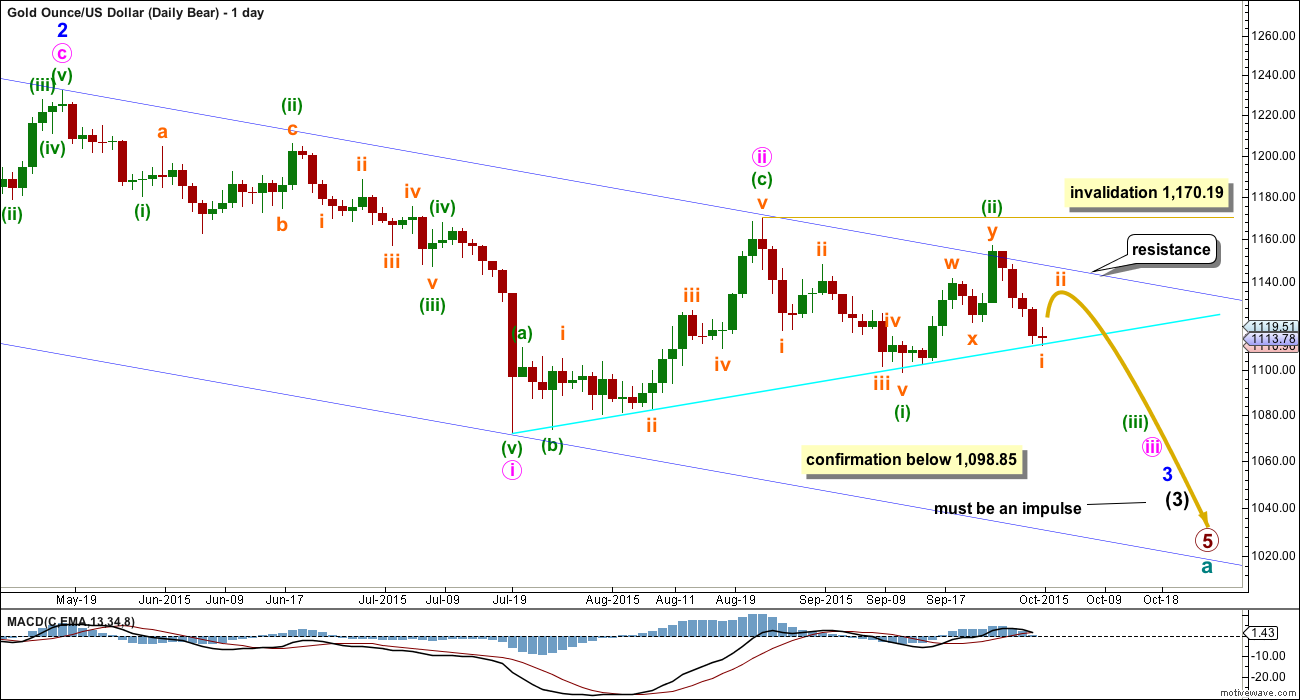
Gold has been in a bear market since September 2011. There has not yet been confirmation of a change from bear to bull, and so at this stage any bull wave count would be trying to pick a low which is not advised. Price remains below the 200 day moving average and below the blue trend line (copied over from the weekly chart). The bear market should be expected to be intact until we have technical confirmation of a big trend change.
This wave count now sees a series of four overlapping first and second waves: intermediate waves (1) and (2), minor waves 1 and 2, minute waves i and ii, and now minuette waves (i) and (ii). Minute wave iii should show a strong increase in downwards momentum beyond that seen for minute wave i. If price moves higher, then it should find very strong resistance at the blue trend line. If that line is breached, then a bear wave count should be discarded.
The blue channel is drawn in the same way on both wave counts. The upper edge will be critical. Here the blue channel is a base channel drawn about minor waves 1 and 2. A lower degree second wave correction should not breach a base channel drawn about a first and second wave one or more degrees higher. If this blue line is breached by one full daily candlestick above it and not touching it, then this wave count will substantially reduce in probability.
Minuette wave (ii) may not move beyond the start of minuette wave (i) above 1,170.19. A breach of that price point should see this wave count discarded as it would also now necessitate a clear breach of the blue channel and the maroon channel from the weekly chart.
Downwards movement from 1,170.19 will subdivide as a complete five wave impulse on the hourly chart, but on the daily chart it does not have a clear five wave look. Subminuette wave iii has disproportionate second and fourth waves within it giving this movement a three wave look on the daily chart.
Minuette wave (ii) will subdivide as a double zigzag, but it has a five wave look on the daily chart, not a three. Both the wave down labelled minuette wave (i) and the wave up labelled minuette wave (ii) have a better fit and look for the bull wave count than the bear at the daily chart level.
Gold has the most textbook looking structures and waves of all the markets I have analysed over the years, probably due to the high volume of this global market. And so I am quite concerned with the look of minuette waves (i) and (ii). Sometimes Gold has movements which don’t look perfect on the daily chart, but this is uncommon.
Sometimes Gold’s impulse waves start out slowly. There is a good example on this daily chart for minute wave i. When the fifth wave approaches that is when momentum sharply increases, and it often ends on a price shock with a volume spike. This is an even more common tendency for Gold’s third wave impulses. The strongest downwards movement is ahead, and it should be expected to arrive when subminuette wave v within minuette wave (iii) begins.
This bear wave count expects Gold is within a third wave at four wave degrees. Expect any surprises to be to the downside for this wave count.
For minuette wave (iii) to have a typical look on the daily chart, I would expect subminuette wave ii to show up as an upwards correction clearly. It would be likely to last about one to three days, with one to three green candlesticks or doji. Thursday’s doji looks like it may be day one of this small correction.
Full and final confirmation of this wave count would come now with a new low below 1,098.85.
I will remove the final target for primary wave 5 at this stage. If it were to reach only equality with primary wave 1 , then this wave count would end about 985. But it has begun with three big overlapping first and second waves, so the target no longer looks low enough. I will calculate a target for primary wave 5 to end at intermediate degree when intermediate waves (3) and (4) are complete. Primary wave 5 may not exhibit a Fibonacci ratio at primary degree.
Click chart to enlarge.
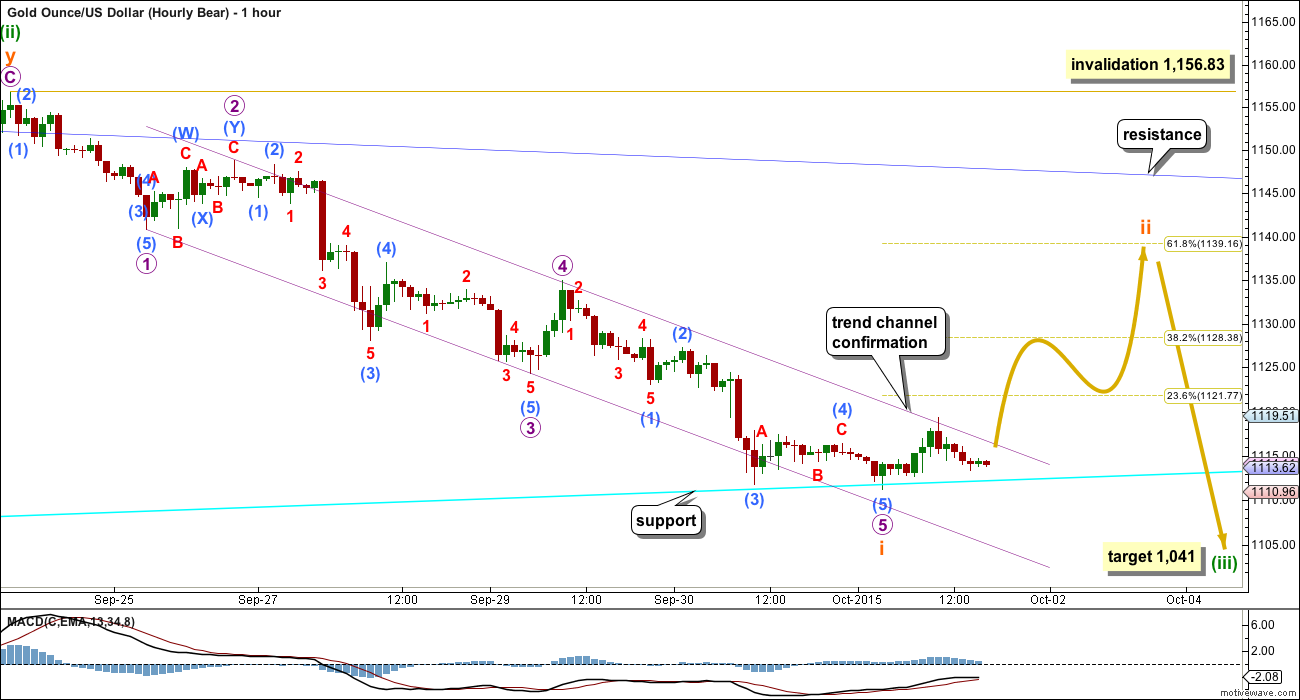
Subminuette wave i looks like it has continued slightly lower. Price is still finding support at the bright aqua blue trend line.
Ratios within subminuette wave i are now: micro wave 3 is 1.37 short of 1.618 the length of micro wave 1, and micro wave 5 is now 0.71 short of equality in length with micro wave 3.
Within subminuette wave i, it is submicro wave (3) within micro wave 5 which has strongest downwards momentum. This is common for Gold when its fifth waves extend.
There is some divergence with price and MACD at the low for Thursday. This indicates a correction is more likely to show up here.
The channel drawn about subminuette wave i is drawn using Elliott’s first technique: draw the first trend line from the ends of micro waves 1 to 3, then place a parallel copy on the end of micro wave 2. When this channel is clearly breached by at least one full hourly candlestick above the upper edge and not touching that trend line, that shall provide trend channel confirmation that subminuette wave i is over and subminuette wave ii has begun.
While price remains within the channel, it must be accepted that the labelling of subminuette wave i as complete may be wrong because the final fifth wave may yet extend further.
Subminuette wave ii may end about either the 0.382 or 0.618 Fibonacci ratios of subminuette wave i. If it gets higher or is very time consuming, then it may find resistance about the upper dark blue trend line copied over here from the daily chart.
There are multiple structural possibilities for subminuette wave ii. It is impossible at the start to tell which will unfold. If it is an expanded flat or combination, it may include a new below its start. The only structures that subminuette wave ii may not be in its entirety are the triangles.
Subminuette wave ii may not move beyond the start of subminuette wave i above 1,156.83.
BULL ELLIOTT WAVE COUNT
Click chart to enlarge.
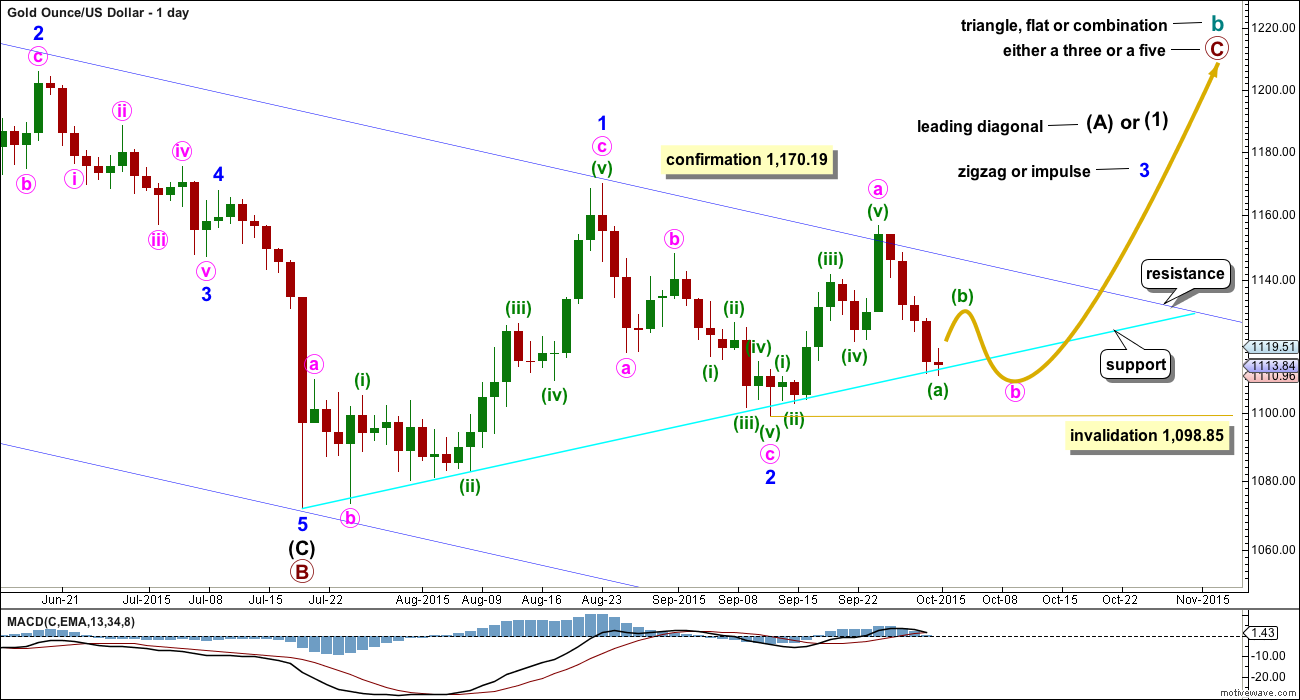
The bull wave count sees cycle wave a complete and cycle wave b underway as either an expanded flat, running triangle or combination. This daily chart works for all three ideas at the weekly chart level.
For all three ideas, a five up should unfold at the daily chart level for a movement at primary degree. This is so far incomplete. With the first wave up being a complete zigzag the only structure left now for intermediate wave (1) or (A) would be a leading diagonal. While leading diagonals are not rare they are not very common either. This reduces the probability of this bull wave count.
A leading diagonal requires the second and fourth waves to subdivide as zigzags. The first, third and fifth waves are most commonly zigzags, the but sometimes may appear to be impulses. So far minor wave 1 fits well as a zigzag.
To the upside, a new high above 1,170.19 would invalidate the bear wave count and provide strong confirmation for this bull wave count.
Upwards movement is finding resistance at the upper edge of the blue channel and may continue to do so. Use that trend line for resistance, and if it is breached, then expect a throwback to find support there.
Price has again come down to touch the bright aqua blue trend line. A bounce up from here would be highly likely.
Minor wave 2 can now be seen as a complete zigzag. It is 0.73 the depth of minor wave 1, nicely within the normal range of between 0.66 to 0.81 for a second wave within a diagonal.
Third waves within leading diagonals are most commonly zigzags, but sometimes they may be impulses. Minor wave 3 should show some increase in upwards momentum beyond that seen for minor wave 1. Minor wave 3 must move above the end of minor wave 1 above 1,170.19. That would provide price confirmation of the bull wave count and invalidation of the bear.
There now looks like a five up on the daily chart within minor wave 3. This may be minute wave a within a zigzag, or it may also be minute wave i within an impulse. The five up may be seen as complete at this stage, so a three down would be expected for this bull wave count. Minute wave b may not move beyond the start of minute wave a below 1,098.85.
Minute wave b is likely to have a clear three wave look to it on the daily chart, so minuette wave (b) is likely to show up as at least one green candlestick or doji. Because so far minute wave b is just a sheer drop and does not look like a three on the daily chart, I do not think it is over yet.
Click chart to enlarge.
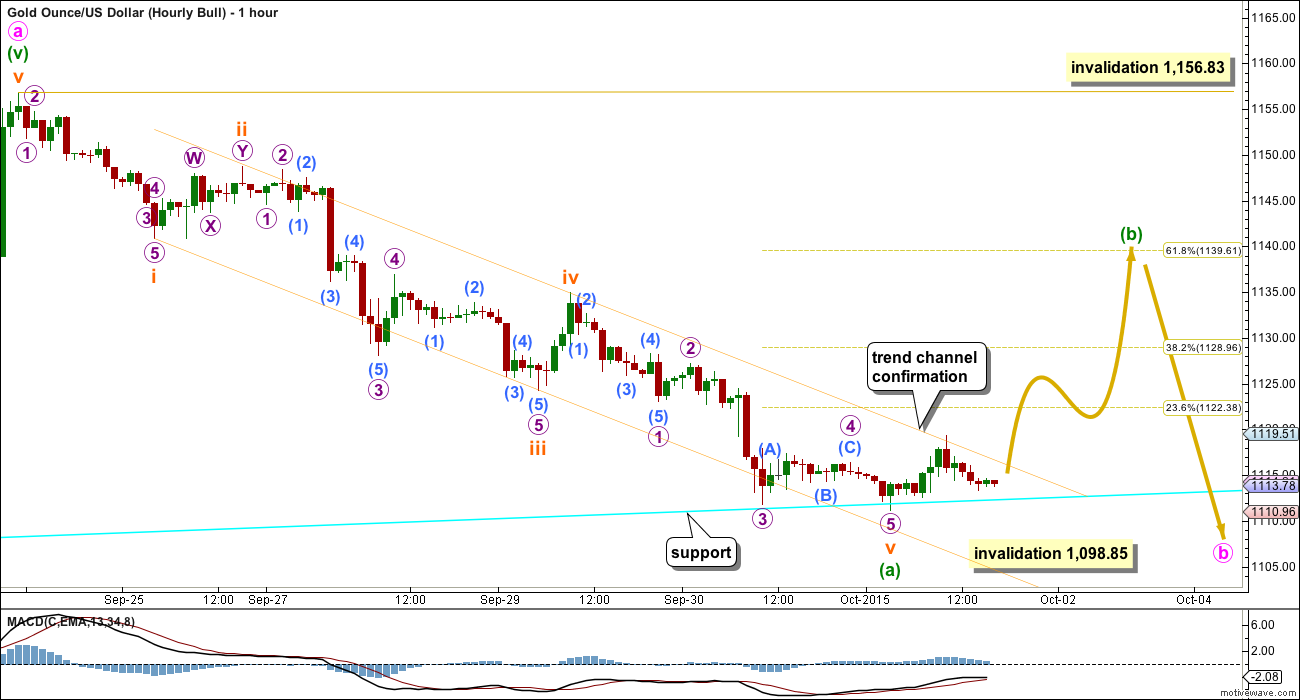
Minuette wave (a) subdivides as a five wave impulse. This now narrows the possible structures for minute wave b to a single or multiple zigzag. Within a zigzag, minuette wave (b) may not move beyond the start of minuette wave (a) above 1,156.83.
Minuette wave (b) may be any one of 23 possible structure including a triangle. If it unfolds as a running triangle, expanded flat or combination, then it may include a new low below its start.
For minute wave b to have a clear three wave look at the daily chart level, minuette wave (b) within it should show up with one to three green candlesticks or doji.
There is no divergence between the two wave counts at the hourly chart level in terms of expected direction at this point, because A-B-C of a zigzag and 1-2-3 of an impulse have exactly the same subdivisions, 5-3-5. The only difference is here a triangle is allowed and it is not for the bear wave count.
When the correction for minuette wave (b) is complete the breakout should be downwards. Minute wave b may not move beyond the start of minute wave a below 1,098.85 for this bull wave count. How low the next wave goes may indicate which wave count is correct.
TECHNICAL ANALYSIS
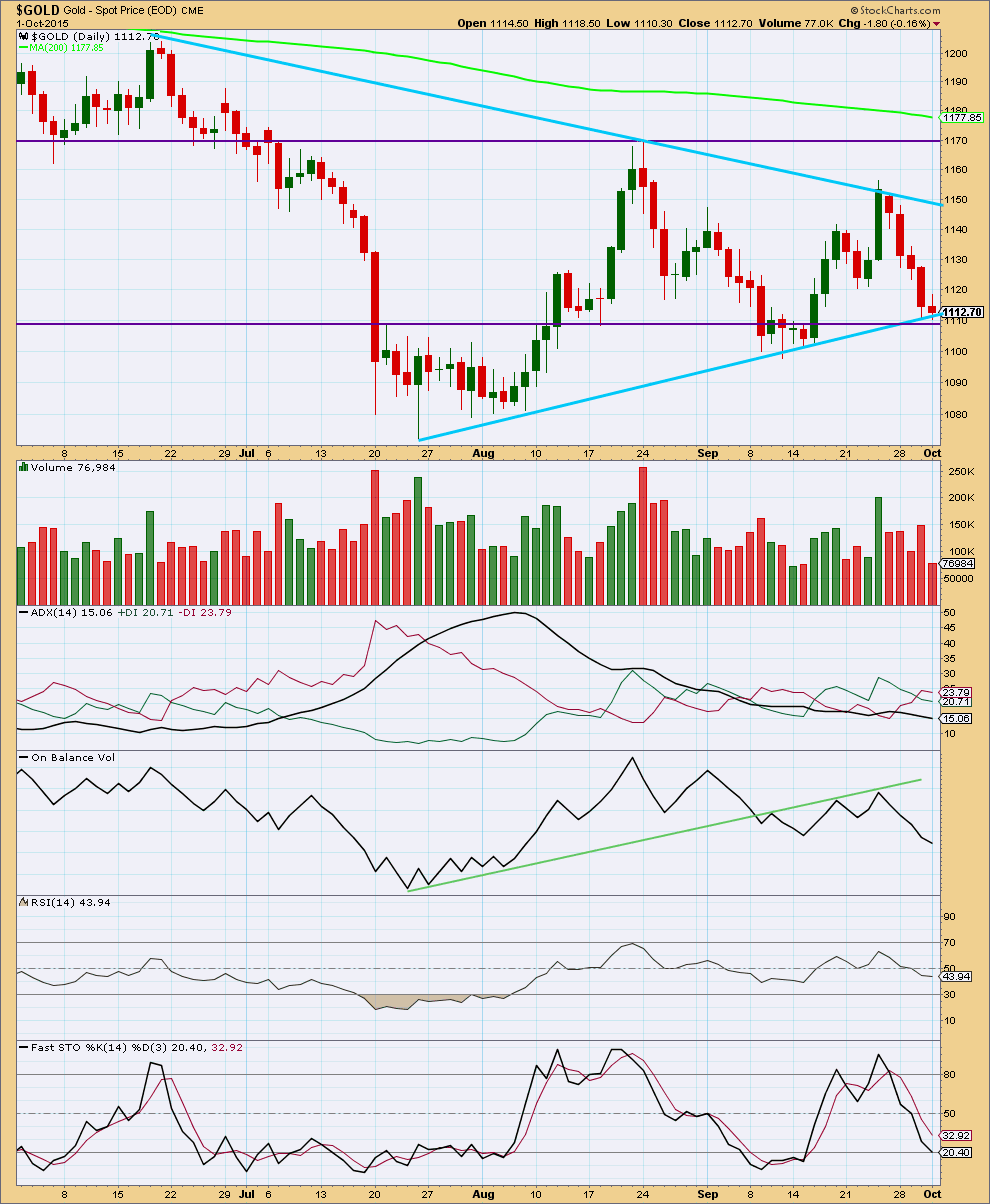
Click chart to enlarge. Chart courtesy of StockCharts.com.
Daily: Today’s small red body (almost a doji on StockCharts data) with even upper and lower wicks looks corrective. It comes on lighter volume which supports the idea that this is a small correction. This fits both Elliott wave counts for the short term.
The black ADX line is pointing downwards which indicates there is no clear trend to the market yet. ADX does tend to be a lagging indicator. ADX has been indicating no clear trend for almost every day since 7th August; Gold has been range bound now for some time. During this time, it is still a downwards day which shows strongest volume which indicates that a downwards breakout would be more likely than upwards.
It would be expected that during this consolidation price should find support at one or both of the upwards sloping aqua blue line or the horizontal purple line.
Overall, volume continues to decline as this consolidation continues. While price is being squashed between the sloping lines providing resistance and support the consolidation comes closer to maturity. The breakout is closer.
A range bound system is outlined here using lines on price for resistance and support in conjunction with Stochastics to indicate overbought / oversold. A downwards swing is underway and should be expected to only end when price finds support at one of the lower trend lines and Stochastics is oversold at the same time. Today price may be finding support, but Stochastics is not yet oversold, so a little more downwards movement would be expected from this approach until Stochastics is oversold. During range bound markets, price does not move from resistance to support in straight lines but most often moves in a choppy and overlapping manner. Price may also overshoot resistance and support before one swing ends and the next begins. This is why trading a range bound market is very risky and best left to the most experienced traders. Stops and good money management are essential to ensure that losses are minimized because of whipsaws during a range bound market.
RSI at the daily chart level is neither overbought or oversold. There is room for the market to rise or fall.
Overall, at this stage, volume analysis indicates the bear wave count may be more likely than the bull.
This analysis is published about 06:56 p.m. EST.
Wow! What a day and what a week! This has been one of the best trading days I’ve had so far. Lara, huge thanks to you for the gold and oil gains today!
MTLSD you played your trade very well.
I’ve been short VXX for a few days, and added UWTI today at about $9.95. Between those and my JNUG adds yesterday at $34.75, it was an amazing day.
Took some profits on my volatility short and JNUG today, but still holding positions to see what’s left on the tank.
It takes nerves of steel for you to stay in 3X or Ultra ETFs over the weekend when there is no clear trend just trying to catch the rogue waves at their finest hour.
Like the monster waves Lara wants to surf this weekend.
I only took a small position in DUST feeling it looked like it had bottomed or almost bottomed in many time frames and at a low for weeks and could hold it awhile if I had to.
I took some profits along the way so it would take something pretty catastrophic on Sunday night to turn it into a loss.
You’re most welcome 🙂
I’m always really stoked to hear members are able to translate my analysis into profits.
I will see this upwards movement as wave C of an expanded flat. On the five minute chart it is complete. It is followed by a five down on the five minute chart, a leading contracting diagonal.
So the probability that this is it for upwards movement will be quite high.
A new low below 1,131.44 would increase that probability: I see that as the earliest start of the final fifth wave up, a new low below 1,131.44 could not be a second wave correction and so the fifth wave up could not be extending.
Both wave counts will expect downwards movement from here. The bear for a huge middle of a third wave to gather momentum. The bull to get close to 1,098.85 but not below.
When I have volume data from StockCharts I’ll be able to make a comment on which wave count is favoured at this point, bull or bear. I can’t do that yet.
Good to hear you think gold has peaked Lara.
I did buy some DUST at $21.30 at 3:02 pm then it hit low of $20.10 at 3:59 pm.
The previous low was $21.50 two weeks ago.
Will anyone be buying DUST or JDST today and holding over the weekend?
DUST just hit today’s low of 21.50 at 2:37 pm the lowest point in 2 weeks since 21.55 two Fridays ago. Back then it then opened up higher on the Monday and peaked Wednesday at 29.18.
Looks like this wave 2 flat about done. Launch in 3 of 3 up
I am. Feel good gold is falling from here but worried about high correlation with equity markets this past week as I expect S&P to get back up to ~2000
100+ move up nxt week in gold
I’ll make a lot of money if that happens. I bought some cheap way out of the money calls with a small portion of my profits today. I just couldn’t stay completely flat lol.
Om merits, with 1140-41 seen as limiting (with 1154 on the outside) and hourly RSI tagging above 70+ Gold price ought to be shorted for a break below 1130 to open up 112x… lol… 🙂
Any wave counts?
Has gold completed a 5 wave up now at today’s high of 1141.36 at 10:06 am from low today of 1104.70 at 6:11 am?
Or was that just the top of the 3rd wave?
Looks like we are about to enter 3 of 3 up.
Long here
I’m inclined to agree. I think that possibility makes it way too risky to try and short here. Huge move in silver, nice move in the miners, lots of other things make me kinda bullish still. But, volume not amazing, and resistance line held, so far. On balance I’d rather be long or flat, and not short.
Out of a portion of JNUG with $5/ share. Still holding some to see how far it goes. Avg. cost in the low 30’s now. What a move in gold!
Anybody here going to load up on shorts today???
I went long at 1105.
Excellent, I sold my shorts at 1109, but did not go long. Looking to reload the shorts today.
Very nice! I went long again late yesterday and got stopped out this morning at a decent price. Made back my my losses and more from trying the long side a little too early this week.
Now question is was this some kind of corrective move, maybe an expanded flat, or the start of something bigger. Probably going to watch and go into the weekend flat, which is unusual for me. But day is still young!
Better to wait for ABC correction first. This is likely just the A wave up. Unless you are good enough to scalp the B wave!
Thanks for the reminder! Going to be a deep correction!
Yes ASAP
I did short today
Is it just me or did gold react more aggressively to the non-farm payroll news than it did after the Fed’s announcement in September?
Yes it took 20 min to almost retrace .618 of the entire move down from 1158 to 1104.
Gold’s aqua S/R line a support now is resistance at 1113 with gold dropping below to 1104.
Awaiting new EW count. Line in sand for bull wave is 1041/1098.
Once again COT data proven to be providing direction of gold. It will be interesting to see what will be today’s COT report??????
We may have hit the bottom of the hourly bear channel at just below 1,104. This may now finally be the end of Subminuette wave 1.
Jobs report confirmed that Subminuette wave 1 is over with the big move up in gold.
Rambus month end chart
Gold lower ahead of Friday jobs report
Oct 1, 2015 9:34 a.m. ET
http://www.marketwatch.com/story/gold-lower-ahead-of-friday-jobs-report-2015-10-01
This upcoming news release may already be effecting gold? It usually has an effect.
Let’s see how gold moves at 8:30 am and by the open.
FRIDAY, OCT. 2
8:30 am Nonfarm payrolls Sept. 200,000 173,000
8:30 am Unemployment rate Sept. 5.1% 5.1%
8:30 am Average hourly earnings Sept. 0.1% 0.3%
Since July the support has been close to the lower aqua blue trend line and October 2nd at 4:13 am gold is down to 1,107.47, below the support line by $6, which may change the 1,139 target, however invalidation is at 1,098.85. Nothing has been invalidated.
Wow! Gold just made a quick 3 dollar move down to a new low below 1,109 and below the aqua blue trend line. As long as we move back up above the line within the hour, the count will still be intact. We’ll know soon.
Gold price appears to be toppy buckling under pivot / 50dma-5dma for bottoming (if price has not bottomed already at 1111/1110ish) unlikely to get below 1109-08…. Momentum has slowed down. Expecting Gold price to rally through 1119 for a check/test of 1136…. Lets see what happens~!
We just keep inching our way down here don’t week. 5 red days in a row, just when Lara says we are at the low, it creeps down a few more bucks. Been trading in and out of JNUG a few times, added twice today at $34.75 area. Maybe we start to move up in this correction now.
That’s the problem with trying to pick a low. And why it often doesn’t work.
Which is why I use channels for confirmation.
The other problem which has shown itself here is some corrective structures include new price extremes beyond their start. This one looks like an expanded flat, and B within that moved in the same direction as the downward trend to make new lows. But it was a B wave, a fake.
Hi Lara, other than a triangle, where else can a ( c ) wave be a corrective 3?
C waves must be fives, they cannot be threes (exception is a C wave within a triangle).
EW distinguishes between a triangle (sideways moving) and a diagonal (has a trend). They’re not the same thing.
C waves can only be impulses or ending diagonals. (except for the C wave within a triangle).
I have short videos on my Education page which goes through the different structures.
Ok, that’s what I thought, thanks