
Price whipsawed taking out both invalidation points and providing more confusion, not clarity.
Summary: More downwards movement is likely at least for the short / mid term. The target is 1,142 to be met in two days time. A new low below 1,120.32 would be very bearish at this stage. Short term a new high above 1,179.50 would indicate more upwards movement.
To see weekly charts for bull and bear click here.
New updates to this analysis are in bold.
BULL ELLIOTT WAVE COUNT
DAILY – COMBINATION
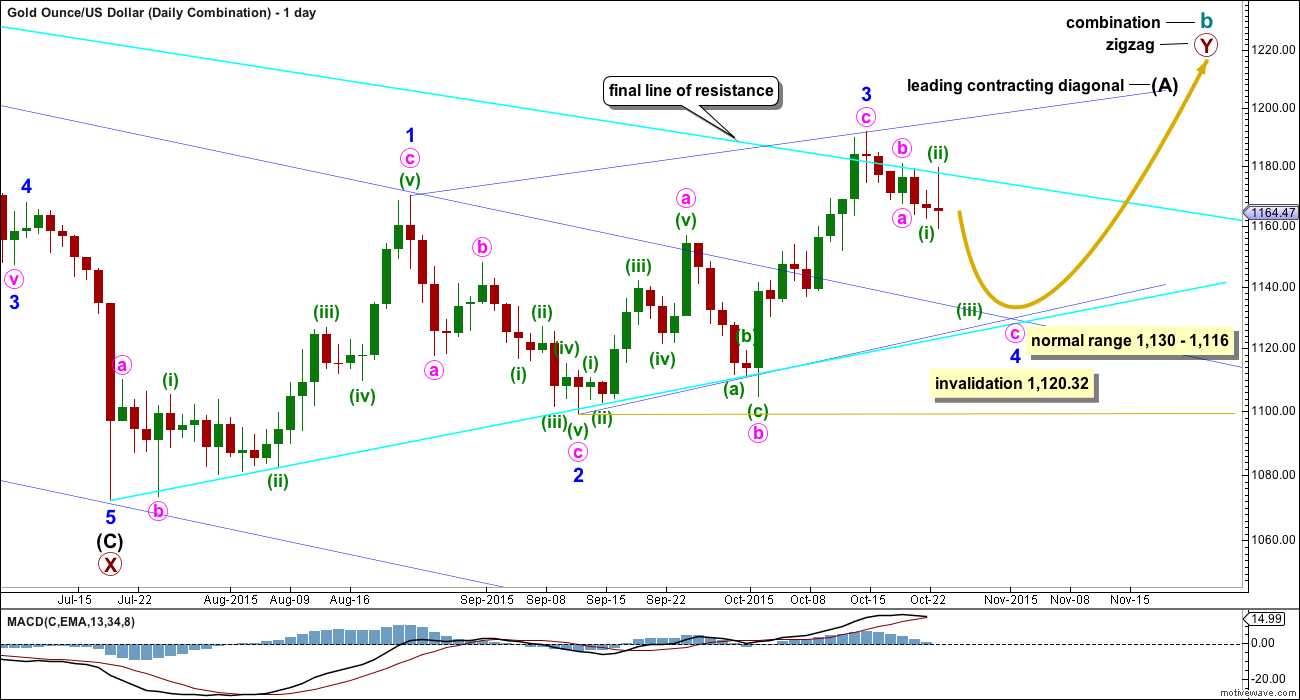
Click chart to enlarge.
If cycle wave b is a combination, then the first structure in the double combination (or double flat) was an expanded flat. The double is joined by a three in the opposite direction labelled primary wave X which was a zigzag.
Downwards movement of the last six days looks now to be too large in price and duration to be part of the prior upwards wave, which now looks like a separate wave. Minor wave 3 may be a complete zigzag of a leading diagonal. Minor wave 3 is shorter than minor wave 1, so the diagonal would be contracting which is the most common type particularly for a leading diagonal. This limits minor wave 4 to no longer than equality in length with minor wave 2. Minor wave 4 may not move below 1,120.32.
A five wave structure would be developing upwards for this wave count as a leading contracting diagonal. Because primary wave Y would be beginning with a five wave structure, this reduces the possible structures to a zigzag. Cycle wave b as a combination would be a flat – X – zigzag.
The normal range for a fourth and second wave within a diagonal is between 0.66 to 0.81 the prior actionary wave. That gives a normal range for minor wave 4 from 1,130 to 1,116. Minor wave 4 must end at the upper edge of the normal range (or above) to remain above the invalidation point.
DAILY – EXPANDED FLAT
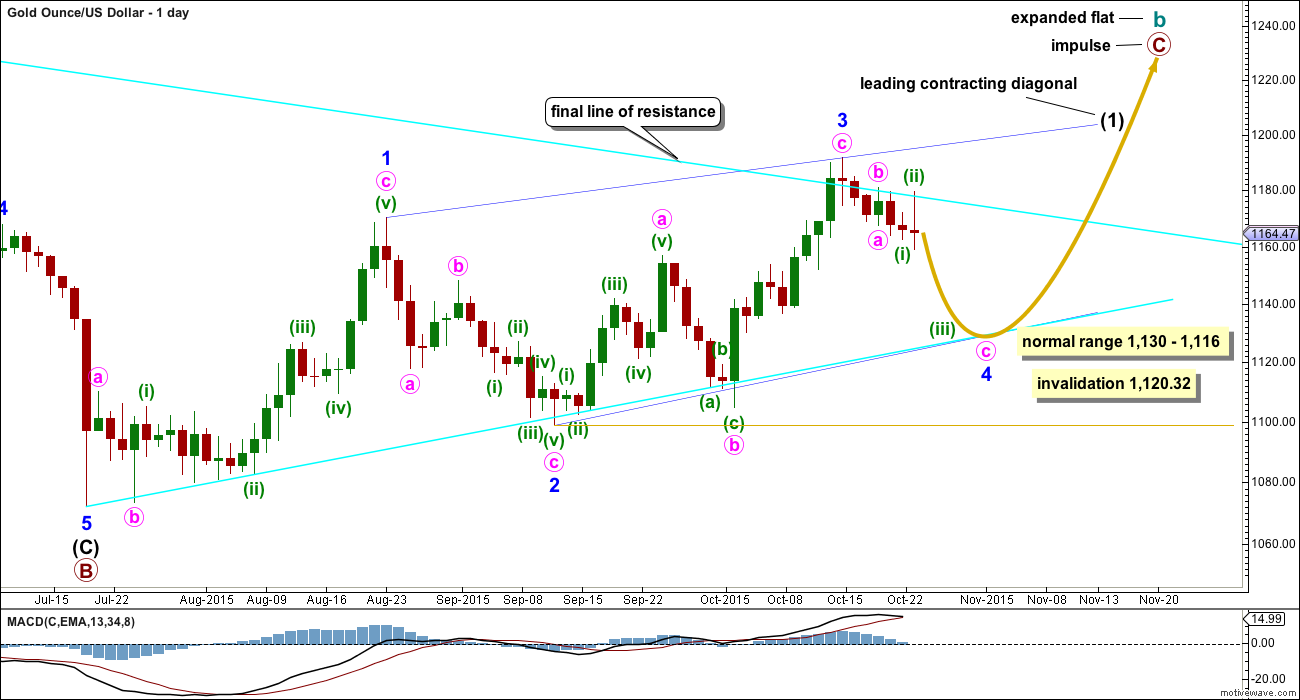
Click chart to enlarge.
Cycle wave b may also be a flat.
If cycle wave b is an expanded flat, then primary wave C must be a five wave structure. The current upwards wave may be unfolding as a leading contracting diagonal, so this would be minor wave (1) within primary wave C.
There are two possible structures for a C wave within a flat correction: an impulse or an ending diagonal. If the first wave is a five and not a zigzag, then this possible structure may be ruled out because ending diagonals require all sub waves to be zigzags. Primary wave C may now only be an impulse.
A leading diagonal requires the second and fourth waves to subdivide as zigzags. The first, third and fifth waves are most commonly zigzags, but sometimes may appear to be impulses. So far minor wave 1 fits well as a zigzag.
Minor wave 2 is 0.73 the depth of minor wave 1, nicely within the normal range of between 0.66 to 0.81 for a second wave within a diagonal.
Third waves within leading diagonals are most commonly zigzags, but sometimes they may be impulses. Minor wave 3 may now be a complete zigzag.
The hourly chart below works for both these first two daily charts.
HOURLY CHART

Click chart to enlarge.
Minor wave 4 would be an incomplete zigzag. This wave count is mostly the same as yesterday’s alternate. The whipsaws of Friday’s session will fit as a continuation of a lower degree fourth wave correction which could have been over at Friday’s low (see the hourly chart for the triangle idea below), but that no longer has the right look at the daily chart level. Downwards movement over the last six days looks to be too long in length and duration to be part of the prior upwards wave. It looks like a new wave at this stage.
Minor wave 4 would very likely be continuing to be a deeper correction. Fourth and second waves within diagonals are normally very deep.
Minute waves a and b may be complete. Minute wave c would reach 1.618 the length of minute wave a at 1,142. When there is more structure within minute wave c, specifically when minuette waves (i) through to (iv) are complete, the target may be calculated at a second wave degree. The target may change at that stage.
The bright blue channel is a best fit about this downwards movement. It may help to show where price may find support and resistance along the way down.
Minor wave 1 lasted 25 days, minor wave 2 lasted 14 days, and minor wave 3 lasted 24 days. Minor wave 4 should be quicker in both length and duration compared to minor wave 2, so that the diagonal trend lines converge meeting the Elliott wave rule for diagonal trend lines of a contracting diagonal. Minor wave 4 has so far lasted 6 days and should complete in a few more days with 7 being the maximum, so it ends in a total Fibonacci 13 days. It may last a total Fibonacci 8 days and continue now for 2 more.
DAILY – TRIANGLE
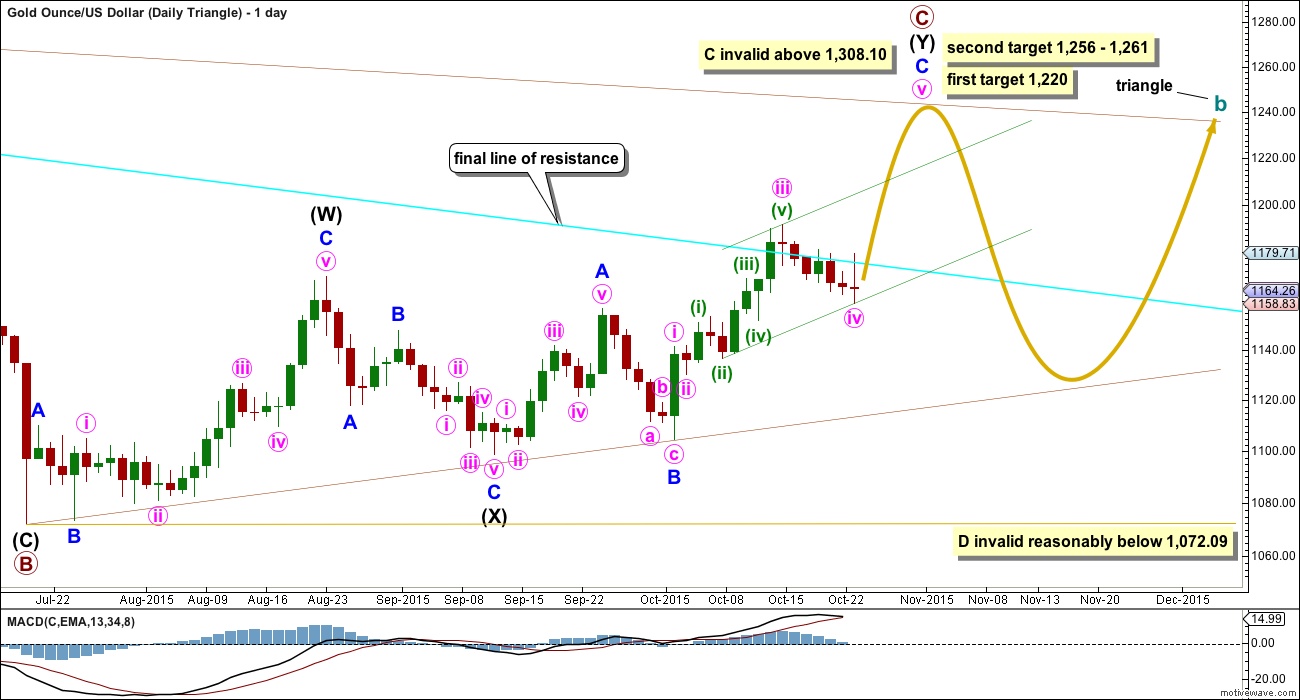
Click chart to enlarge.
This daily chart looks at what a triangle would look like for cycle wave b. The triangle would be a running contracting or barrier triangle. Within the triangle, primary wave C up must be a single or multiple zigzag. Primary wave C may not move beyond the end of primary wave A above 1,308.10.
This idea slightly diverges from the other two ideas for cycle wave b as an expanded flat or combination.
If a triangle is unfolding, then at the weekly chart level primary wave C looks unlikely to be complete and should move higher for the triangle to have the right look. This wave count sees upwards movement as incomplete for minor wave C with a final fifth wave yet to unfold. At 1,220 minute wave v would reach equality in length with minute wave iii. This would see primary wave C end close to 0.618 the length of primary wave B. One of the five sub waves of a triangle is commonly about 0.618 the length of its predecessor.
The second target at 1,256 is where minor wave C would reach 2.618 the length of minor wave A, and at 1,261 primary wave C would reach 0.8 the length of primary wave A.
For the triangle idea, for cycle wave b, a five wave impulsive structure only needs to complete upwards. The next wave down for primary wave D should be fairly time consuming, lasting about 2 to 6 months. Primary wave D may not move beyond the end of primary wave B at 1,072.09 for a contracting triangle. Alternatively, primary wave D may end about the same level as primary wave B at 1,072.09 for a barrier triangle, as long as the B-D trend line remains essentially flat. In practice this means primary wave D can end slightly below 1,072.09 and this wave count remains valid. This is the only Elliott wave rule which is not black and white.
HOURLY – TRIANGLE
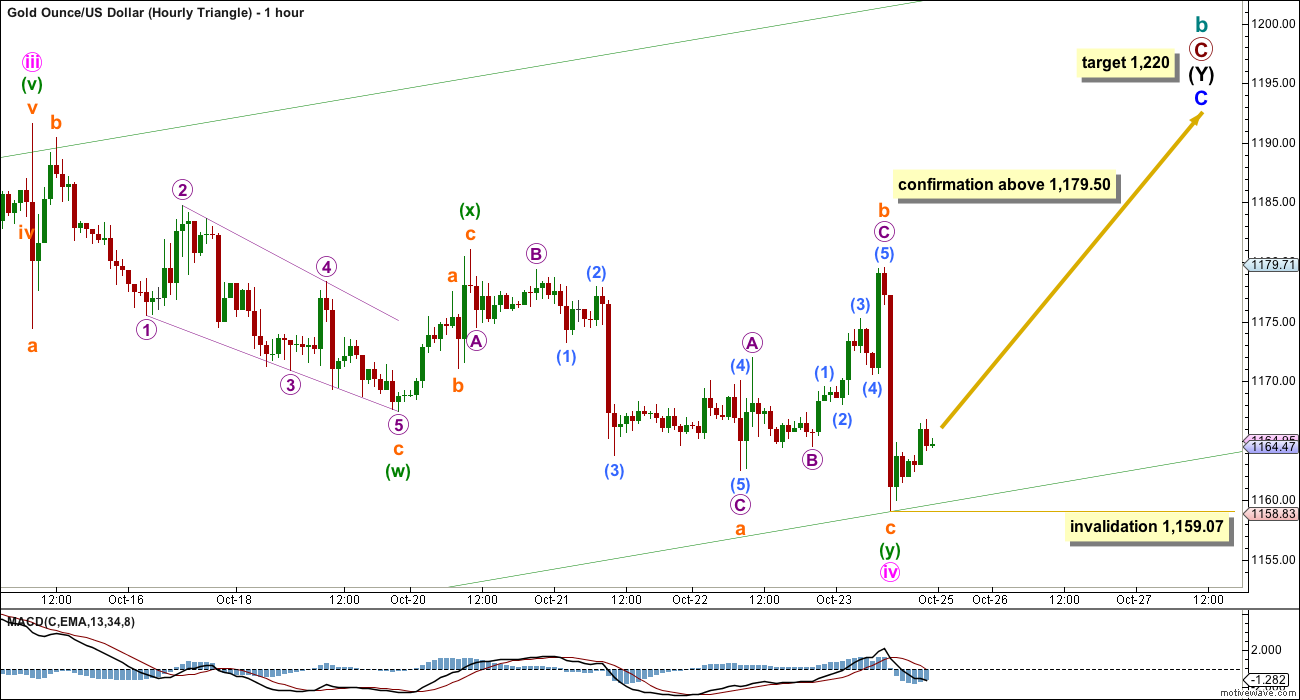
Click chart to enlarge.
A new high now about 1,179.50 would invalidate the first hourly chart and provide some confirmation of this second idea. For the first two daily charts, this idea is also possible; there, the five wave impulse of minute wave c may also be incomplete requiring a final fifth wave upwards.
Minute wave iv may be a complete double flat correction. However, this no longer looks like a typical double flat. Normally they are sideways structures and this one has a reasonable downwards slope.
No second wave correction may move beyond its start below 1,159.07 within minor wave C. If this invalidation point is breached, then the correction for minute wave iv would have been even longer lasting. I would entirely discard the idea at that stage that it could be continuing further as a rare triple or as a deeper zigzag. This would look wrong at the daily chart level.
BEAR ELLIOTT WAVE COUNT
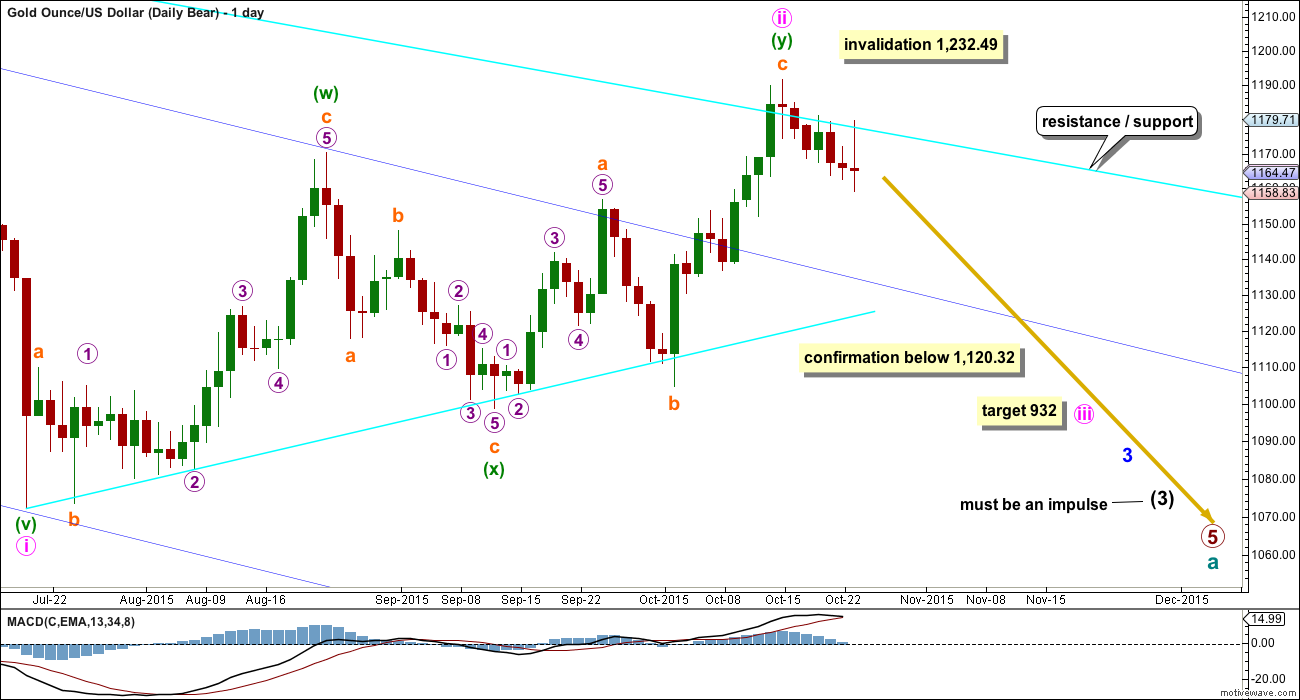
Click chart to enlarge.
The final line of resistance (bright aqua blue line copied over from weekly charts) is only overshot and not so far properly breached. While this line is not breached the bear wave count will remain possible. Simple is best, and the simplest method to confirm a trend change is a trend line. While price remains below this line, it must be accepted that Gold has been in a bear market since 2011 and we don’t have technical confirmation that the bear market has ended.
The most likely possibility is that minute wave ii is a complete double zigzag and deep at 0.75 the length of minute wave i for the bear wave count. It has breached the dark blue base channel drawn about minor waves 1 and 2, one degree higher. When a lower degree second wave correction does this it reduces the probability of the wave count but does not invalidate it. Base channels most often work to show where following corrections find support or resistance, but not always.
At 932 minute wave iii would reach 1.618 the length of minute wave i.
If minute wave ii were to continue further, it may not move beyond the start of minute wave i above 1,232.49. A new high above that price point would be final price invalidation of any bear wave count. That would fully eliminate the concept that Gold remains in a bear market. No bear wave count should be considered above that point.
TECHNICAL ANALYSIS
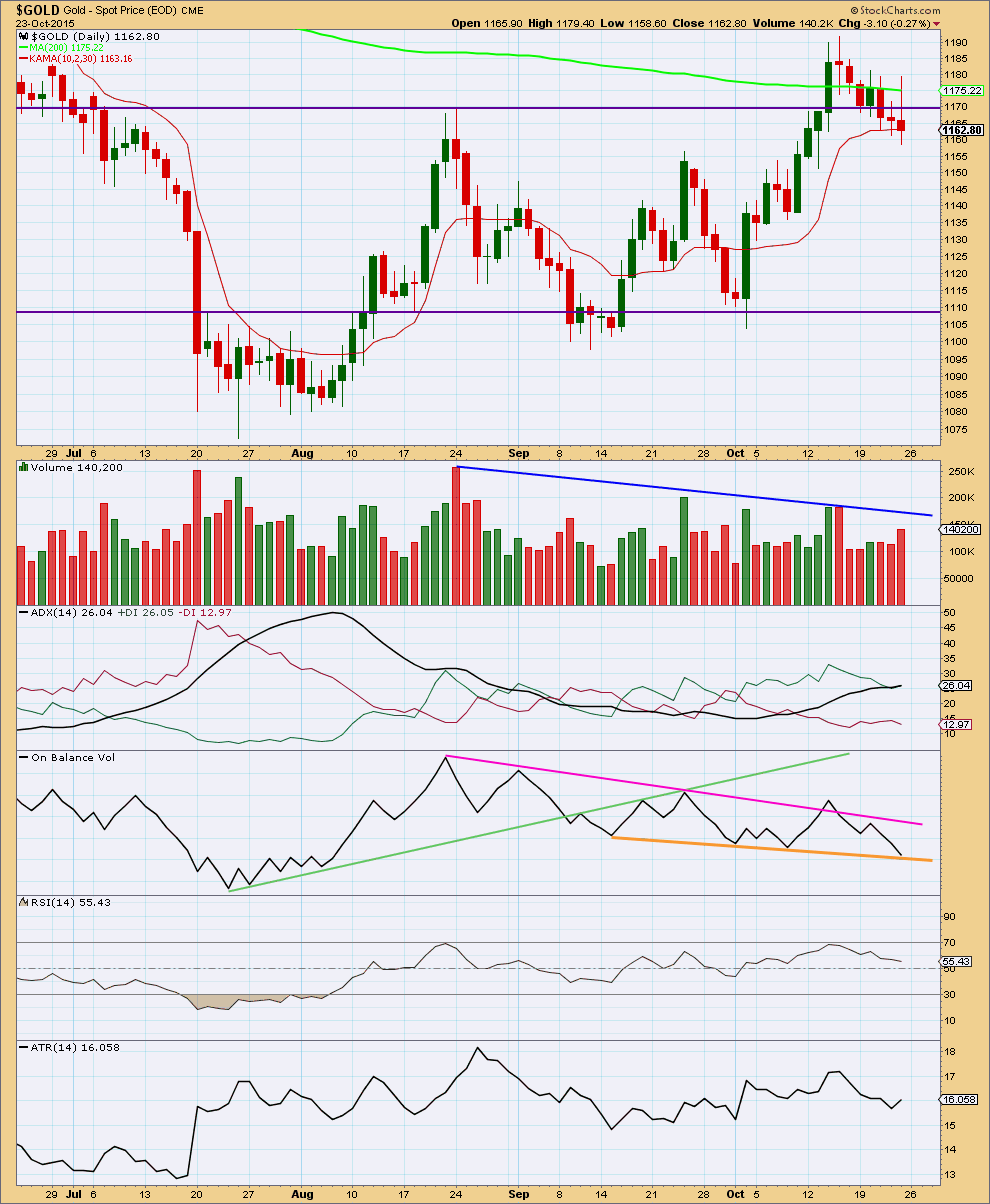
Click chart to enlarge. Chart courtesy of StockCharts.com.
Daily: Friday’s downwards day comes with an increase in volume; the fall in price was supported by volume. This contradicts ADX today.
ADX still indicates an upwards trend is in place.
Neither a 9 day EMA nor Kaufmans Moving Average are now showing where price is finding support.
Overall, it looks like the possible breakout to the upside may have been false. Initially, a break above the horizontal line of resistance delineating the upper edge of a consolidation zone which came on an increase in volume looked like an upwards breakout. However, now price has returned to below the horizontal trend line and overall volume continues to decline. It looks like price may still be in a consolidation although ADX indicates an upwards trend.
It is a downwards day and a downwards week which have highest volume during the consolidation. I am suspecting at the end of this week that the upwards breakout was a false breakout, and a downwards breakout may yet occur in another week or two.
The pink trend line is not working well for On Balance Volume. It is not technically significant enough. OBV may now find some support at the orange trend line, but that too is too short lived and not tested enough to be highly technically significant. It may provide some weak support.
RSI is not yet overbought. There is room for further upwards movement.
I added Average True Range (ATR) to supplement ADX. ATR may be used as an indicator of trending / consolidating. When ATR declines the range price is travelling in declines; this is more typical of price behaviour during a consolidation. When ATR increases the range price is travelling in increases; this is more typical of price behaviour during a trend. Caution must be applied to the use of this indicator. Looking at how it behaves on this daily chart, the overall direction should be considered not each small daily movement.
Since 15th of September ATR has been overall moving higher indicating a trend while price moves higher. At this stage, ATR supports ADX in indicating the market is trending and the trend is up.
This analysis is published about 06:14 p.m. EST.
Subminuette ii can now be seen as a complete three; a double zigzag. It’s 0.52 the depth of subminuette i so it’s a deep correction.
It may be over here…. or the degree of labelling within it may be moved down one degree and that may only be wave A of a more time consuming flat correction.
I would expect it is more likely that it is over as a quicker correction, such a low degree second wave correction would be unlikely to show up on the daily chart.
And so I’ll be expecting downwards movement, a red candlestick for Tuesday’s session, towards the target at 1,142.
For the scenario on the hourly triangle chart price seems to be finding support at the lower green trend line drawn on the daily chart. If price breaks through that line then I may discard the idea that Gold will continue higher from here. It’s looking unlikely.
A leading diagonal may have completed for a first wave, but although it meets all the rules for a leading diagonal it doesn’t fit neatly within its trend lines so it doesn’t look right. This leads me to think the upwards movement for Monday is more likely a correction than the start of an upwards wave. This supports the first hourly chart better.
Sushil
Wave c or pm 5 is an impulse wave down. US oil is in wave 3 of pm wave 5.
The high of 1,169.76 at 10:02 am, not sure if that was the high Lara mentioned before gold heads towards 1,142 target?
Gold may have just finished a 4th wave and started a 5th wave down at 1,167.13 at 1:27 pm.
Any wave count anyone.
Thinking of buying DUST today not sure if gold already peaked today or not.
So much sideways movement today lost track of whether gold is going up or down.
FED FOMC
WEDNESDAY, OCT. 28
2:00 pm FOMC announcement 0%-0.25% 0%-0.25%
http://www.marketwatch.com/Economy-Politics/Calendars/Economic
How many days time frame is expected for crude to complete targeted wave c.
It may be another 8 months
From charts mixed signals for gold’s direction.
One of the powerful ratio is gold to SPX.
Monthly chart is not signalling gold bull just yet.
ADX green is below 20 mark and black line and red line pointing up.
The ratio is below KAMA avg.
A VIEW: There are conflicting signals still confirming an up trend… I wouldn’t give up on the Gold Bull just yet although topping is indicated with a pullback (drop) to occur…. After the drop to 1098-97, topping was seen at 1157-56 & 1146-48 with Gold price dropping to 1104-03 only to come back up to take out both 1146 & 1156 for 1191…….
On Stock market EW per Elliott wave analyst Caldero:
“Currently the market is uptrending from its SPX 1867 Primary IV low. Should this uptrend make new all time highs before it ends, the current high is SPX 2135, probabilities suggest the bull market will end when the uptrend ends. Cycle wave bear markets can be quite nasty. Markets can lose between 45% and 50% of their value in a short period of time. The previous two Cycle wave bear markets were 1937-1942 and 1973-1974. The first one witnessed a 50.2% market decline in just the first 12 months. The second, a 46.6% market decline in just 23 months. After 6+ years of rising prices it is time to start preparing for the next bear market”
It seems that Gold has some very strong resistance to break through if it is going to continue higher most notably:
1) Primary Wave 2 final resistance line (blue) and
2) the 50 week MA which stopped gold dead in its tracks back in May and seems to have done it again here lately.
Lara: Thanks for introducing ADX indicator. I have great success when I use it in conjunction with 9 ema trending.
Your another indicator ATR is interesting. Can you please explain in more detail how to use this one for a trade entry and exit??
Thanks.
There are many PM seniors, juniors and exploration stocks are on buy list now based on ADX/9ema.
I just made two trades based this above indicators one MSFT and SA both went up significantly in next two days. These trades were only to confirm my results of backtesting of this indicator. The result is 100% positive.
In my watch list of stocks highteck, PM sectors there are many flashing buys based on this indicator.
Once I get ATR understood I will be in good shape for profitable trades going forward.
Excited moving forward!!!!!!!!
I will be writing a series of articles on the indicators I use shortly.
I hoped to begin this week, but I still have my exam. I did sit it… but they gave me the wrong one (last curriculum version) so I have to sit the darn thing again.
When that’s done I’ll have more time… for everything.
ATR isn’t useful for trade entry or exit. It’s just used to give a rough guide as to whether the market may be trending or consolidating. I would prefer to use it as an addition to ADX, not alone, because it’s too rough.
Another bullish scenario for gold. A famous chart pattern CUP and Handle.
GDXJ to GLD ratio is pretty reliable indicator for gold trend. The ratio has building bottom (inverse) head and shoulder. Once the neckline is broken gold is expected to go higher.
Note ADX line is turning up and +D1 green is above -D1 red. Also TSI is turning up.
Only MACD needs to turn up which any happen next week.
Ratio is above 9 ema and it is turning up.
Yes COT data is screaming short.
Producer merchant Short report from some one else.
————————————————————–
“Today, the Prod_Merc_Positions_Short_ALL came in at 125,536. The 2014-2015 trading range has been 60,000 (buy) to 90,000 – 120,000 (sell). So today’s data is still a tactical sell, although being lagged data, it can be taken with a grain of salt since it includes the 3 days from last week when Gold was around 1190. We have yet to see how the Producer Merchants are reacting to the current decline in Gold prices. We don’t know if they have started to withhold their hedging in anticipation of higher prices or are still actively hedging knowing that lower prices are still to come.
It can be said that generally, the Producer Merchants do not hedge as much as they currently have for a $30 to $40 drop and usually they play for bigger game ($60 to $100). Therefore, my interpolation of the current data is that they are still on a tactical sell. However, please do your own due diligence and use you normal array of trading tools to guide you. This data set is only to be used to give you a heads up if we are lucky enough to catch a data series that points to a change in Producer Merchant hedging and the Gold price has not moved yet.
By the way. the Swap_Positions_Short_All is now 118,110 and the Swap_Positions_Long_All in now 56,278 yielding a ratio of 2.10. That rates as a strategic sell in my book.”
I updated my COT analysis on the previous thread for anyone interested.
Copied the chart over. If history repeats, looks like gold should go down. Thanks for the chart.
This is my attempt at an update to Lara’s last GDX bear count. We may be ready to start a 3rd wave down at subminuette degree. Looks like there is a wave i down and a wave ii retrace to the .618 mark.
The top may be in for GDX. Chart by EagleSeagle.
Lara,
Thanks for excellent analysis. How is you USD count? It appears to be in a Minute [iii] of MINOR 3 OF Intermediate (5) to take out 100.71 March high and beyond from 97.19 close today for DXZ . BTW Stock Charts has ^DXZ15 futures end of the day nice daily charts, you may want to check it out. Or cash chart above.
If this is correct it will have ongoing downward pressure on GOLD, Oil and other commodities. have a nice w/e
$USD
A break above the upper trend line that has held since March would be very bearish for gold. This could occur next week.
$USD target from Fullgoldcrown
I have the USD still in a fourth wave triangle.
I’ll not be updating much of the free analysis until I’ve finished my exam. It should have been done by now… but most frustratingly it’s not.