
Downwards movement was expected.
Price moved lower, but slowly, to complete a small red doji.
Summary: More downwards movement is likely at least for the short / mid term. The target is 1,142 to be met in one day, although now it looks like it may take a little longer. A new low below 1,120.32 would be very bearish at this stage. Short term a new high above 1,179.50 would indicate more upwards movement.
To see weekly charts for bull and bear click here.
New updates to this analysis are in bold.
BULL ELLIOTT WAVE COUNT
DAILY – COMBINATION
Click chart to enlarge.
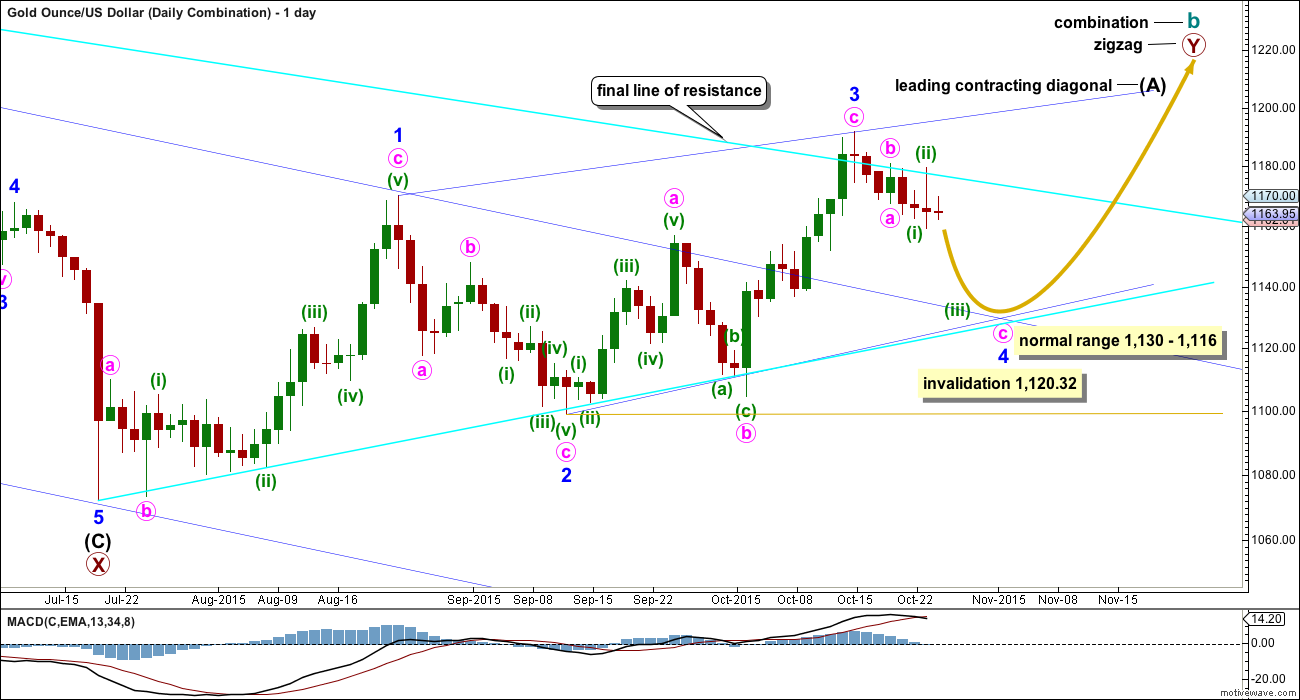
If cycle wave b is a combination, then the first structure in the double combination (or double flat) was an expanded flat. The double is joined by a three in the opposite direction labelled primary wave X which was a zigzag.
Downwards movement of the last several days looks now to be too large in price and duration to be part of the prior upwards wave, which now looks like a separate wave. Minor wave 3 may be a complete zigzag of a leading diagonal. Minor wave 3 is shorter than minor wave 1, so the diagonal would be contracting which is the most common type particularly for a leading diagonal. This limits minor wave 4 to no longer than equality in length with minor wave 2. Minor wave 4 may not move below 1,120.32.
A five wave structure would be developing upwards for this wave count as a leading contracting diagonal. Because primary wave Y would be beginning with a five wave structure, this reduces the possible structures to a zigzag. Cycle wave b as a combination would be a flat – X – zigzag.
The normal range for a fourth and second wave within a diagonal is between 0.66 to 0.81 the prior actionary wave. That gives a normal range for minor wave 4 from 1,130 to 1,116. Minor wave 4 must end at the upper edge of the normal range (or above) to remain above the invalidation point.
DAILY – EXPANDED FLAT
Click chart to enlarge.
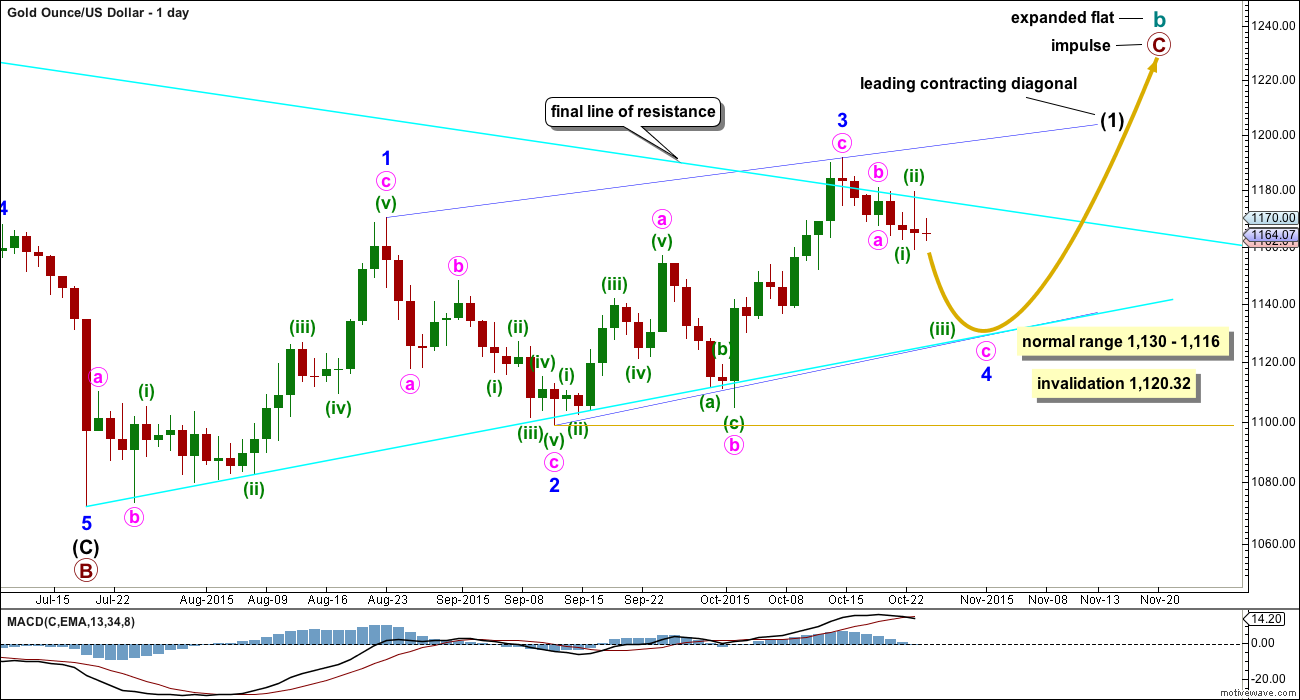
Cycle wave b may also be a flat.
If cycle wave b is an expanded flat, then primary wave C must be a five wave structure. The current upwards wave may be unfolding as a leading contracting diagonal, so this would be minor wave (1) within primary wave C.
There are two possible structures for a C wave within a flat correction: an impulse or an ending diagonal. If the first wave is a five and not a zigzag, then an ending diagonal may be ruled out because ending diagonals require all sub waves to be zigzags. Primary wave C may now only be an impulse.
A leading diagonal requires the second and fourth waves to subdivide as zigzags. The first, third and fifth waves are most commonly zigzags, but sometimes may appear to be impulses. So far minor wave 1 fits well as a zigzag.
Minor wave 2 is 0.73 the depth of minor wave 1, nicely within the normal range of between 0.66 to 0.81 for a second wave within a diagonal.
Third waves within leading diagonals are most commonly zigzags, but sometimes they may be impulses. Minor wave 3 may now be a complete zigzag.
The hourly chart below works for both these first two daily charts.
HOURLY CHART
Click chart to enlarge.
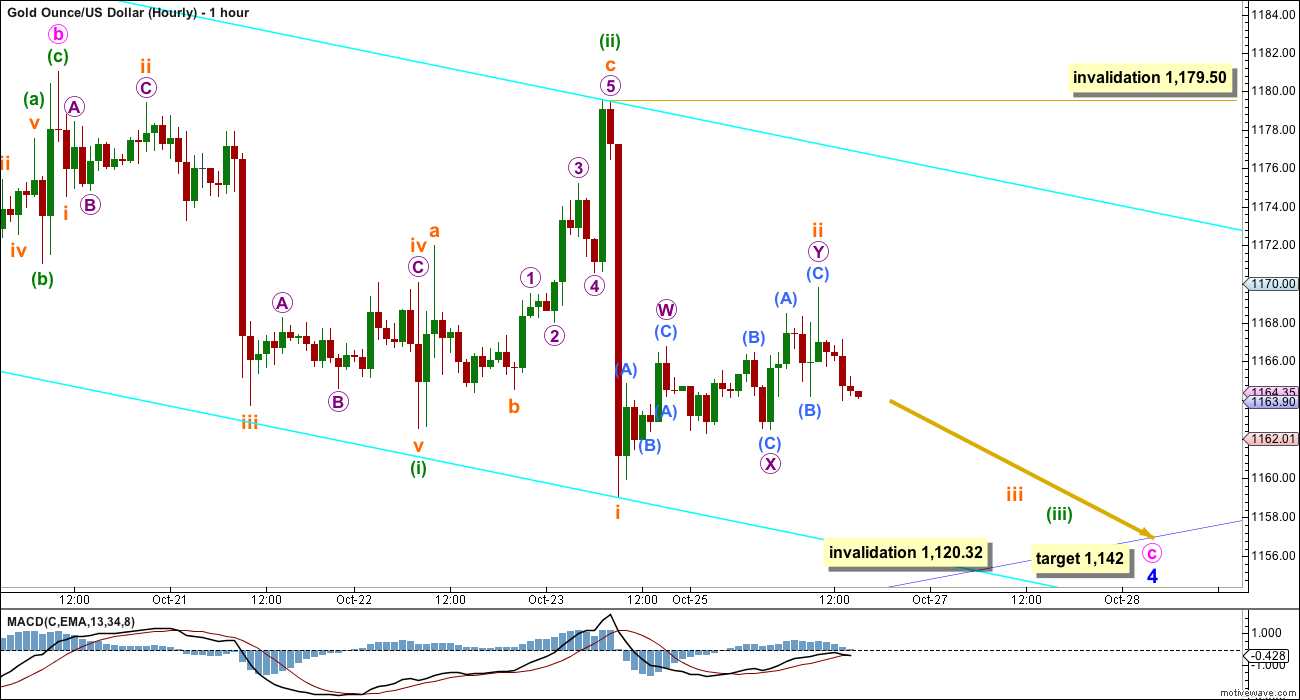
Minor wave 4 would very likely be continuing to be a deeper correction. Fourth and second waves within diagonals are normally very deep.
Minute waves a and b may be complete. Minute wave c would reach 1.618 the length of minute wave a at 1,142. When there is more structure within minute wave c, specifically when minuette waves (i) through to (iv) are complete, the target may be calculated at a second wave degree. The target may change at that stage.
The bright blue channel is a best fit about this downwards movement. It may help to show where price may find support and resistance along the way down.
Minor wave 1 lasted 25 days, minor wave 2 lasted 14 days, and minor wave 3 lasted 24 days. Minor wave 4 should be quicker in both length and duration compared to minor wave 2, so that the diagonal trend lines converge meeting the Elliott wave rule for diagonal trend lines of a contracting diagonal. Minor wave 4 has so far lasted 7 days. It may end in one more day if it lasts a total Fibonacci 8, but this looks less likely today. It may last up to a further 6 days, if it completes in a Fibonacci 13.
Within minute wave c, minuette waves (i) and (ii) are complete. Minuette wave (iii) should have begun. Price may now be ready to move to the middle of this third wave. Downwards momentum may increase in the next 24 hours.
DAILY – TRIANGLE
Click chart to enlarge.
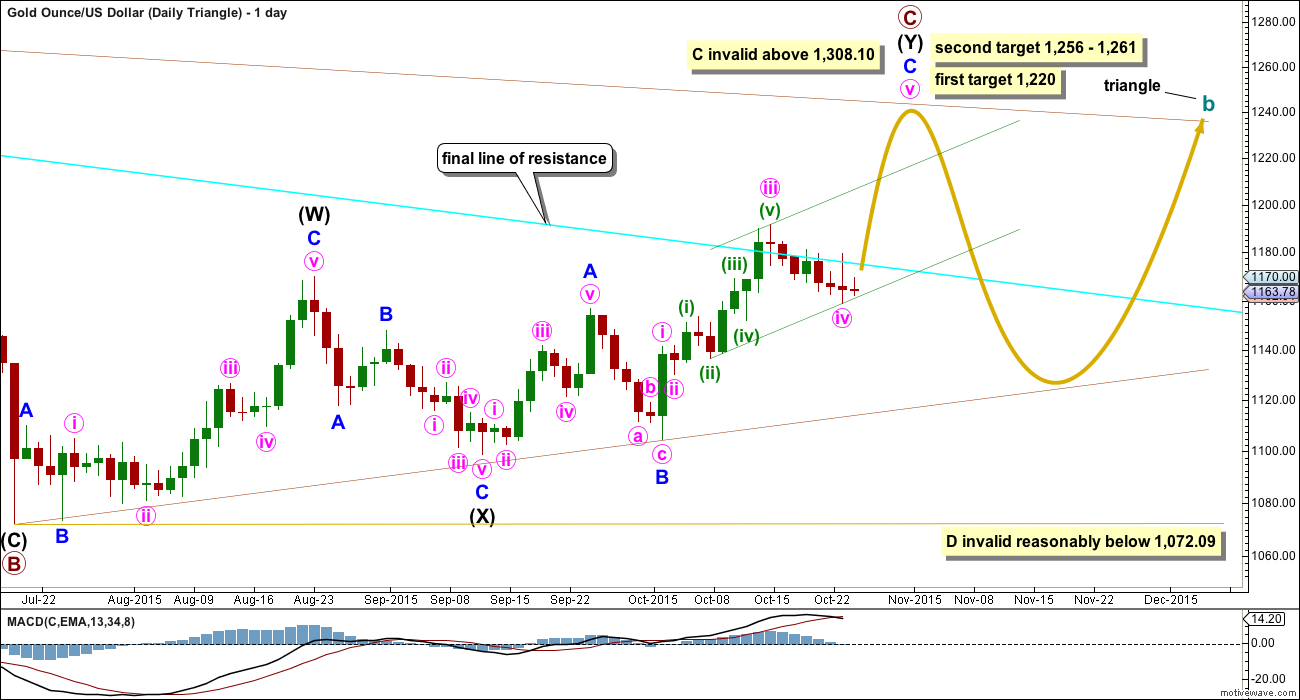
This daily chart looks at what a triangle would look like for cycle wave b. The triangle would be a running contracting or barrier triangle. Within the triangle, primary wave C up must be a single or multiple zigzag. Primary wave C may not move beyond the end of primary wave A above 1,308.10.
This idea slightly diverges from the other two ideas for cycle wave b as an expanded flat or combination.
If a triangle is unfolding, then at the weekly chart level primary wave C looks unlikely to be complete and should move higher for the triangle to have the right look. This wave count sees upwards movement as incomplete for minor wave C with a final fifth wave yet to unfold. At 1,220 minute wave v would reach equality in length with minute wave iii. This would see primary wave C end close to 0.618 the length of primary wave B. One of the five sub waves of a triangle is commonly about 0.618 the length of its predecessor.
The second target at 1,256 is where minor wave C would reach 2.618 the length of minor wave A, and at 1,261 primary wave C would reach 0.8 the length of primary wave A.
For the triangle idea, for cycle wave b, a five wave impulsive structure only needs to complete upwards. The next wave down for primary wave D should be fairly time consuming, lasting about 2 to 6 months. Primary wave D may not move beyond the end of primary wave B at 1,072.09 for a contracting triangle. Alternatively, primary wave D may end about the same level as primary wave B at 1,072.09 for a barrier triangle, as long as the B-D trend line remains essentially flat. In practice this means primary wave D can end slightly below 1,072.09 and this wave count remains valid. This is the only Elliott wave rule which is not black and white.
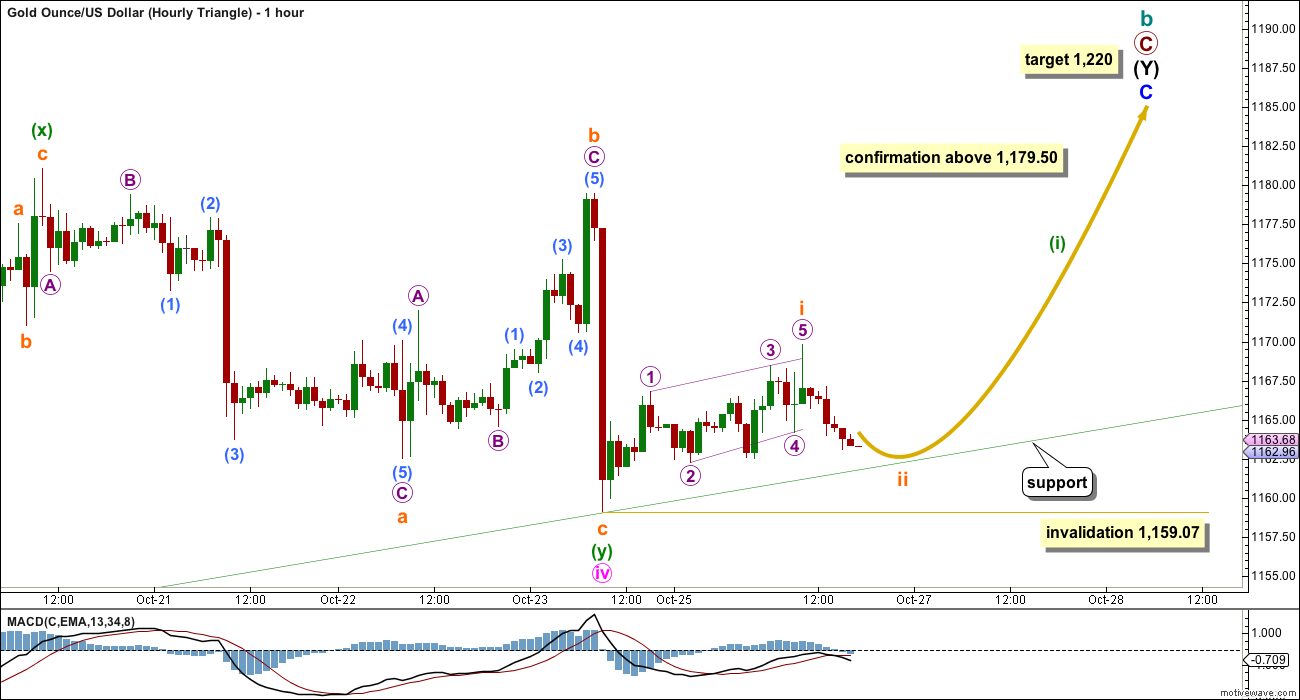
HOURLY – TRIANGLE
Click chart to enlarge.
A new high now about 1,179.50 would invalidate the first hourly chart and provide some confirmation of this second idea. For the first two daily charts, this idea is also possible; there, the five wave impulse of minute wave c may also be incomplete requiring a final fifth wave upwards.
Minute wave iv may be a complete double flat correction. However, this no longer looks like a typical double flat. Normally they are sideways structures and this one has a reasonable downwards slope.
No second wave correction may move beyond its start below 1,159.07 within minor wave C. If this invalidation point is breached, then the correction for minute wave iv would have been even longer lasting. I would entirely discard the idea at that stage that it could be continuing further as a rare triple or as a deeper zigzag. This would look wrong at the daily chart level.
Subminuette wave ii should find support at the lower edge of the green channel. The first indication that this idea would be wrong would be a breach of that trend line.
BEAR ELLIOTT WAVE COUNT
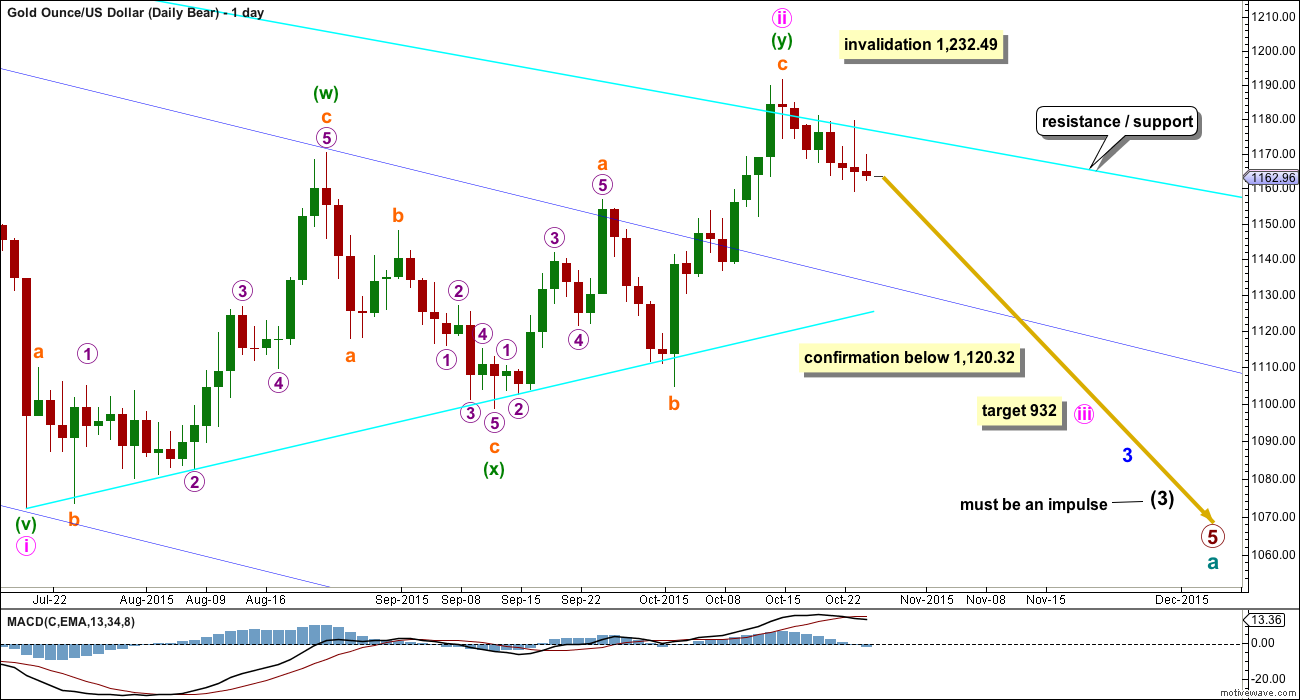
Click chart to enlarge.
The final line of resistance (bright aqua blue line copied over from weekly charts) is only overshot and not so far properly breached. While this line is not breached the bear wave count will remain possible. Simple is best, and the simplest method to confirm a trend change is a trend line. While price remains below this line, it must be accepted that Gold has been in a bear market since 2011 and we don’t have technical confirmation that the bear market has ended.
The most likely possibility is that minute wave ii is a complete double zigzag and deep at 0.75 the length of minute wave i for the bear wave count. It has breached the dark blue base channel drawn about minor waves 1 and 2, one degree higher. When a lower degree second wave correction does this it reduces the probability of the wave count but does not invalidate it. Base channels most often work to show where following corrections find support or resistance, but not always.
At 932 minute wave iii would reach 1.618 the length of minute wave i.
If minute wave ii were to continue further, it may not move beyond the start of minute wave i above 1,232.49. A new high above that price point would be final price invalidation of any bear wave count. That would fully eliminate the concept that Gold remains in a bear market. No bear wave count should be considered above that point.
TECHNICAL ANALYSIS
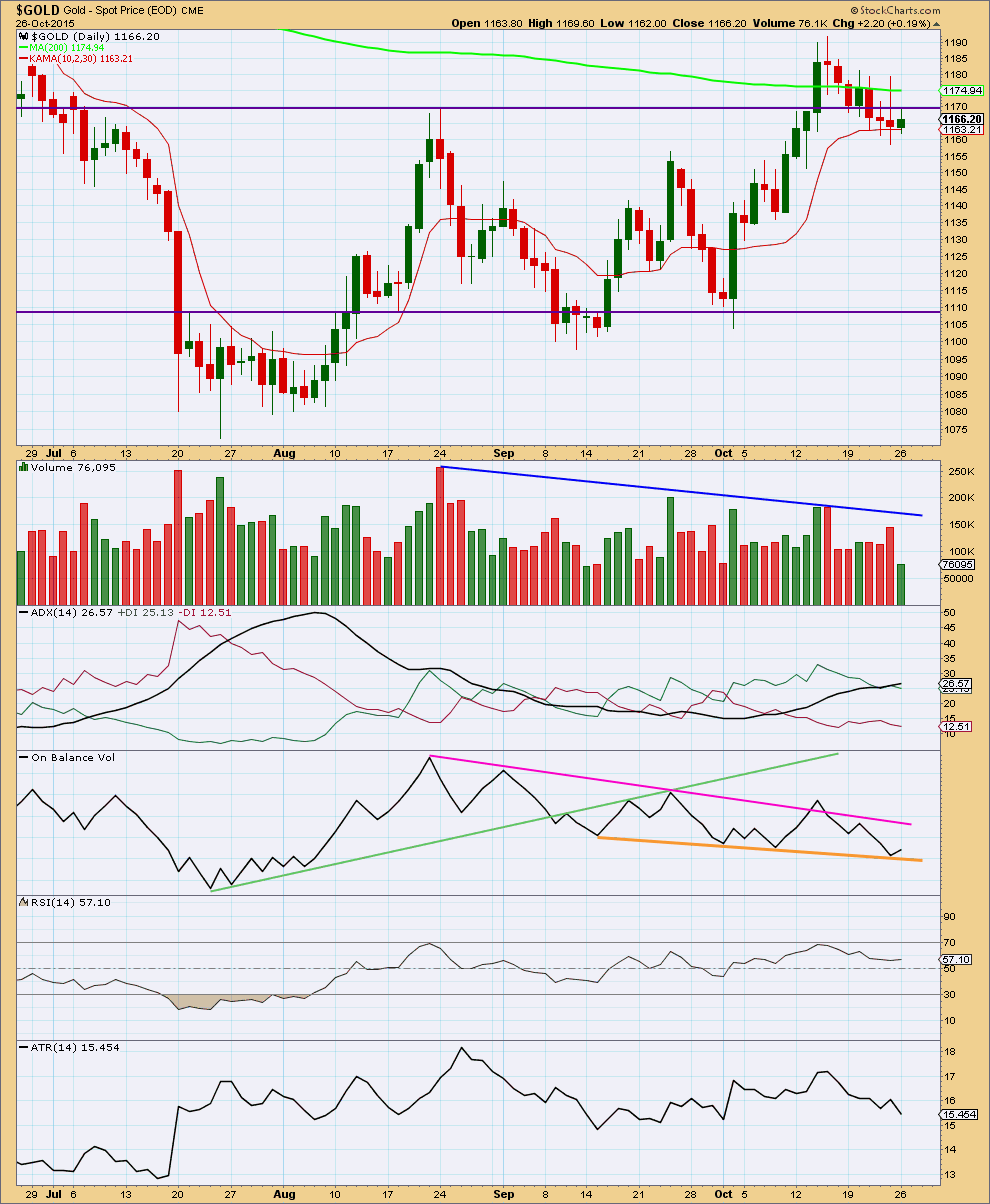
Click chart to enlarge. Chart courtesy of StockCharts.com.
Daily: Monday completed a small green candlestick on StockCharts data with light volume. The small rise in price was not supported by volume suggesting it was corrective. This again contradicts ADX which expects Gold is in an upwards trend. Volume is not confirming the trend, and it is suspicious.
For Monday upwards movement found resistance at the horizontal trend line which previously provided support. It is increasingly looking like the upwards breakout nine days ago was false. If that is the case, then Gold remains within a consolidation that has been moving price sideways since about 7th August. It is a downwards day and a downwards week which have highest volume during the consolidation.
Neither a 9 day EMA nor Kaufman’s Moving Average are now showing where price is finding support.
The orange trend line has provided support for On Balance Volume. The strength of this line is reinforced; it has now been tested three times. A break below this line would be reasonably bearish. A break above the pink line would be bullish.
I added Average True Range (ATR) to supplement ADX. ATR may be used as an indicator of trending / consolidating. When ATR declines the range price is travelling in declines; this is more typical of price behaviour during a consolidation. When ATR increases the range price is travelling in increases; this is more typical of price behaviour during a trend. Caution must be applied to the use of this indicator. Looking at how it behaves on this daily chart, the overall direction should be considered not each small daily movement.
Since 15th October ATR has been declining. The mid / short term indication from ATR is that price is now consolidating and not trending. Today ATR moved to a new low and the range price travelled in is smaller, typical of a consolidation.
This analysis is published about 06:22 p.m. EST.
I added some GDX short term calls to my GLD short position, should be a good hedge with a c wave up in gold.
Lara, are you thinking this c wave is done tomorrow and heads to the 1142 area by end of week?
Thanks,
Any wave counts?
12:09 pm EST 1,167.61 It looks like gold is finishing a 2nd wave up and going to drop?
If gold stalls in this area then DUST will drop as it is higher than yesterday and Gold is also higher .
To me it looks like gold is correcting in a simple ABC fashion, with A and B already complete. The C wave up has perhaps completed wave 1 of 5, with 2 of 5 underway. The whole corrective structure should end in approximately 24 hours. My target zone for C to end is between 1171 (equality with A) and 1178 (1.618 x A). The 200 day moving average – currently around 1176 – seems like a plausible final target. Thereafter, gold should continue to decline.
Matt, very good wave count.
Thx
Exactly.
You’re a fantastic teacher.
The downwards movement from the high I have labelled subminuette ii on the first hourly chart subdivides as a three.
Which indicates subminuette ii was not over and is continuing.
I will relabel subminuette ii as a more time consuming zigzag. It can’t be a flat because B is < 90% of A. A would be a leading diagonal as I have that movement labelled for the second hourly chart. B would be a simple zigzag, now complete. C upwards is most likely incomplete, it is likely to move above A at 1,169.79 to avoid a truncation. At 1,172 C would = A in length. If that target is wrong it may not be high enough, because at this stage I would expect only 1-2 are complete within C. C needs to be a five and so 3-4-5 still need to complete upwards.
Lara: I am surprised about gold’s stockchart variation. Your chart above has green candle for yesterday trading. My chart has small red doji???? Uhhhh
Volume is same.
It is what it is.
StockCharts and FXCM are using different data feeds. Mostly there is little to no difference, sometimes there is a material difference.
The wave counts with each set of data would therefore be slightly different from time to time.
It doesn’t mean that one is “right” and the other is “wrong”, they’re just slightly different because each includes or excludes some different parts of the global market.
You would think that in the age of the internet and with everything being digital and immediate “they” could resolve it and have a truly global real time accurate data feed for a big market such as gold (the biggest?). But “they” haven’t sorted it out. Yet.
and it turns out that StockCharts now has the same candlestick, small and red, for the 26th October, as FXCM.
the problem is the time I do the analysis
StockCharts don’t finalise their data until 6:30pm EST. And I try to get the analysis out earlier than that.
And you do great analysis Lara.
http://m.in.investing.com/analysis/charts-of-the-day:-gold,-oil-moving-toward-200dma-breakthrough-3427
Besides the FOMC meeting statement on Wednesday, at least 4 of the top 10 GDX component miners release their earnings this week.
ABX – Earnings Wednesday after the close
GG – Earnings Wednesday after the close
NEM – Earnings Wednesday after the close
AEM – Earnings Thursday before market open
Wednesday and Thursday should be interesting…
GDX chart by Mark shows a bearish H&S pattern with a short term target at the lower trend line of 14.8. This would be a 7.5% move down. An equivalent move in DUST would be over 20%. Short term DUST target is 16. DUST closed at 13.16 today.
Took a small GLD short position today. I’ve been short oil for a week or so, which is going well (Thanks Lara!). Waiting for the stock market to show get on with the show.
No positions in miners right now, other than a few shares long in individual names.
Brilliant. Yes, Oil is behaving nicely. Relatively easy to analyse, doing as expected, only one wave count.
I dream of and wish for the day when Gold will again behave in the same way.
And as for the indices…. nerve wracking those bear market rallies are. Every time they are deep everyone questions if the bear market really is in, or has the bull market returned.
IMHO Gold price is finding support at 1160, unlikely to get below 20dma 1157-56 for an upside move is expecting to test a break above 1174-76 (200dma) for possibly 1185+ before topping….. 50dma is about to cross above 100dma which should be bullish~!
I agree that there may possibly be some minor upwards movement here, but more of a consolidation than anything else. I don’t foresee a break of the 200 day, just a last (failed) attempt.
To add to this, gold has already retraced .618 of the move from 1191 down to the recent low. I am, of course, looking at this with bearish goggles and am just assuming some form of sideways/upwards movement into the FOMC meeting.
Matt: Bearish here too looking for a suitable short sell entry. Key to firstly rise above 1167-68 (which was seen on Monday) and then rise above 1173 would go looking for more… Will stay long if by any outside chance 1188-89 gets taken out today….
Lara,
I may have missed something, but I did not see any commentary concerning hourly movement for the bear count. Do you see this last smaller upward movement as a complete correction, or is there still room for one last push to the 1170s? Thanks.
Lara left hourly bear count out Friday and Monday because the bear count is less probable.
The subdivisions would be exactly the same as the first hourly chart; a series of first and second waves complete, ready to move into a third wave.
I’ll make this clearer today. That the subdivisions are the same.