
A slight new high on light volume changes both Elliott wave counts.
The bull and bear Elliott wave counts now diverge.
Summary: The bear wave count expects downwards movement and would be confirmed with a new low below 1,098.85; the target is 1,058. The bull wave count expects upwards movement and would be confirmed with a new high above 1,156.83; the target is 1,163.
Changes to last analysis are bold.
To see the bigger picture on weekly charts click here.
BEAR ELLIOTT WAVE COUNT
Click chart to enlarge.
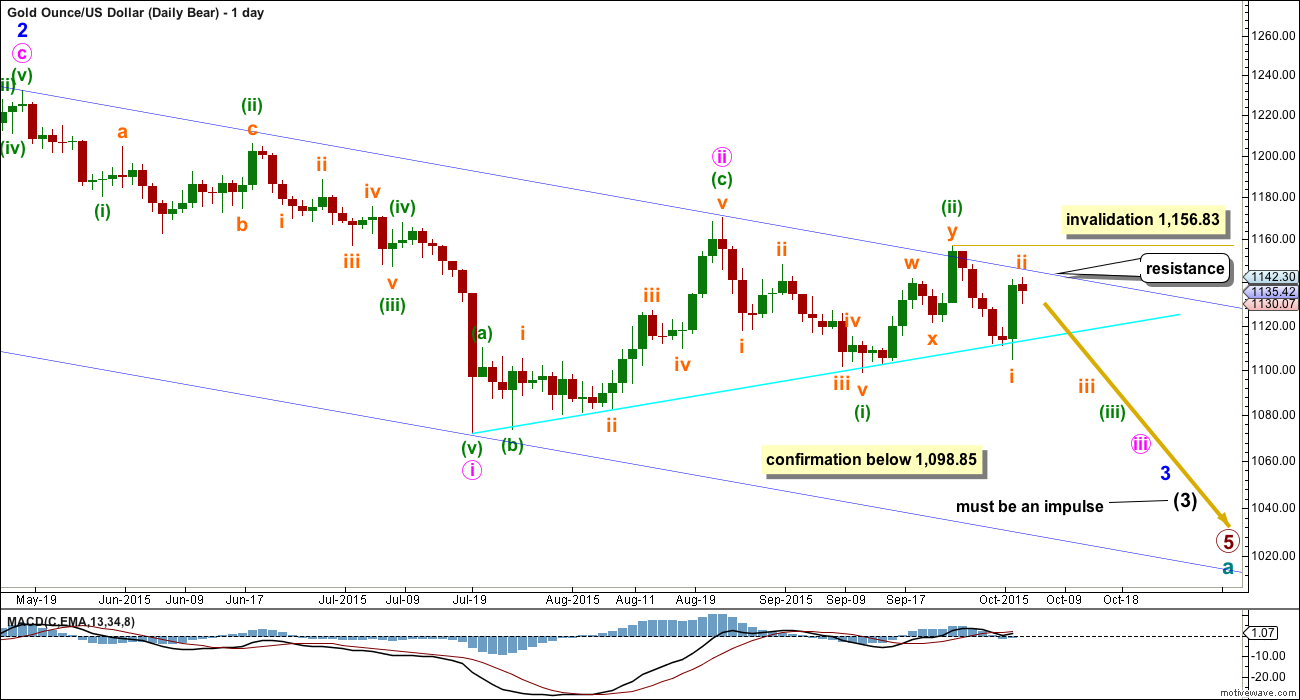
Gold has been in a bear market since September 2011. There has not yet been confirmation of a change from bear to bull, and so at this stage any bull wave count would be trying to pick a low which is not advised. Price remains below the 200 day moving average and below the blue trend line (copied over from the weekly chart). The bear market should be expected to be intact until we have technical confirmation of a big trend change.
This wave count now sees a series of five overlapping first and second waves: intermediate waves (1) and (2), minor waves 1 and 2, minute waves i and ii, minuette waves (i) and (ii), and now subminuette waves i and ii. Minute wave iii should show a strong increase in downwards momentum beyond that seen for minute wave i. If price moves higher, then it should find very strong resistance at the blue trend line. If that line is breached, then a bear wave count should be discarded.
The blue channel is drawn in the same way on both wave counts. The upper edge will be critical. Here the blue channel is a base channel drawn about minor waves 1 and 2. A lower degree second wave correction should not breach a base channel drawn about a first and second wave one or more degrees higher. If this blue line is breached by one full daily candlestick above it and not touching it, then this wave count will substantially reduce in probability.
If subminuette wave ii continues any higher then it may not move beyond the start of subminuette wave i above 1,156.83.
Downwards movement from 1,170.19 will subdivide as a complete five wave impulse on the hourly chart, but on the daily chart it does not have a clear five wave look. Subminuette wave iii has disproportionate second and fourth waves within it giving this movement a three wave look on the daily chart.
Minuette wave (ii) will subdivide as a double zigzag, but it has a five wave look on the daily chart, not a three. Both the wave down labelled minuette wave (i) and the wave up labelled minuette wave (ii) have a better fit and look for the bull wave count than the bear at the daily chart level.
Gold has the most textbook looking structures and waves of all the markets I have analysed over the years, probably due to the high volume of this global market. And so I am quite concerned with the look of minuette waves (i) and (ii). Sometimes Gold has movements which don’t look perfect on the daily chart, but this is uncommon.
Sometimes Gold’s impulse waves start out slowly. There is a good example on this daily chart for minute wave i. When the fifth wave approaches that is when momentum sharply increases, and it often ends on a price shock with a volume spike. This is an even more common tendency for Gold’s third wave impulses. The strongest downwards movement is ahead, and it should be expected to arrive when subminuette wave v within minuette wave (iii) begins.
This bear wave count expects Gold is within a third wave at five wave degrees. Expect any surprises to be to the downside for this wave count.
Within minuette wave (iii), subminuette wave ii now shows up very clearly on the daily chart. This was expected, and will give minuette wave (iii) the right look. Minuette wave (iii) may only subdivide as an impulse.
Full and final confirmation of this wave count would come now with a new low below 1,098.85.
I will remove the final target for primary wave 5 at this stage. If it were to reach only equality with primary wave 1 , then this wave count would end about 985. But it has begun with three big overlapping first and second waves, so the target no longer looks low enough. I will calculate a target for primary wave 5 to end at intermediate degree when intermediate waves (3) and (4) are complete. Primary wave 5 may not exhibit a Fibonacci ratio at primary degree.
Click chart to enlarge.
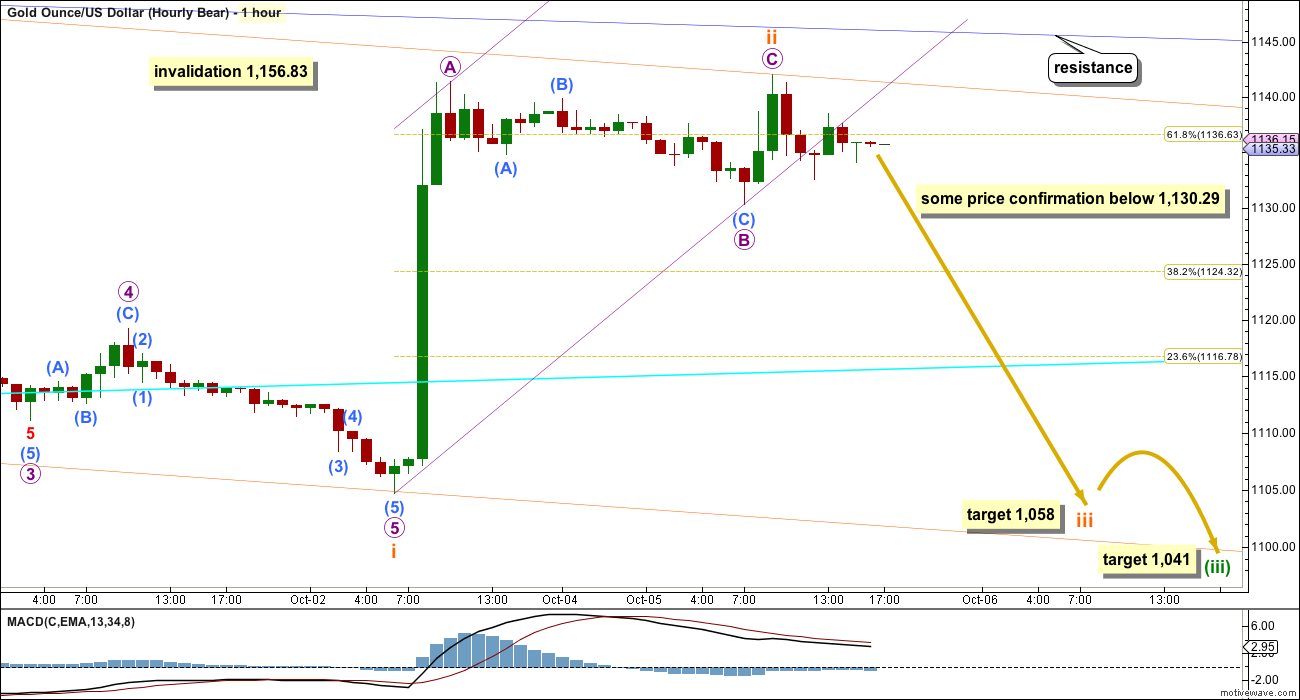
The upwards movement now labelled subminuette wave ii looks strongly like a three and not a five.
This hourly wave count is changed today to see subminuette wave i over at the low of 1,104.69. With the many subdivisions in this downwards wave, this is possible; however, it is impossible to determine with confidence if that move was a five wave impulse or a three wave zigzag as it will subdivide either way. So I must consider both possibilities.
Ratios within subminuette wave i are: there is no Fibonacci ratio between micro waves 3 and 1, and micro wave 5 is 1.37 short of equality with micro wave 1. Micro wave 3 is extended.
If subminuette wave ii continues any higher, it should find strong resistance about the upper blue trend line copied over here from the daily chart.
There is no Fibonacci ratio between micro waves A and C within subminuette wave ii.
A channel drawn about subminuette wave ii using Elliott’s technique is breached by sideways movement. I would prefer to see this breached by clearly downwards movement before having confidence that the correction is over, but this breach does provide first indication.
A new low below the start of micro wave C at 1,130.29 would provide early price confirmation that subminuette wave ii would likely be over.
At 1,058 subminuette wave iii would reach 1.618 the length of subminuette wave i.
The end of subminuette wave iii would be the next interruption to the downwards trend for this bear wave count. The fifth wave within subminuette wave iii may be very swift and sharp, maybe a price shock to the downside. This bear wave count expects downwards momentum to show a strong increase.
If subminuette wave ii moves any further (and it may as a double zigzag), then it may not move above the start of subminuette wave i above 1,156.83. However, this is a lower degree second wave within a third wave three degrees higher. It should not be too deep or long lasting. It would very likely be over now if this wave count is correct.
BULL ELLIOTT WAVE COUNT
Click chart to enlarge.
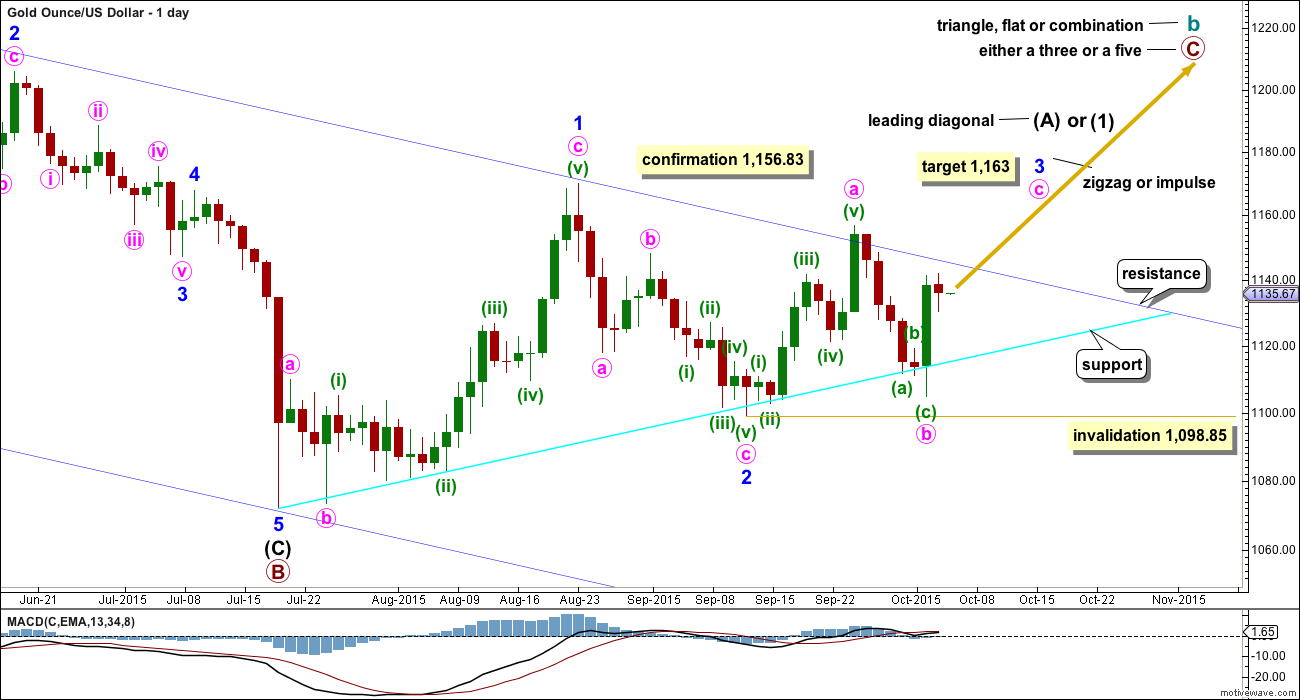
The bull wave count sees cycle wave a complete and cycle wave b underway as either an expanded flat, running triangle or combination. This daily chart works for all three ideas at the weekly chart level.
For all three ideas, a five up should unfold at the daily chart level for a movement at primary degree. This is so far incomplete. With the first wave up being a complete zigzag the only structure left now for intermediate wave (1) or (A) would be a leading diagonal. While leading diagonals are not rare they are not very common either. This reduces the probability of this bull wave count.
A leading diagonal requires the second and fourth waves to subdivide as zigzags. The first, third and fifth waves are most commonly zigzags, the but sometimes may appear to be impulses. So far minor wave 1 fits well as a zigzag.
To the upside, a new high above 1,156.83 would invalidate the bear wave count and provide strong confirmation for this bull wave count.
Upwards movement is finding resistance at the upper edge of the blue channel and may continue to do so. Use that trend line for resistance, and if it is breached, then expect a throwback to find support there.
Price has again come down to touch the bright aqua blue trend line and bounced up from here. If price continues any higher, then it should find very strong resistance at the upper dark blue trend line.
Minor wave 2 can now be seen as a complete zigzag. It is 0.73 the depth of minor wave 1, nicely within the normal range of between 0.66 to 0.81 for a second wave within a diagonal.
Third waves within leading diagonals are most commonly zigzags, but sometimes they may be impulses. Minor wave 3 should show some increase in upwards momentum beyond that seen for minor wave 1. Minor wave 3 must move above the end of minor wave 1 above 1,170.19. That would provide price confirmation of the bull wave count and invalidation of the bear.
There now looks like a five up on the daily chart within minor wave 3. This may be minute wave a within a zigzag, or it may also be minute wave i within an impulse. It is difficult at this stage to see how minute wave b could continue any lower; it is likely to be over now as labelled. I will leave the invalidation point at 1,098.85 to consider the unlikely possibility that it could continue. If it does, then it may not move beyond the start of minute wave a.
For this bull wave count, a third or C wave up should now be underway. At 1,163 minute wave c would reach equality in length with minute wave a.
Click chart to enlarge.
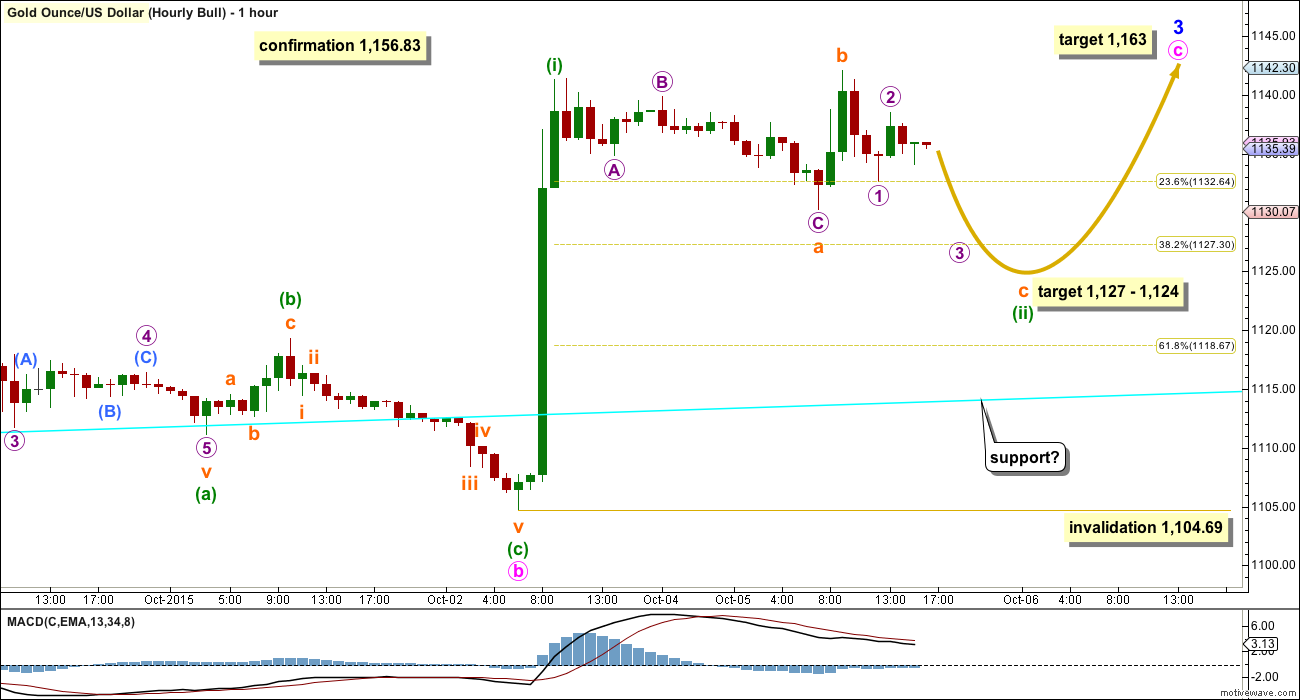
Today the bull wave count sees minute wave b complete as a sharp deep zigzag. It does not have a very clear three wave look at the daily chart level, but with this depth I am considering the possibility that it is over. There is no Fibonacci ratio between minuette waves (a) and (c).
The first wave of minuette wave (i) is most likely complete within minute wave c (or minute wave iii) upwards.
Minuette wave (ii) would very likely be incomplete because second wave corrections are more often deeper than this one is so far. It may be unfolding as a regular flat correction.
At 1,124 subminuette wave c would reach 1.618 the length of subminuette wave a. This is somewhat close to the 0.382 Fibonacci ratio of minuette wave (i) at 1,127.
Minuette wave (ii) may not move beyond the start of minuette wave (i) below 1,104.69. Along the way down, if price gets that low, it may again find some support about the bright aqua blue trend line copied over from the daily chart.
TECHNICAL ANALYSIS
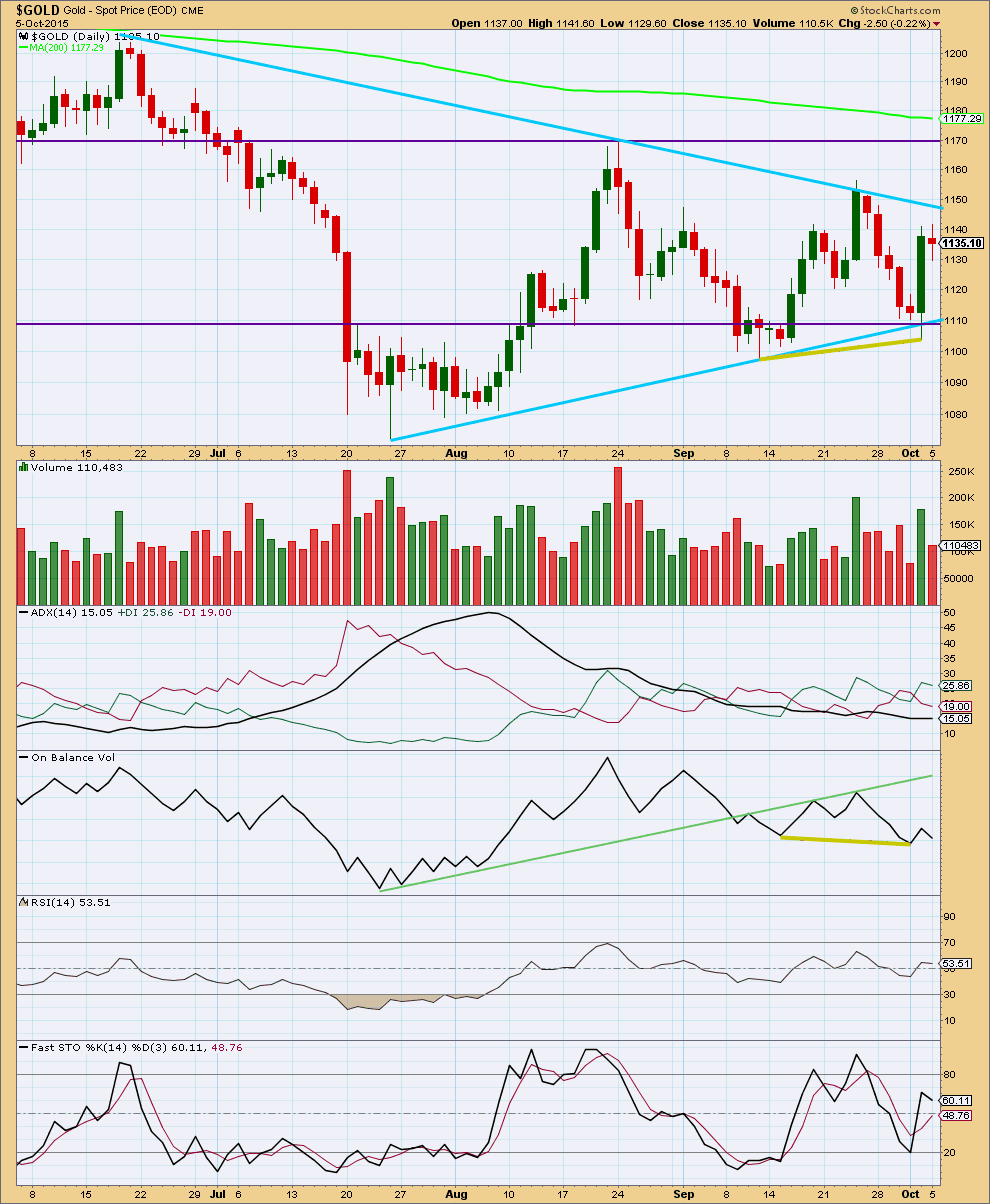
Click chart to enlarge. Chart courtesy of StockCharts.com.
Daily: Monday completed with a red candlestick with a small real body, almost but not quite a doji. This represents indecision, a balance between bulls and bears with the bears only slightly in charge. It looks corrective, and most of the session was taken up with sideways movement. Price remains range bound, below the upper sloping blue trend line providing resistance and the lower blue trend line providing support.
The black ADX line is pointing downwards which indicates there is no clear trend to the market yet. ADX does tend to be a lagging indicator. ADX has been indicating no clear trend for almost every day since 7th August; Gold has been range bound now for some time. During this time, it is still a downwards day which shows strongest volume which indicates that a downwards breakout would be more likely than upwards.
It would be expected that during this consolidation price should find support at one or both of the upwards sloping aqua blue line or the horizontal purple line. If price continues higher for Tuesday, then the next line of resistance is the downwards sloping blue line.
Overall, volume continues to decline as this consolidation continues. While price is being squashed between the sloping lines providing resistance and support the consolidation comes closer to maturity. The breakout is closer. I would expect the breakout may come this week now.
A range bound system is outlined here using lines on price for resistance and support in conjunction with Stochastics to indicate overbought / oversold. The downwards swing ended with Friday’s strong upwards move in price, but although price reached support Stochastics did not quite reach oversold. This is one illustration of why trading a range bound market is so risky. Here price should be expected to move higher until it finds resistance and at the same time Stochastics reaches overbought.
RSI at the daily chart level is neither overbought or oversold. There is room for the market to rise or fall.
There is some hidden bullish divergence between price and On Balanace Volume (olive green lines). While price made a higher low, OBV has made a lower low. This is a weak signal, but it does support a range bound approach (because it expects more upwards movement at this time).
Overall, at this stage, volume analysis indicates the bear wave count may be more likely than the bull.
This analysis is published about 06:56 p.m. EST.
Lara,
From October 2nd until today gold rallied up $46 and today it dropped down only $7 from today’s high. You mentioned the 3rd wave up should show itself in the next 24 hours.
Isn’t there going to be a larger correction further down?
Or will a deeper correction be at a later time if the bull wave continues?
I’m thinking of buying a small amount of DUST tonight since it has dropped 38% in 3 days. However that would only be if a deeper correction may now happen rather than later.
I’ve looked at the possibility that minuette (ii) could still be underway for the bull. The problem there is its B wave would be so long in relation to its A wave, almost twice the length of the A wave. The probability of that is just too low.
But then if I see this upwards move as the beginning of a third wave that doesn’t look right either. Momentum is too slow.
Actually, I’ll have this as an alternate, that minuette (ii) is continuing as an expanded flat.
Target for C to end lower is at 1,123.
The problem is B is 1.92 X A. Thats pretty long for a B wave within an expanded flat, but possible.
We had one earlier in the year that was 2x if I recall….not sure if it was part of the current count or a past alternate.
Lara you mentioned,
“The invalidation point for the bear is close. If that’s breached by any amount at any time frame the bear is invalid.”
The same 1,156.83 applies to both daily and hourly.
If invalidated would they just new new wave counts or would they both be fully invalidated and only left with the bull wave count?
1,156.83 is now the invalidation point for the bear.
To allow that to be breached and see the bear continuing would have to see minuette (ii) moving higher, and now that would necessitate a breach of the dark blue channel. That’s why I moved the invalidation point down for the bear on the daily chart.
USD very close to a breakout also
I’m becoming more and more convinced that there will be a big move up in gold in next day or so. Adding to everything that brings us to today, the manner in which i was stopped out (see the price bar at 2:04) is potentially a further ‘tell’. I’ve had this happen to me before many times. This doesn’t work 100% but more often than not it does. I”m more prepared this time if it does work out.
Eli, did you have a long or short position get stopped?
It was part of a long position.
The invalidation point for the bear is close. If that’s breached by any amount at any time frame the bear is invalid.
If a parallel copy of the upper blue trend line is created and put on the last high (labelled minuette (ii) on the bear daily chart) that is where price is right now finding resistance.
And so some downwards movement at least short term may unfold right now.
For the bull that was a remarkably shallow second wave correction! It should be over now and the bull in the early stages of a third wave up.
And so if the bull is correct that third wave should show itself in the next 24 hours. The third wave should have the power to break above that blue line (and a higher parallel copy).
I do so hope we get some clarity in the next 24 hours!
Did gold just finish a 5 wave count down to 1,145.64 at 1:16 from the top at 1151.30 at 11:06 am or is it going to finish the 5th wave down now?
it doesn’t look like it. It’s choppy and overlapping and could be a zig zag, but it may not be over yet.
On the five minute chart that downwards will subdivide nicely as a leading contracting diagonal.
BUT that certainly may only be wave A of a zigzag, and yet more highs to come.
And Eli’s right. It will also subdivide quite nicely as a zigzag.
That five down on such a small time frame is not enough to give confidence that we’re on the way down from here.
What could also happen is price drifts sideways again before the next push up.
We’re right at a critical stage for both wave counts. My advice would be to exercise patience for the next 24 to 48 hours. One or the other should show its hand.
I see a five also though maybe to small to count. Imo, for gdx, candlesticks bearish, volume bearish, rsi overbought, bollingers bearish.
Stopped out of JNUG.
Just take your receipt to the cashier for your winnings! LOL
Lol…$14/share in a few days, I’ll take it!
I entered a JDST trade at 28.32 but got stopped out by a penny!
very nice trade. I”m trying to figure out whether to take profits myself. I would have much preferred to cut through resistance but it’s either chipping away at it because it’s important resistance and may lead to a huge move, or get rejected as the bear is indeed still alive, although I’d say less likely now. Tough call
The Bulls had a great run and many 3X Bullish Gold ETF’s are overbought and due for a correction some went up 50% in 4 days. That sounds like a correction time.
There are safer bets overnight than now in a bullish position.
Numerous of DUST time frames are turning bullish and almost even the 195 minutes.
That’s just what they want us to think! Lol no you’re right. Just came within one penny of getting stopped out of half of my position. that may still happen yet, and if so, so be it. I will keep half overnight no matter what.
well i just got stopped out of half of it. Rather rudely I might add, which sometimes means it’s going right back up, but not necessarily.
Gold so strong so far today high of 1,150.28 at 10:43 am only $6.55 away from bear invalidation. Since Monday close, gold didn’t drop below 1,135 to head down towards 1,127- 1,124 target zone. And is above resistance area 1,145 strong upper blue trend line
At 10 am GDX was bullish all time frames 1 minute to 1 month.
Since then GDX did get weaker at some time frames but still only 1 cent below high 15.67.
Yes GDX even moved into a BUY at month time frame for October.
Last time BUY at monthly started December.
Glad I sold DUST Monday as it dropped $2 since then.
Oil is forecast moving up from 1 to 5 days, which on average is bullish for gold.
Yes I know they don’t always follow each other.
US oil has entered in wave c an impulse wave of extended flat correction.
Not quite. I have it as a C wave of a zigzag. For intermediate (2).
… hard to now see Gold price back below 1143-40 in a hurry~!….
Good call yesterday, Syed.
Hi Matt: Quite frankly this sucks… Someone stop this rally please lol… There is a monthly cycle pivot resistive zone 1152-53 before the 1155-56 high and the upper band at 1154-56 which could probably curtail the upside. Lara has already indicated an upside target of 1163. I am just wondering and looking out for signs of topping and reversal. Gold price is now likely to base off 1137 to take out 1151 for more…. Dang, not fair to the bears… //// Yeah it was my sentiment last week for Gold price to be bottomy and rally and Gold price made an upside reversal from 1104-03 on Friday. Again for this week it is my sentiment to see Gold price rally to 114x-115x… Gold price has just played out that way. I had nothing to do with it lol. Thanks anyway /// What is concerning: Gold price never really attempted to take out 1079-78 and moved up from 1080 to 1169, then Gold price did not get below 1098-97, moved up; and again moved up from 1104-03 (higher lows?). Now the key to downside is a take out of 1104?….Lets see how this plays out. Good luck.
Lara consider this potential idea. If minor four can end slightly below Minor one (1142.82) it will prevent an overlap and fit as a required impulse within black 3. This could potentially happen if minor wave four is a 9 wave triangle. (Can’t be a 5 wave triangle because E has already overlapped.). This would change your blue trend line. ( 1-3 and copy on 2) and this would contain the move without overlap. Also if you label it this way ( and if it works) the original primary target of 957 is more than attainable. Macd is also flattening.
Comments?
wave 4 may not move into wave 1 price territory.
Exactly!
“i” would end BELLOW blue wave one territory 1142.82
no doesn’t matter. doesn’t matter when it ends, can’t breach the territory at any point.
Blue wave 4 would end on October 27th if it is 1.618 the durantion of blue wave 2.
Your right I’m losing it…
Eli’s right. A fourth wave may not breach first wave price territory. Not just the end of it, any part of it may not breach.
Gold has crossed the blue resistance line at 1147. ????
Now is the moment of truth, with gold at the blue line.
I sold my DUST today that I bought Friday got fed up with it dropping.
Waited for Lara’s tonight analysis.
GDX was bearish 1 minute up to 195 minute, but bullish Daily, weekly and monthly and the longer term time frames have more strength.
DUST was the reverse bullish 1 minute up to 195 minute but bearish daily, weekly, monthly, which is not reassuring when looking to hold or buy DUST.
This chart by Mark seems to support your short term GDX bearish outlook. A pullback as shown in GDX should result in a 10-15% move up in DUST.
Dreamer I understand that if GDX dropped that DUST would go up a lot.
However the longer term bullish time frames in my indicators Friday and Monday are controlling the much shorter term indicators and may block GDX from dropping near term.
We will see Tuesday.
Chart Watcher: Gold, Miners ‘Tantalizingly Close’ To Bull Rally –
October 5, 2015, 2:05 P.M. ET
http://blogs.barrons.com/focusonfunds/2015/10/05/chart-watcher-gold-miners-tantalizingly-close-to-bull-rally/?mod=yahoobarrons&ru=yahoo
Thanks for the update Lara. I’ve still got my JNUG position from Friday, the portion I didn’t sell. There are a lot of miners breaking out, a lot of them….I could find a chart that wasn’t tonight. I’m not adding until we see gold making some confirming moves first.
Took profits on oil and short volatility today. I had about 5% on oil and almost 15% on short volatility. I’ll check out the other site for your stock market update for the next moves for SPX.
Great start to the week, and a good chunk of cash waiting in the wings for a decent set up.
Good luck trading everyone!
M
MTLSD you made another great trade holding JNUG.
You must have good intuition.
when silver broke out and GDX broke out, that’s when I decided to hold for longer. So many gold stocks are on the move. I am seeing many people trying to short this continued rise, I’ve done that myself in the past and there is always a culminating painful 2 to 5 days, and I don’t see bears throwing in the towel yet so I think gold has a spike coming that will drive miners up significantly for a few days that forces those who have been trying to short to finally get out of the way, bloodied.
I sense this may happen because I’ve experienced the impact of it from my own hope.
I bought back oil in pre market and scalped 2 trades for $800 this morning. Closed the oil position now with oil at $48.
Good luck trading! 70% cash for me right now.
Nicely done 🙂
I think Oil has a bit higher to go yet.
If it behaves as I expect; goes up, turns, goes down to break the lower blue trend line and then throws back to that line, it may be a perfect set up for a nice long term short position.
Oil has Ben whip sawing a lot lately so I was happy to exit the position with good profits. I will be looking for the opportunity to short the top of this correction as you suggest.