
Downwards movement was expected.
Price first moved higher but remained below the invalidation point for the bear Elliott wave count. Price then turned lower to complete a small red candlestick.
Summary: I expect downwards movement from here for the bear wave count for a strong third wave to 1,069. A new low first below 1,130.29 would provide a little confidence. A new low below 1,098.85 would provide full confidence. The bull wave count must move price higher in a third wave, and that would be confirmed above 1,156.83. Both wave counts will remain viable while price remains below 1,156.86 and above 1,098.85. Regular technical analysis still indicates a downwards breakout is more likely than upwards.
New updates to this analysis are in bold.
To see the bigger picture on weekly charts click here.
BEAR ELLIOTT WAVE COUNT
Click chart to enlarge.
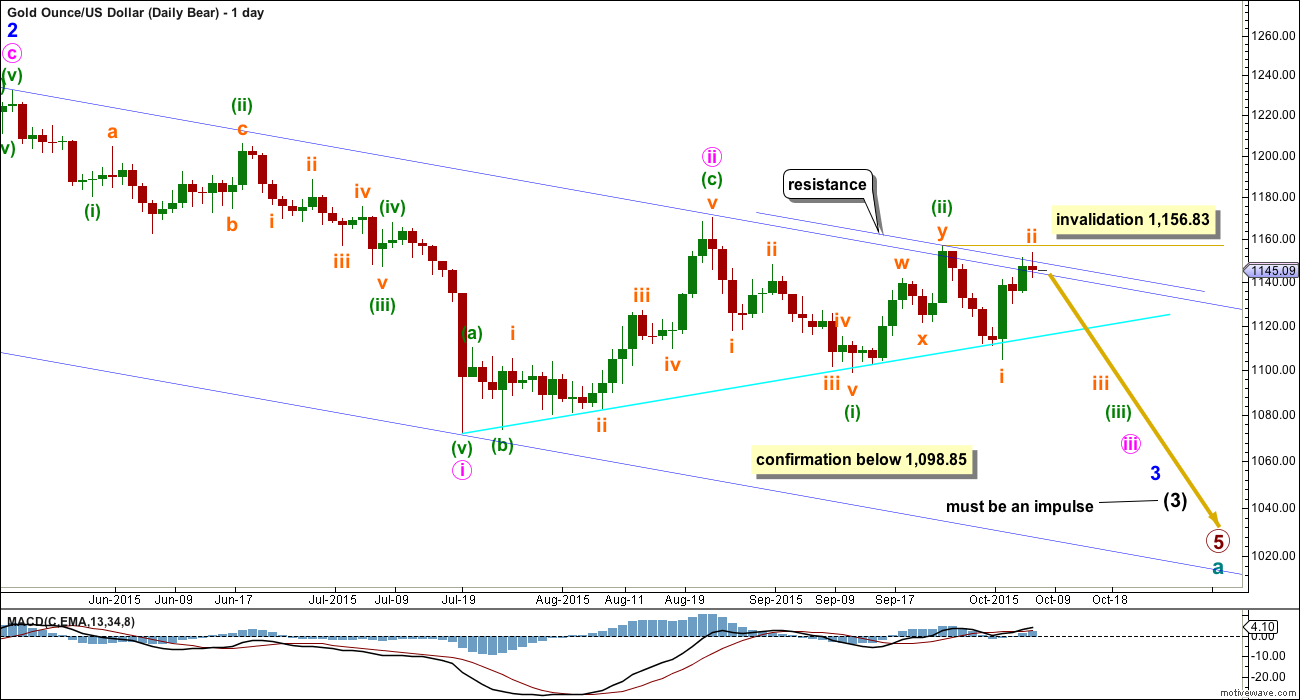
Gold has been in a bear market since September 2011. There has not yet been confirmation of a change from bear to bull, and so at this stage any bull wave count would be trying to pick a low which is not advised. Price remains below the 200 day moving average and below the blue trend line (just). The bear market should be expected to be intact until we have technical confirmation of a big trend change.
This wave count now sees a series of five overlapping first and second waves: intermediate waves (1) and (2), minor waves 1 and 2, minute waves i and ii, minuette waves (i) and (ii), and now subminuette waves i and ii. Minute wave iii should show a strong increase in downwards momentum beyond that seen for minute wave i. If price moves higher, then it should find very strong resistance at the blue trend line. If that line is breached, then a bear wave count should be discarded.
The blue channel is drawn in the same way on both wave counts. The upper edge will be critical. Here the blue channel is a base channel drawn about minor waves 1 and 2. A lower degree second wave correction should not breach a base channel drawn about a first and second wave one or more degrees higher. If this blue line is breached by one full daily candlestick above it and not touching it, then this wave count will substantially reduce in probability.
If subminuette wave ii continues any higher then it may not move beyond the start of subminuette wave i above 1,156.83.
Downwards movement from 1,170.19 will subdivide as a complete five wave impulse on the hourly chart, but on the daily chart it does not have a clear five wave look. Subminuette wave iii has disproportionate second and fourth waves within it giving this movement a three wave look on the daily chart.
Minuette wave (ii) will subdivide as a double zigzag, but it has a five wave look on the daily chart, not a three. Both the wave down labelled minuette wave (i) and the wave up labelled minuette wave (ii) have a better fit and look for the bull wave count than the bear at the daily chart level.
Gold has the most textbook looking structures and waves of all the markets I have analysed over the years, probably due to the high volume of this global market. And so I am quite concerned with the look of minuette waves (i) and (ii). Sometimes Gold has movements which don’t look perfect on the daily chart, but this is uncommon.
Sometimes Gold’s impulse waves start out slowly. There is a good example on this daily chart for minute wave i. When the fifth wave approaches that is when momentum sharply increases, and it often ends on a price shock with a volume spike. This is an even more common tendency for Gold’s third wave impulses. The strongest downwards movement is ahead, and it should be expected to arrive when subminuette wave v within minuette wave (iii) begins.
This bear wave count expects Gold is within a third wave at five wave degrees. Expect any surprises to be to the downside for this wave count.
Within minuette wave (iii), subminuette wave ii now shows up very clearly on the daily chart. This was expected, and will give minuette wave (iii) the right look. Minuette wave (iii) may only subdivide as an impulse.
Full and final confirmation of this wave count would come now with a new low below 1,098.85.
I will remove the final target for primary wave 5 at this stage. If it were to reach only equality with primary wave 1 , then this wave count would end about 985. But it has begun with three big overlapping first and second waves, so the target no longer looks low enough. I will calculate a target for primary wave 5 to end at intermediate degree when intermediate waves (3) and (4) are complete. Primary wave 5 may not exhibit a Fibonacci ratio at primary degree.
Click chart to enlarge.
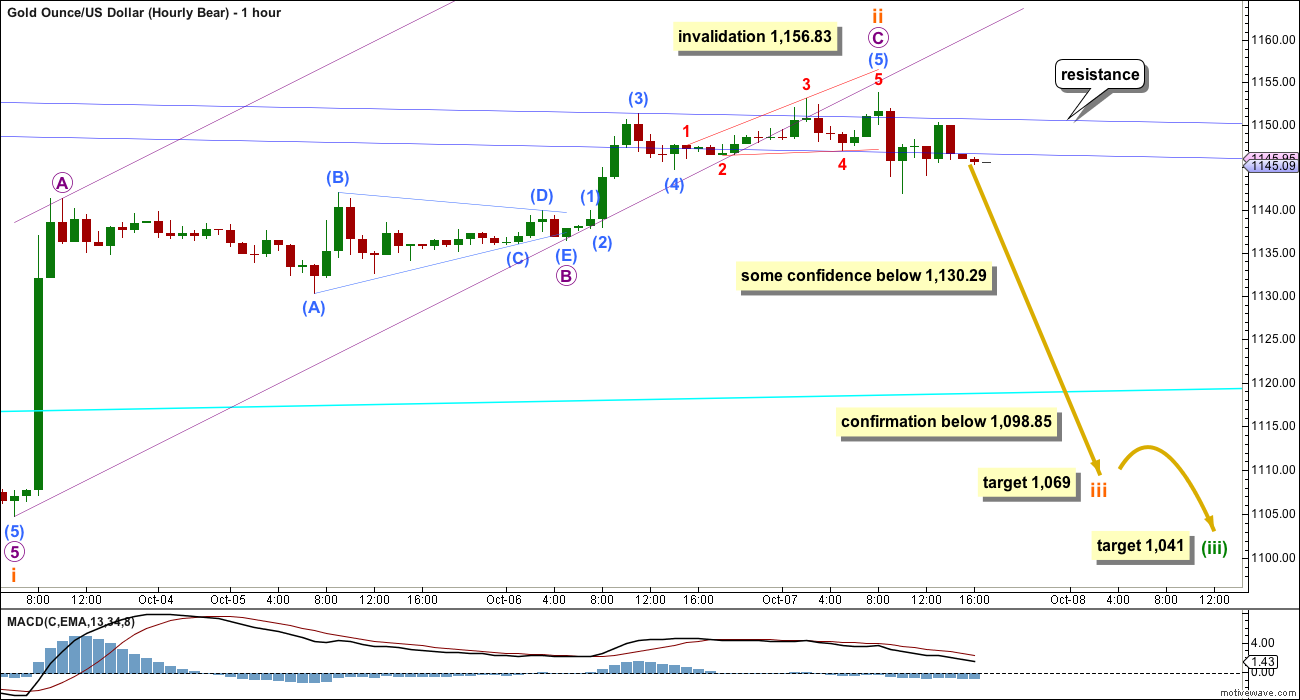
Subminuette wave ii did continue higher with micro wave C within it moving higher. There is still no Fibonacci ratio between micro waves A and C.
The maroon channel drawn about the zigzag of subminuette wave ii has been breached by clearly downwards movement. This may be earliest indication that subminuette wave ii is over and the next wave down is underway.
Now at 1,069 subminuette wave iii would reach 1.618 the length of subminuette wave i.
A new low below 1,130.29 would invalidate the bull wave count at the hourly chart level and provide a little confidence now in this bear wave count.
A new low below 1,098.85 would invalidate the bull wave count at the daily chart level and provide full confidence in this bear wave count.
The next interruption to the downwards trend for this bear wave count would come when subminuette wave iii is over and subminuette wave iv arrives.
During subminuette wave iii, the fifth wave for micro wave 5 may exhibit particularly swift strong downwards momentum, maybe a price shock to the downside.
At 1,041 minuette wave (iii) would reach 1.618 the length of minuette wave (i). This target would be still at least two weeks away.
BULL ELLIOTT WAVE COUNT
Click chart to enlarge.
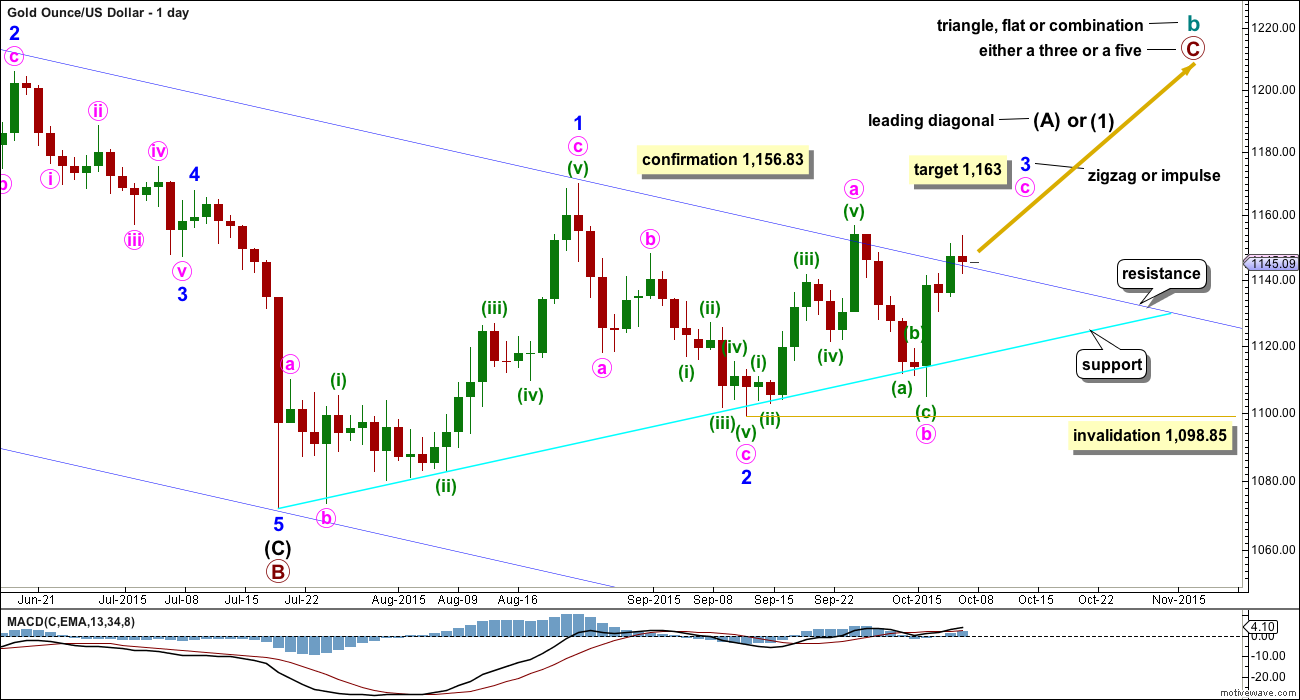
The bull wave count sees cycle wave a complete and cycle wave b underway as either an expanded flat, running triangle or combination. This daily chart works for all three ideas at the weekly chart level.
For all three ideas, a five up should unfold at the daily chart level for a movement at primary degree. This is so far incomplete. With the first wave up being a complete zigzag the only structure left now for intermediate wave (1) or (A) would be a leading diagonal. While leading diagonals are not rare they are not very common either. This reduces the probability of this bull wave count.
A leading diagonal requires the second and fourth waves to subdivide as zigzags. The first, third and fifth waves are most commonly zigzags, the but sometimes may appear to be impulses. So far minor wave 1 fits well as a zigzag.
To the upside, a new high above 1,156.83 would invalidate the bear wave count and provide strong confirmation for this bull wave count.
Upwards movement is finding resistance at the upper edge of the blue channel and may continue to do so. Use that trend line for resistance, and if it is breached, then expect a throwback to find support there.
Price has again come down to touch the bright aqua blue trend line and bounced up from here. If price continues any higher, then it should find very strong resistance at the upper dark blue trend line.
Minor wave 2 can now be seen as a complete zigzag. It is 0.73 the depth of minor wave 1, nicely within the normal range of between 0.66 to 0.81 for a second wave within a diagonal.
Third waves within leading diagonals are most commonly zigzags, but sometimes they may be impulses. Minor wave 3 should show some increase in upwards momentum beyond that seen for minor wave 1. Minor wave 3 must move above the end of minor wave 1 above 1,170.19.
Within minor wave 3, now at 1,163 minute wave c would reach equality in length with minute wave a. This would see minor wave 3 shorter than minor wave 1, so the leading diagonal would be contracting and that is the more common variety than expanding for a leading diagonal. This would be a reasonable expectation.
There now looks like a five up on the daily chart within minor wave 3. This may be minute wave a within a zigzag, or it may also be minute wave i within an impulse. It is difficult at this stage to see how minute wave b could continue any lower; it is likely to be over now as labelled. I will leave the invalidation point at 1,098.85 to consider the unlikely possibility that it could continue. If it does, then it may not move beyond the start of minute wave a.
Click chart to enlarge.
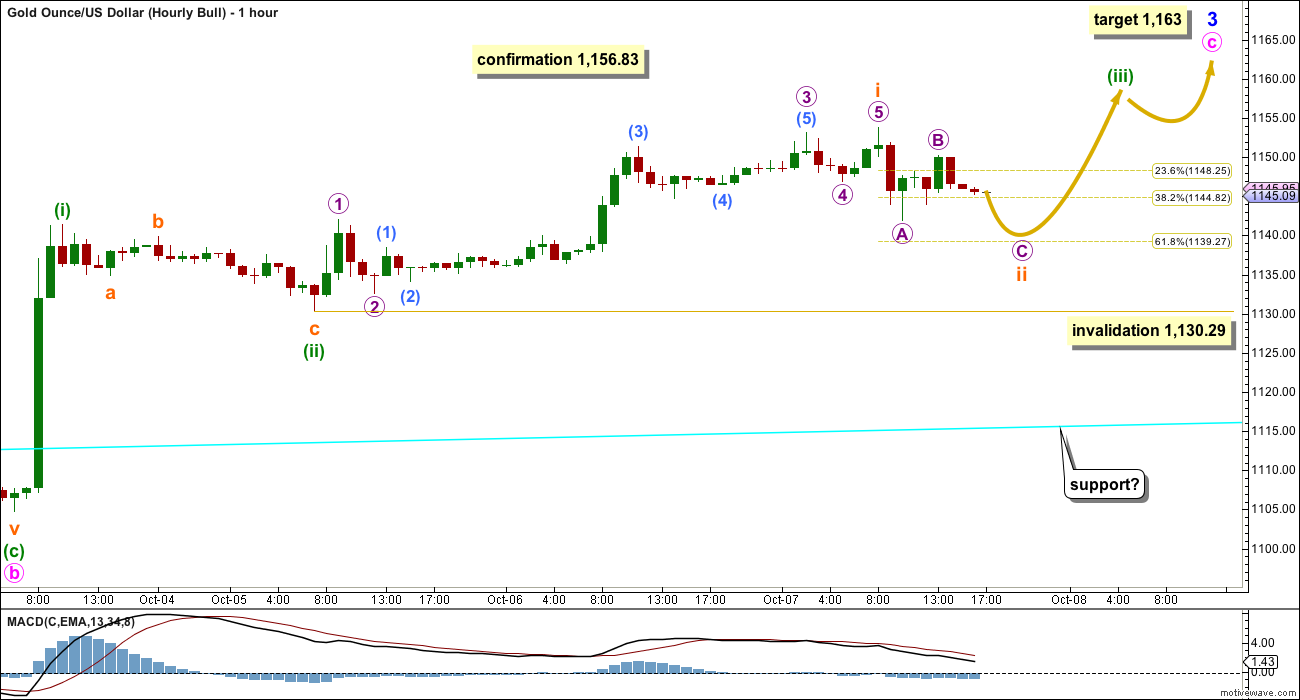
I have considered today the possibility that minuette wave (iii) was over at the high labelled subminuette wave i. This would see minuette wave (iii) shorter than minuette wave (i) and with weaker momentum. That idea would just fit, but it would have a very low probability.
What is more likely is that minuette wave (iii) is incomplete and showing its subdivisions clearly at the daily chart level. This is common for third waves for Gold.
Subminuette wave ii would be an incomplete zigzag. It may not move beyond the start of submineutte wave i below 1,130.29.
If this hourly chart is invalidated, then it may be possible that minuette wave (ii) is continuing further as a combination or expanded flat. This has a very low probability, but is just technically possible. The invalidation point for that unlikely idea would be at 1,104.69.
For confidence in this bull wave count, a new high above 1,156.83 is required; and, following that, a clear breach of the dark blue channel on the daily chart by one full daily candlestick above the line and not touching it is also required. Only then would I have reasonable confidence in this bull wave count.
TECHNICAL ANALYSIS
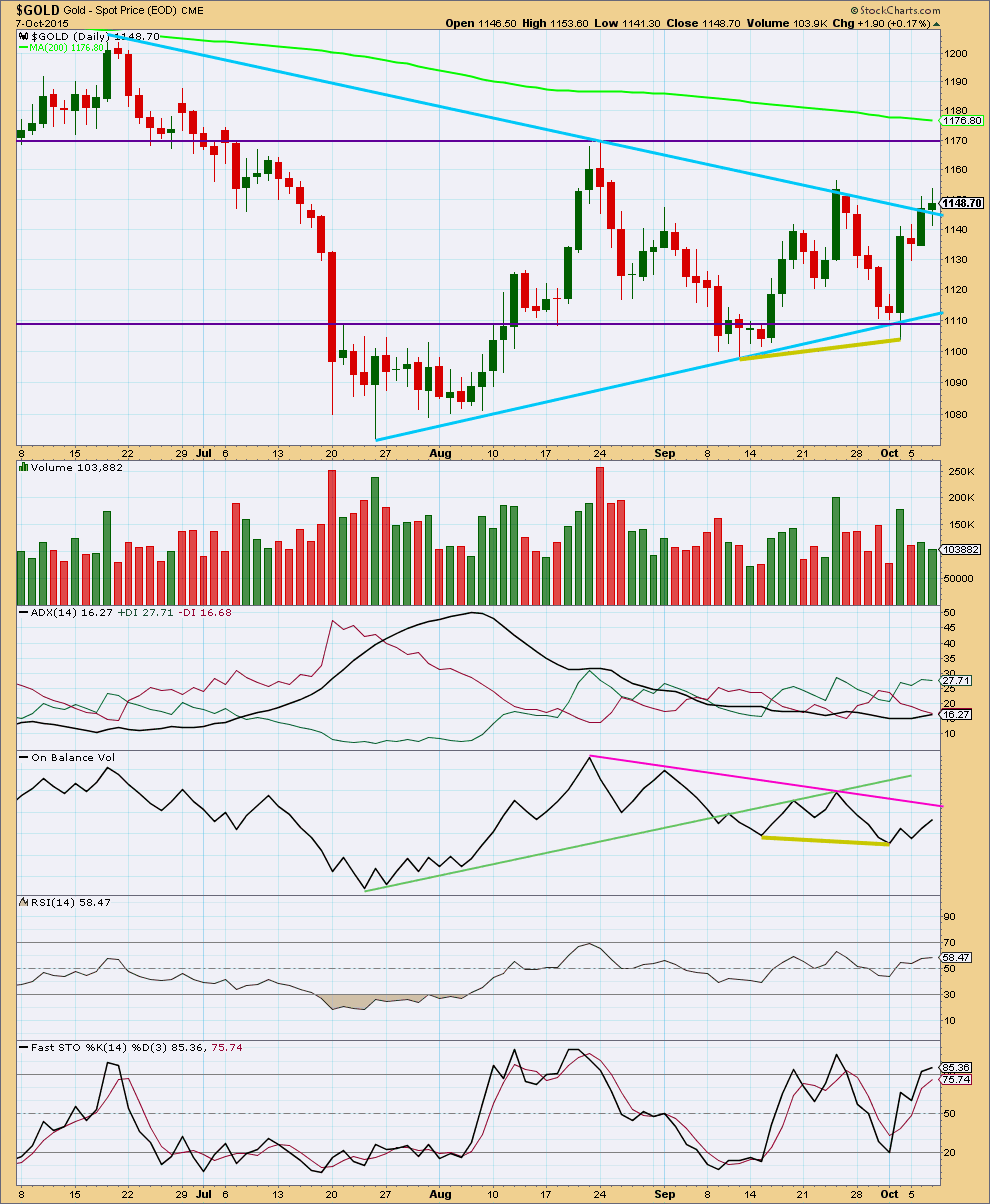
Click chart to enlarge. Chart courtesy of StockCharts.com.
Daily: Again, what is clear is the rise in price over the last four days comes on clearly declining volume. Price is not supported by volume, and so is suspicious.
Price remains within the horizontal lines delineating this consolidation. No breakout has yet been indicated. During this consolidation, it is still a downwards day which has strongest volume indicating a downwards breakout may be more likely than upwards.
This rise in price over four days may be enough to resolve the bullish divergence between price and On Balance Volume. If price continues higher from here, then OBV may assist in showing where upwards movement may end. If OBV comes up to touch the pink trend line, that may be when price stops rising.
The black ADX line is now pointing upwards. With it above 15, this may be an early indication of a new trend. For the signal to be stronger it should be above 20. If there is a new trend developing, then it would be upwards because the green +DX line is above the red -DX line. Although the early stages of a new trend is at this time indicated by ADX price and volume have not indicated a breakout from the consolidation pattern, and the bear Elliott wave count remains valid. This means that ADX should at this time be approached with caution. Any expectations at this point of further upwards movement would be premature, in my opinion.
Price has overshot the upper sloping blue trend line and Stochastics is overbought. Some downwards movement may develop from here.
RSI at the daily chart level is neither overbought or oversold. There is room for the market to rise or fall.
Overall, at this stage, volume analysis indicates the bear wave count may be more likely than the bull.
This analysis is published about 06:19 p.m. EST.
DUST is now a buy at 1, 3, 5, 15, 39, 78 and 195 minute and turning upwards for Daily however not a buy yet daily.
Gold may soon do some correcting since it just dropped $12 in 75 minutes..
I can see a five down (contracting diagonal) followed now by a complete three up (zigzag) which was deep.
Gold may now be moving into a third wave at micro degree (bear).
On the hourly chart I’ll move the invalidation point for the bull up to todays low at 1,136.74. A new low below that point now would favour the bear.
For the bear to have full confidence it still will need a new low below 1,098.85.
Most unfortunately both wave counts remain valid towards the end of this week… again! We still don’t have clarity.
I’ll make a comment on volume analysis when StockCharts have their data finalised. That unfortunately comes late. So what I think I’ll do is get the analysis published and then update it with volume analysis later on.
There is still one more trading day left this week. I would venture to say it may well be a down day.
I agree.
Gdx was green pretty big most of the day but didn’t gain momentum or volume until the day turned red.
that was pretty lame. About to exit and fight another day
It was disappointing.
Richard
Is buy signal negated for DUST??
Gold spikes up $6 and US dollar dropped with FOMC news
NUGT spikes up $3 and DUST drops $1
http://www.marketwatch.com/story/increase-of-downside-risks-led-fed-to-hold-off-rate-hike-in-september-2015-10-08
2:04p Dollar falls to 119.75 yen from 119.94 yen
2:04p S&P 500 surpases 2,000 for the first time since August
2:04p 10-year Treasury yield declines 1.2 basis point after minutes to 2.084%
U.S. stocks add to gains after Fed minutes
2:00p Increase of downside risks led Fed to hold off rate hike in September
At 11:24 am DUST was a sell at 78 minutes however not yet at 195 minutes.
Were u stopped out??
A little over an hour until gold chooses a direction, perhaps a false one at first…..
Good call
Thanks. It becomes kind of predictable after awhile. The herd moves on the news and the predators come in for the slaughter.
Sorry, didn’t mean to offend anyone who got whipsawed today.
Did gold just broke thru blue trend line on daily wave count???
Both bear and bull still alive, that’s for sure
While we wait for FOMC- Oscar has video on Gold and US oil.
Gold on hold and US oil watch out.
I am staying with EW count of course!!!
Enjoy
http://livewithoscar.com/Stocks/DailyVideo.aspx
“Mr. Wilson said precious metals, mining, and energy have “all been hit incredibly hard,” and he doesn’t see a turnaround soon as the fast growth in emerging markets that drove the commodity boom shows a lot of stress.”
http://www.theglobeandmail.com/globe-investor/funds-and-etfs/funds/sprott-asset-management-diversifying-away-from-gold-and-resources/article26644552/
Lara or others, wanted to get your thoughts on this “obvious” triangle. It may not be able to be an EW triangle because as a wave 4 it would overlap wave 1 and it can’t be the only structure in a wave 2. So my question is, is it still likely to “act” technically like a triangle? We could be at point “E” now, so would that increase the likelihood of a downwards breakout?
I’m also watching that pattern Dreamer. Don’t let Elliott wave put you off. Sometimes these play out and then Elliott wave catches up when its seen another pattern forming. Always trade your pattern before Elliott wave is my advice.
But please note the cup and handles pattern is still there also. But may be taking a bit too long to play out. So I’ve got a stop above Lara’s invalidation point because it’s so close and I’m playing the triangle. If that breaks I will play the cup and handle.
According to Rambus this will be a 6 point triangle and working towards the 7th point down to lower rail.
Thanks nice chart.
K2ashley is right.
It looks like a regular technical analysis triangle and certainly could work as one.
But it can’t be an EW triangle because of the overlap.
BUT… the EW picture sees it as a series of overlapping first and second waves, and when the third wave takes off (downwards) it would exit the triangle with force. So yes, it would behave the same way as an exit from a regular TA triangle.
Hello! What the target price of DUST may be?? Thanks
DUST got a ‘BUY’ at the 195 minute time frame Wednesday.
It has been quite accurate lately. Lets see how DUST moves Thursday.
FED FOMC minutes at 2:00 pm EST
Richard, who / what is source of BUY signal?
At 195 time frame on MACD indicator crossed over to BUY for DUST just after the Wed close.
DUST closed at 15.69, however Thursday morning DUST topped at 16.62 then dropped down to low of 15.28 at 12:05 pm now.
Lara, check stockcharts.. They updated their chart. Gold closed down … Red candle!
Yes, I see that. It fits with FXCM data now.
Its a bit more bearish. If volume had increased it would be more bearish.
If we get a red candlestick on increased volume for Thursday that would be more bearish still.
That bull wave count needs to show its hand now if thats a third wave. If it does not it will be in serious doubt.
The update makes OBV a weak argument for the Bulls.
Lara: Submint wave ii lasted 3 days assuming it is complete how long the target for submin wave iii in bear wave will take??
Maybe a Fibonacci 13 days. When third waves extend in price they also often extend in time.
it may start off a little slow… and only accelerate when it moves into its fifth wave. That would be just typical.
I’m holding my dust position from last evening and this morning, avg. $28.10. It’s a solid starting position, and I’ll stop out at today’s pre market low, right around $27.00 if it gets there.
Feels like we are at some confluence here in gold and in broader markets.
Lara, any comments on oil? It was hit hard today after peaking.
Good Luck Everyone.
M
Sorry. I am confused about DUST price. Dust closed at $15.70. Your position at $28.10 avg????? Which $ R U talking about????
He meant JDST as stated in yesterday’s comments.
HA…yes, JDST. Sorry about that.