
Downwards movement was expected for the bear Elliott wave count and this is what has happened.
So far both Elliott wave counts remain valid.
Summary: The short term target for a third wave for the bear is 1,106. This may be met next week. The short term target for the bull is 1,160 which should also be met next week. A third wave is unfolding either downwards (more likely) or upwards. Both wave counts will remain viable while price remains below 1,156.86 and above 1,098.85. Regular technical analysis still indicates a downwards breakout is more likely than upwards, and at this time it also indicates downwards movement is likely from here.
New updates to this analysis are in bold.
To see the bigger picture on weekly charts click here.
BEAR ELLIOTT WAVE COUNT
Click chart to enlarge.
Gold has been in a bear market since September 2011. There has not yet been confirmation of a change from bear to bull, and so at this stage any bull wave count would be trying to pick a low which is not advised. Price remains below the 200 day moving average and below the blue trend line (just). The bear market should be expected to be intact until we have technical confirmation of a big trend change.
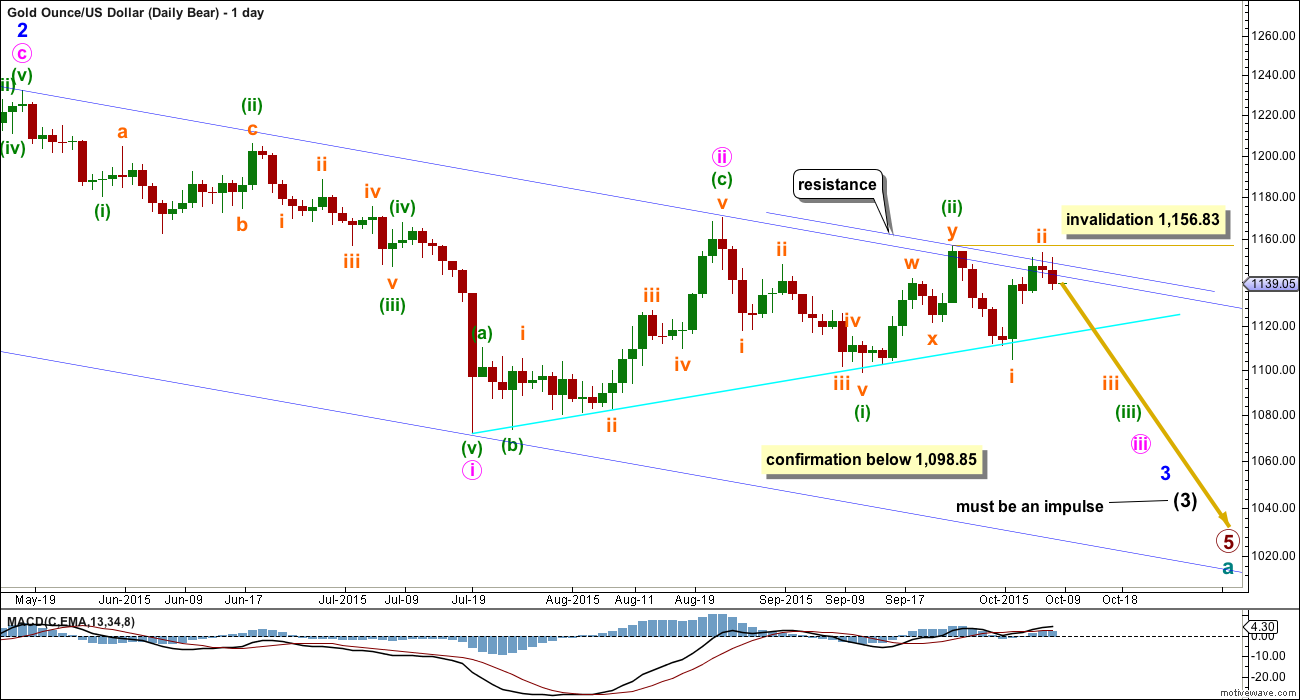
This wave count now sees a series of five overlapping first and second waves: intermediate waves (1) and (2), minor waves 1 and 2, minute waves i and ii, minuette waves (i) and (ii), and now subminuette waves i and ii. Minute wave iii should show a strong increase in downwards momentum beyond that seen for minute wave i. If price moves higher, then it should find very strong resistance at the blue trend line. If that line is breached, then a bear wave count should be discarded.
The blue channel is drawn in the same way on both wave counts. The upper edge will be critical. Here the blue channel is a base channel drawn about minor waves 1 and 2. A lower degree second wave correction should not breach a base channel drawn about a first and second wave one or more degrees higher. If this blue line is breached by one full daily candlestick above it and not touching it, then this wave count will substantially reduce in probability.
If subminuette wave ii continues any higher then it may not move beyond the start of subminuette wave i above 1,156.83.
Downwards movement from 1,170.19 will subdivide as a complete five wave impulse on the hourly chart, but on the daily chart it does not have a clear five wave look. Subminuette wave iii has disproportionate second and fourth waves within it giving this movement a three wave look on the daily chart.
Minuette wave (ii) will subdivide as a double zigzag, but it has a five wave look on the daily chart, not a three. Both the wave down labelled minuette wave (i) and the wave up labelled minuette wave (ii) have a better fit and look for the bull wave count than the bear at the daily chart level.
Gold has the most textbook looking structures and waves of all the markets I have analysed over the years, probably due to the high volume of this global market. And so I am quite concerned with the look of minuette waves (i) and (ii). Sometimes Gold has movements which don’t look perfect on the daily chart, but this is uncommon.
Sometimes Gold’s impulse waves start out slowly. There is a good example on this daily chart for minute wave i. When the fifth wave approaches that is when momentum sharply increases, and it often ends on a price shock with a volume spike. This is an even more common tendency for Gold’s third wave impulses. The strongest downwards movement is ahead, and it should be expected to arrive when subminuette wave v within minuette wave (iii) begins.
This bear wave count expects Gold is within a third wave at five wave degrees. Expect any surprises to be to the downside for this wave count.
Within minuette wave (iii), subminuette wave ii now shows up very clearly on the daily chart. This was expected, and will give minuette wave (iii) the right look. Minuette wave (iii) may only subdivide as an impulse.
Full and final confirmation of this wave count would come now with a new low below 1,098.85.
I will remove the final target for primary wave 5 at this stage. If it were to reach only equality with primary wave 1 , then this wave count would end about 985. But it has begun with three big overlapping first and second waves, so the target no longer looks low enough. I will calculate a target for primary wave 5 to end at intermediate degree when intermediate waves (3) and (4) are complete. Primary wave 5 may not exhibit a Fibonacci ratio at primary degree.
Click chart to enlarge.
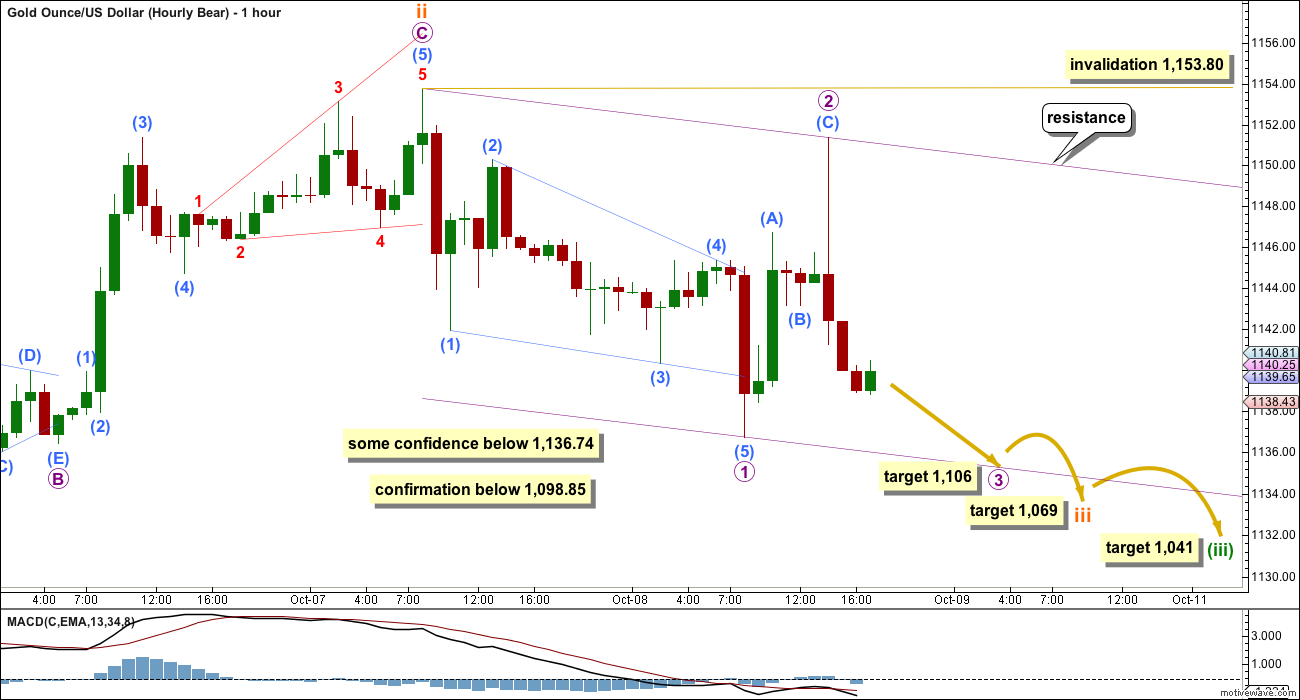
There is now a five down on the hourly chart followed by a three up. This fits the bear wave count better than the bull.
Micro wave 1 is a leading contracting diagonal. Micro wave 2 is a deep 0.86 zigzag. Second wave corrections following leading diagonals in first wave positions are normally very deep.
At 1,106 micro wave 3 would reach 2.618 the length of micro wave 1. If this target is wrong, then it may not be low enough. Micro wave 3 should show a strong increase in downwards momentum for this wave count.
Micro wave 4 should be over quickly. Micro wave 5 downwards may be a sharp price shock on a volume spike. That would be a typical end for a third wave in Gold.
At 1,069 subminuette wave iii would reach 1.618 the length of subminuette wave i. Again, if this target is wrong, then it may not be low enough.
The next interruption to the downwards trend for this bear wave count would come when subminuette wave iii is over and subminuette wave iv arrives.
At 1,041 minuette wave (iii) would reach 1.618 the length of minuette wave (i). This target would be still at least two weeks away.
A new low below 1,136.74 would add some confidence to this bear wave count. It would still require a new low below 1,098.85 to eliminate any bullish variation and provide full confidence.
BULL ELLIOTT WAVE COUNT
Click chart to enlarge.
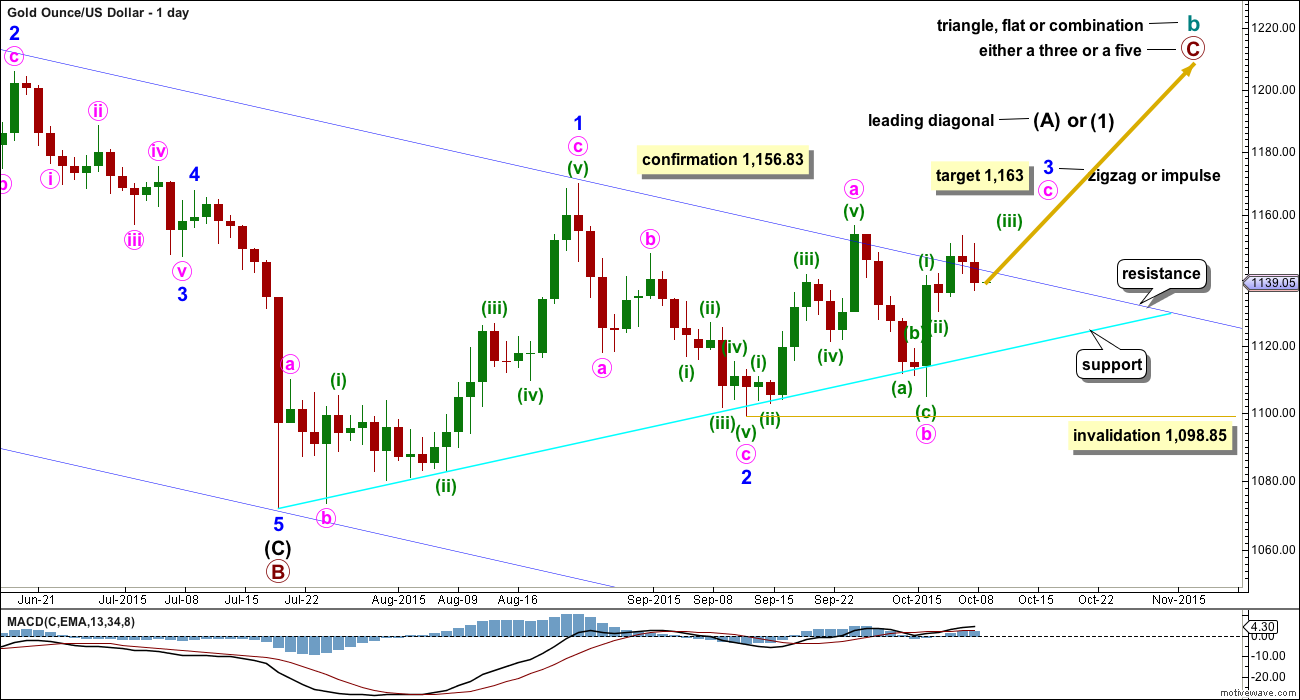
The bull wave count sees cycle wave a complete and cycle wave b underway as either an expanded flat, running triangle or combination. This daily chart works for all three ideas at the weekly chart level.
For all three ideas, a five up should unfold at the daily chart level for a movement at primary degree. This is so far incomplete. With the first wave up being a complete zigzag the only structure left now for intermediate wave (1) or (A) would be a leading diagonal. While leading diagonals are not rare they are not very common either. This reduces the probability of this bull wave count.
A leading diagonal requires the second and fourth waves to subdivide as zigzags. The first, third and fifth waves are most commonly zigzags, the but sometimes may appear to be impulses. So far minor wave 1 fits well as a zigzag.
To the upside, a new high above 1,156.83 would invalidate the bear wave count and provide strong confirmation for this bull wave count.
Upwards movement is finding resistance at the upper edge of the blue channel and may continue to do so. Use that trend line for resistance, and if it is breached, then expect a throwback to find support there.
Price has again come down to touch the bright aqua blue trend line and bounced up from here. If price continues any higher, then it should find very strong resistance at the upper dark blue trend line.
Minor wave 2 can now be seen as a complete zigzag. It is 0.73 the depth of minor wave 1, nicely within the normal range of between 0.66 to 0.81 for a second wave within a diagonal.
Third waves within leading diagonals are most commonly zigzags, but sometimes they may be impulses. Minor wave 3 should show some increase in upwards momentum beyond that seen for minor wave 1. Minor wave 3 must move above the end of minor wave 1 above 1,170.19.
Within minor wave 3, now at 1,163 minute wave c would reach equality in length with minute wave a. This would see minor wave 3 shorter than minor wave 1, so the leading diagonal would be contracting and that is the more common variety than expanding for a leading diagonal. This would be a reasonable expectation.
There now looks like a five up on the daily chart within minor wave 3. This may be minute wave a within a zigzag, or it may also be minute wave i within an impulse. It is difficult at this stage to see how minute wave b could continue any lower; it is likely to be over now as labelled. I will leave the invalidation point at 1,098.85 to consider the unlikely possibility that it could continue. If it does, then it may not move beyond the start of minute wave a.
Click chart to enlarge.
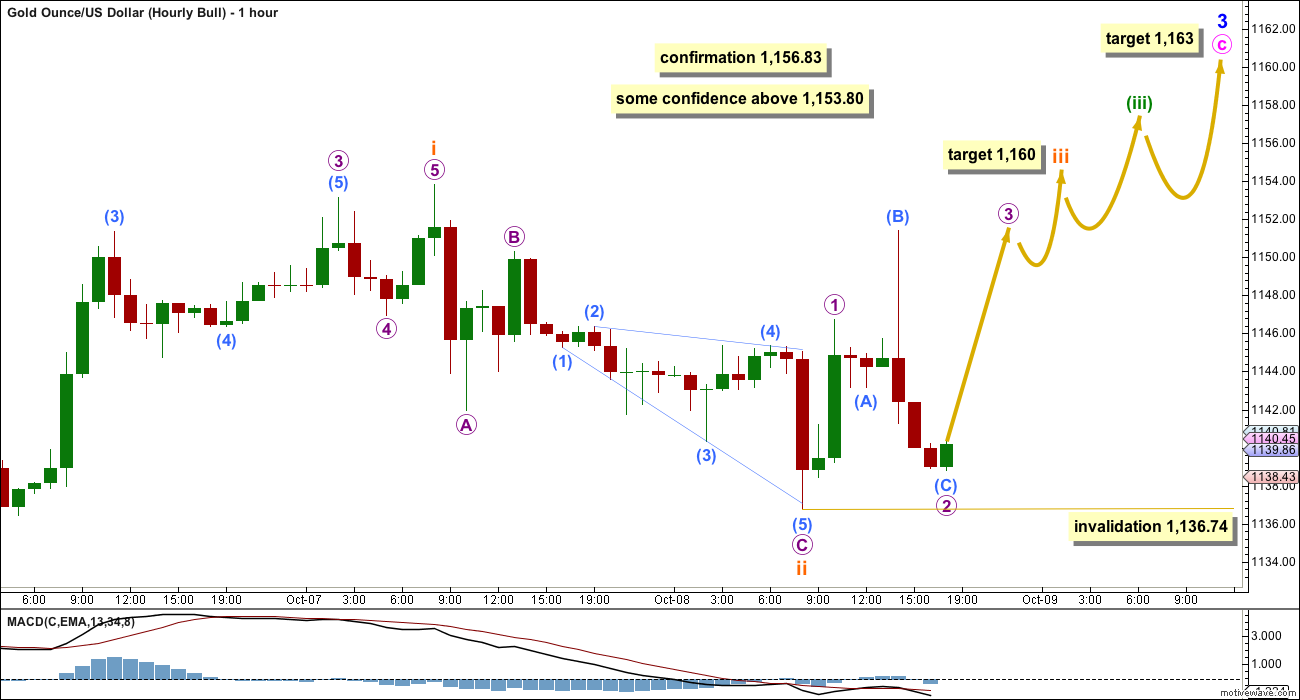
Subminuette wave ii is seen as a zigzag. Micro wave C is seen within it as an ending expanding diagonal. This does not have as good a fit as how this movement is seen for the bear wave count. Here the ending diagonal does not fit within its trend lines perfectly. Expanding diagonals are not as common as the contracting variety.
This bull wave count requires strong upwards movement. Minuette wave (iii) should show an increase in upwards momentum beyond that seen for minuette wave (i). But price is moving lower and momentum is declining. This does not look like a third wave up at this stage. It could redeem itself; a new high above 1,156.83 would provide confirmation.
At 1,160 subminuette wave iii would reach equality in length with subminuette wave i. When subminuette wave iii is over the next interruption to the upwards trend for this bull wave count would be expected for subminuette wave iv.
When subminuette wave iv is complete then a target may be calculated for subminuette wave v to end minuette wave (iii).
Minuette wave (iii) may only subdivide as an impulse. It is showing its subdivisions on the daily chart. However, the correction of subminuette wave ii is very deep and breaches a base channel which would be drawn about minuette waves (i) and (ii) (not shown). This reduces the probability of this bull wave count.
Micro wave 2 may not move beyond the start of micro wave 1 below 1,136.74. If this wave count is invalidated by downwards movement, then it may be a continuation of subminuette wave ii as a double zigzag. That would have a very low probability; it is only just technically possible. The invalidation point for that idea is at 1,130.29, the start of subminuette wave i.
A new high now above 1,153.80 would add some confidence to this wave count. It would still require a new high above 1,156.83 AND a clear breach of the upper edge of the dark blue channel on the daily chart by one full daily candlestick before full confidence could be had in it.
TECHNICAL ANALYSIS
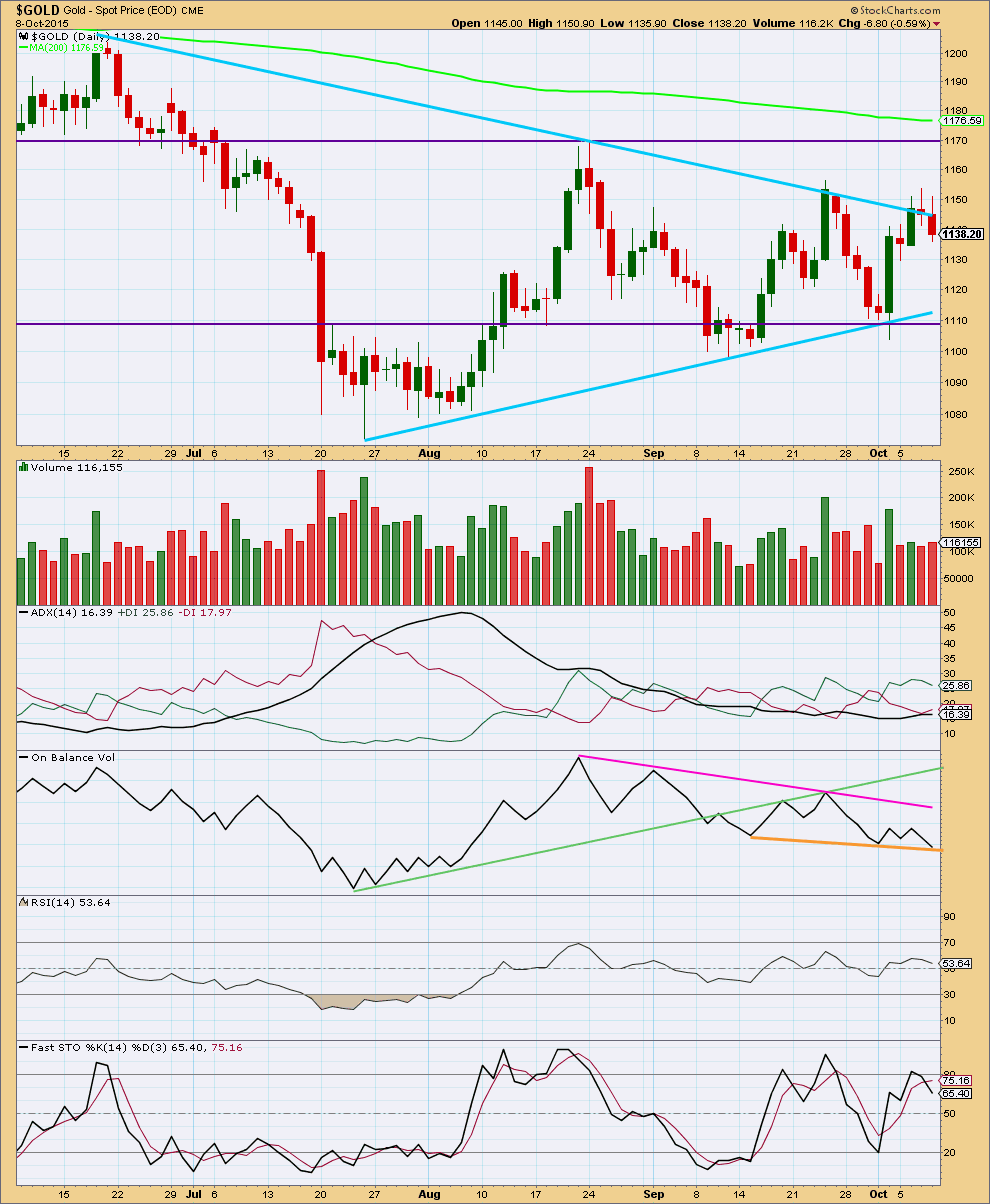
Click chart to enlarge. Chart courtesy of StockCharts.com.
Daily: Price is still within horizontal trend lines and sloping trend lines providing resistance and support. ADX is again flat indicating no clear trend. The market is still range bound. The breakout is closer as the sloping trend lines converge and this consolidation matures.
During this consolidation, which began about 7th August (when the black ADX line began to decline), it remains a downwards day which has strongest volume indicating a downwards breakout may be more likely than upwards.
A range bound trading system should be used as opposed to a trend following system. The system outlined here uses lines on price for support and resistance in conjunction with Stochastics to indicate oversold / overbought. The idea is simple. Expect price to swing between support and resistance. Expect one swing to end and the next to begin when price reaches support or resistance and Stochastics reaches oversold or overbought at the same time. At this time, price is returning from resistance and Stochastics is returning from overbought, so the downwards swing should be expected to continue.
Today’s small downwards day comes on some increase in volume. The fall in price has some support.
I added a new trend line to On Balance Volume. If OBV breaks below this orange line, then that would be further bearish indication. If OBV bounces up from this line, then the strength of the line would be reinforced and that would be bullish indication. OBV tends to work well with trend lines and not always so well with divergence, so I will just focus on using trend lines for it.
RSI indicates there is plenty of room for the market to rise or fall.
This analysis is published about 07:16 p.m. EST.
Any day-to-day strength above the $1,170+/- level (~+2.5% from where we are now) and gold will have breach its 4-year downtrend line. We think its going to happen and are buyers of gold here.
http://blogs.barrons.com/focusonfunds/2015/10/05/chart-watcher-gold-miners-tantalizingly-close-to-bull-rally/?mod=yahoobarrons&ru=yahoo
Lare mentioned below, “a new high above 1,170.19 would now provide a lot more confidence in the bull.”
Gold marks highest settlement since late August
Oct 9, 2015 2:23 p.m. ET
Metals gets a lift amid bets on further delays to U.S. rate hike
http://www.marketwatch.com/story/metals-rally-after-as-us-rate-hike-expectations-fade-2015-10-09
If minuette (ii) is continuing for the bear it may be as a double zigzag.
but today this has a pretty low probability due to the depth and the blue channel well overshot.
chart attached. this is the best scenario I can see now for the bear
as previously stated in the analysis above only when that channel is breached by a full daily candlestick above the upper line and not touching it would I discard the bear.
this scenario also means a new high above 1,170.19 would now provide a lot more confidence in the bull, and if we’re in a new bull market for Gold (at primary degree) then a good level of confidence would be nice to have.
Now I need to check subdivisions within the second zigzag for subminuette y.
Excellent update Lara!
I’m holding my Dust/JDST for now, this is about as tight against resistance as we can be – $14 from new primary bull or continuation of bear. If I’m wrong, like you said it will be nice to have the confidence that we are in the new bull.
Have a great weekend everyone!
Live life on the edge. Best wishes for profitable trading to you..
This upwards move shows an increase in momentum and I can see a possible middle of a third wave in there (no overlapping) . The bull wave count should be slightly favoured at this stage, but the bear is still just alive. Just.
I’ll be looking to see if this could be a continuation of minuette (ii) or minute ii for the bear. Its really hard to see though… for minute ii it can’t be a flat (b is <90% of a) and it doesn't fit as a double zigzag... maybe a triple? that's very rare though.
For minuette (ii) to be continuing may just possibly be a flat (b would be 89.9% of a, is that close enough to 90% for the rule to be met?) but the c wave looks odd... and would have a fair bit to go up to complete. it would have to be a five. a combination would be invalid because the first move up would be a multiple and you can't have multiples within multiples...
So that's my thinking on the bear so far. It has problems.
If I look at the upper trend line on the weekly chart as MTLSD (I think) noted then price has yet to come to touch it. But any channel drawn using Elliotts technique sees price above it right now.
This wave up on the daily chart does not look so far like a typical impulse. But that could most certainly resolve itself.
Both wave counts have problems in that neither has a perfect look, both have issues of structures that don't look typical or aren't behaving perfectly in regards to channels. But that's the nature of probability for ALL technical analysis. You can expect the market to behave as it most often does, but that is not how it always behaves. So you have to manage risk for the times it does something unusual. Which it will do.
Volume data for today will be really important.
Thanks for the update Lara. I can’t take credit for the weekly trend line call out (at least as far as I can remember).
Chart Watcher: Gold, Miners ‘Tantalizingly Close’ To Bull Rally
October 5, 2015, 2:05 P.M. ET
http://blogs.barrons.com/focusonfunds/2015/10/05/chart-watcher-gold-miners-tantalizingly-close-to-bull-rally/?mod=yahoobarrons&ru=yahoo
Lara: I know that you have enough to think about here, but could gold be moving above 1170 (but maybe stay below 1200) in the form of one big zigzag correction that started from the July low? I am thinking of a form similar to the correction from the March low to May high.
In the Sept 25th comments, I suggested that gold could possibly move as high as the long term trend line containing this entire multiyear bear market. You then drew that line into your weekly chart.
Thanks.
That would mean a breach of the channel which contains this bear market to date. Which is why I’m ruling it out.
Gold testing 1160 resistance line,
Good time! Tablet tranquility for bears. Maybe?
That’s what I was suggesting in my last post, except I think it would be a W-X-Y correction. If that’s the case, it needs to get back below the trend line by Monday
This is how I am leaning, I added some JDST at $26.
My original JNUG target earlier in the week was $20.25 or so, we fell about $0.20 short of that today. I should have been more patient with my JDST position but it’s down only about $1.10/share right now.
Today and tomorrow are turn dates also.
I severely wrote this wrong, what I meant was ..my original GDXJ target was $22.25…
“A new high now above 1,153.80 would add some confidence to this wave count. It would still require a new high above 1,156.83 AND a clear breach of the upper edge of the dark blue channel on the daily chart by one full daily candlestick before full confidence could be had in it.”
Trap or a breakout…markets are steps ahead of our minds…only technicals can say…waiting for lara’s update…
Something not right. I see this as one giant trap but nothing to back it up. It would also align with her oil count
Gold set another high at 1158.87 at 10:52 am.
A high above 1,156.86 and a full daily candlestick above the
upper blue trend line at about 1,150 would provide full confidence in the bull.
There is a chance that the wave counts will be adjusted today. I am not certain if they can stand as is.
Lara’s position is that she will not publish bear wave count any more.
Gold needs a full day above the upper blue trend line before that happens.
I shouldn’t be publishing a bear wave count….
But only once that blue channel is properly breached by a full daily candlestick above it and not touching it. So far its just overshot.
Matt at this point both the daily and hourly bear wave counts are invalidated above 1,156.83 but not fully as gold needs a full day above the upper blue trend line before bear counts are relegated to very low probability.
So another 2 bear wave counts are required.
Bull wave counts are both confirmed above 1,156.83 just not fully until a full day above upper blue trend line.
Perhaps before market close Lara may add some extra clarity for an opportunity to adjust positions. Some countries have Thanksgiving holiday Monday but NYSE is still open Monday.
Even if gold stays level at this higher price all day then miners would rise a lot with momentum. DUST just made a new low at $14.08 at 11:17 am.
We’ll see what Lara says. She should be able to clearly identify if this upward move is corrective or not.
I don’t think that we can just assume a bull market, simply because gold is going up.
Matt you are correct.
Just because above 1,156.83 doesn’t make it a bull.
I sold all of the little DUST I had at 9:59 am DUST looked too weak.
I have no mining ETFs.
Gold jumps $12 as U.S. rate hike expectations fade
Oct 9, 2015 6:21 a.m. ET
http://www.marketwatch.com/story/metals-rally-after-as-us-rate-hike-expectations-fade-2015-10-09
May be this scenario from past????
Look at GDXJ chart.
A 4th wave moved into 1st wave price territory on the bull hourly, didn’t it? Seems like more proof that something is wrong here. I smell smoke! 🙂
YES!!! New both hourly bull/bear wave counts are needed.
If gold has a 90% inverse relation with DXY which had an obvious downwards dirction for weeks , it renders a bear count for gold highly unlikely over the past few weeks!
Bottom line no instrument may behave in a vacuum.
Thank you
According to my indicators, TSI, MACD (3,10,16) and candlestick pattern DUST bottomed yesterday in daily and all intraday period. A huge doji or hammer in daily.
Miners signalling gold reversal here. But over night gold has gone up
One has to wait another 24 hour once the news of FOMC makes around the world. From Monday game may be different.
Gold may have just wiped out all the stop loss above critical shorts.
Some one wrote this???
Amazing how a little short squeeze price action gets the juices flowing and gets one dreaming of the riches again. I just see this launch in the GDX and the market also as simply the mechanical action of the shorts getting into position to profit from a logical down draft and then someone yells fire in the theater and sparks a short squeeze. Once the squeeze is on the upside panic changes the psychology to that of the bottom is in then it feeds on itself to the upside. And now we witness a cottage industry develop overnight of bottom callers and the race is now back on!
That’s not what I see in the price action however.
If this is a bull, it certainly is a lazy one.
IMHO the best thing to do is to keep your powder dry (i.e. make sure that you have the funds available to short soon).
So can the Bear count survive if we make only a nominal new high above the invalidation point of 1,156.83 and then head down?
Maybe Minuette 2 (green) continues as a 3-3-3 combination and we have not even started Subminuette 2 yet.
Thoughts?
If this is a 3rd wave for the bull, it is acting very strangely. It should be thrusting upward and easily slicing right through all resistance. I remain skeptical here and believe this still looks corrective. I’ll keep looking.
When viewed on the daily chart, it looks like yesterday’s price action overlapped into what would be first wave price territory. So that is off already and hints that this may be a corrective wave.
I think it’s very bearish if gold declines before moving above 1156. At this point the risk/reward here is very tempting to trade.
I believe that gold can move higher than 1156 and remain a correction within some alternate bear count.
For example, an E wave of a triangle will typically undershoot or overshoot (as is the case here) its A-C trendline.
I agree, the triangle might be the operative count.
1170 is now the number to watch. If gold stays below, there may be something to this.
Alan
Do your think bear submint wave ii is not complete and is now an expanded flat wave c is just finishing to avoid truncation??????.
What happens if gold falls below the confidence level 1153.88???
That’s what I thought.
And if it rises any further, the bear is in jeopardy.
The current price situation fits the bull very well. Micro 3 is very very slightly above 1.618 of micro 1.
Does sub wave a, b and wave c meets the criteria of 5,3,5 to be expanded flat?
I can not count waves???
The hourly bear chart has been invalidated with a rise to as high as 1154.81. That could be subminuette 2. We are getting close to the bear invalidation.
Lara wrote on Bull chart: some confidence at 1153.88. Gold has breached the price.
That was in the past @ subminuette 1. Now we are in subminuette 3.
Gold is once again pushing up against the upper trend line and has made a new high above yesterday’s high. As I write this the high is just below 1,155 and is getting close to the Bear invalidation of 1,156.83. If that invalidation point holds, this will likely be a continuation of Subminuette wave 2. Last call for the Bears to show themselves!
I think this rally will lead to a break out now..
Crossed confidance level…will wait for lara s signal now
Micro 2 high of 1,151.38 at 2:17 pm Wednesday stayed intact by just 2 cents.
The 2nd wave of Micro 3 just hit a high of 1,151.36 at 3:45 am.
Thankfully, now gold can drop down towards micro wave 3 bottom at 1,106 or lower next week.
Interesting daily trend line resistance gold hit all 4 days this week. Now it drops down.
Check http://www.pmbull.com at the daily time frame and see the down slopped trend line established with the 2 highs of May 18th and September 24th then gold dropped below the trend line until it back came up and hit resistance at it for all 4 days this week.
Looks like gold ran out of gas and there are many indications that it’s dropping.
Added to Dust and JDST positions today.
Good luck everyone!
I also rebought DUST today before close.
I think the bulls have weakened today.