
Upwards movement invalidated the bear Elliott wave count and confirmed the bull. With some adjustment, the bear Elliott wave count is still valid and will only be discarded when the channel containing this bear market is breached. The bear wave count will remain possible while price remains within that channel, but today it has a greatly reduced probability.
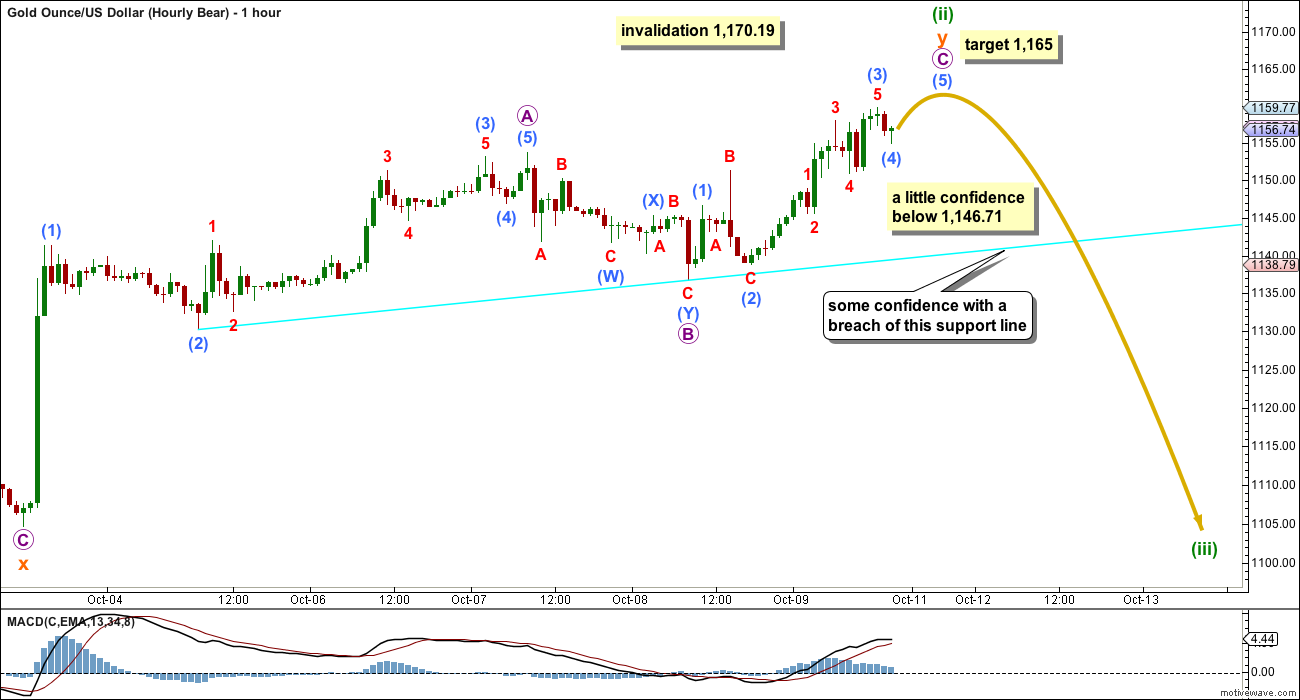
Summary: The channel is overshot but not yet properly breached. I would judge the bull and bear wave counts at week end to be about even in probability. Price will tell us which one is correct next week. A new high above 1,170.19 would provide more confidence in a bull market. In the short term, both wave counts expect Monday to begin with a little more upwards movement to complete a small impulse with a target at 1,165. What happens after that will be crucial. Look for downwards movement to find some support at the aqua blue trend line on the hourly charts.
New updates to this analysis are in bold.
To see the bigger picture on weekly charts click here.
BEAR ELLIOTT WAVE COUNT
Click chart to enlarge.
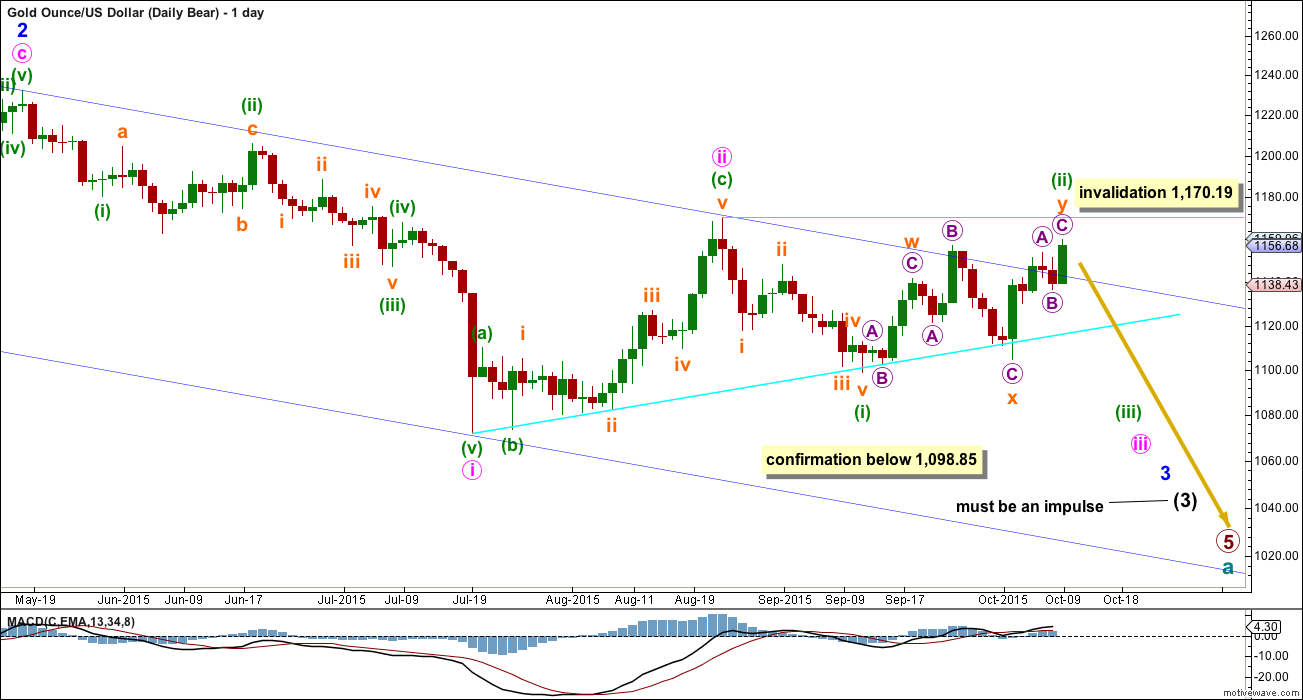
Gold has been in a bear market since September 2011. There has still not yet been confirmation of a change from bear to bull, and so at this stage any bull wave count would be trying to pick a low which is not advised. Price remains below the 200 day moving average and has now overshot the blue trend channel. The bear market should be expected to be intact until we have technical confirmation of a big trend change.
This wave count now sees a series of four overlapping first and second waves: intermediate waves (1) and (2), minor waves 1 and 2, minute waves i and ii, and minuette waves (i) and (ii). Minute wave iii should show a strong increase in downwards momentum beyond that seen for minute wave i. If price moves higher, then it should find very strong resistance at the blue trend line. If that line is breached, then a bear wave count should be discarded.
The blue channel is drawn in the same way on both wave counts. The upper edge will be critical. Here the blue channel is a base channel drawn about minor waves 1 and 2. A lower degree second wave correction should not breach a base channel drawn about a first and second wave one or more degrees higher. If this blue line is breached by one full daily candlestick above it and not touching it, then this wave count will substantially reduce in probability. A breach of this trend line would also mean a breach of the larger channel on the weekly bear chart, so at that stage a bear wave count should be discarded.
If minuette wave (ii) continues any higher then it may not move beyond the start of minuette wave (i) above 1,170.19.
Downwards movement from 1,170.19 will subdivide as a complete five wave impulse on the hourly chart, but on the daily chart it does not have a clear five wave look. Subminuette wave iii has disproportionate second and fourth waves within it giving this movement a three wave look on the daily chart.
Minuette wave (ii) is changed to a double zigzag, with subminuette wave x an expanded flat correction. The subdivisions fit perfectly at the hourly chart level. However, this is a very deep second wave correction and it would be reasonable to expect the strong downwards pull from the middle of a big third wave to force this second wave correction to be more shallow and brief than this. The probability of this wave count is reduced.
Gold has the most textbook looking structures and waves of all the markets I have analysed over the years, probably due to the high volume of this global market. And so I am quite concerned with the look of minuette wave (i). Sometimes Gold has movements which don’t look perfect on the daily chart, but this is uncommon.
Sometimes Gold’s impulse waves start out slowly. There is a good example on this daily chart for minute wave i. When the fifth wave approaches that is when momentum sharply increases, and it often ends on a price shock with a volume spike. This is an even more common tendency for Gold’s third wave impulses. The strongest downwards movement is ahead, and it should be expected to arrive when subminuette wave v within minuette wave (iii) begins.
This bear wave count expects Gold is within a third wave at five wave degrees. Expect any surprises to be to the downside for this wave count.
Within minuette wave (iii), subminuette wave ii now shows up very clearly on the daily chart. This was expected, and will give minuette wave (iii) the right look. Minuette wave (iii) may only subdivide as an impulse.
Full and final confirmation of this wave count would come now with a new low below 1,098.85.
I will remove the final target for primary wave 5 at this stage. If it were to reach only equality with primary wave 1 , then this wave count would end about 985. But it has begun with three big overlapping first and second waves, so the target no longer looks low enough. I will calculate a target for primary wave 5 to end at intermediate degree when intermediate waves (3) and (4) are complete. Primary wave 5 may not exhibit a Fibonacci ratio at primary degree.
Click chart to enlarge.
This upwards movement will fit neatly as a zigzag. This resolves the problem that the bull wave count has with a lack of momentum for a third wave.
At 1,165 submicro wave (5) would reach equality in length with submicro wave (1).
The lower aqua blue trend line is a conservative line providing support. A clear breach of that line would add a little confidence to this wave count.
A new low below 1,146.71 would invalidate the bull wave count at the hourly chart level. That would also add a little confidence to this wave count.
If this bear wave count is correct, then a big third wave down should be beginning. A clear break below the lower bright aqua blue trend line on the daily chart would initially be required for reasonable confidence in this idea. Thereafter, a new low below 1,098.85 would provide full confidence.
A new high above 1,170.19 would invalidate this wave count. It would only be discarded though with a full breach of the upper edge of the dark blue channel on the daily chart.
BULL ELLIOTT WAVE COUNT
Click chart to enlarge.
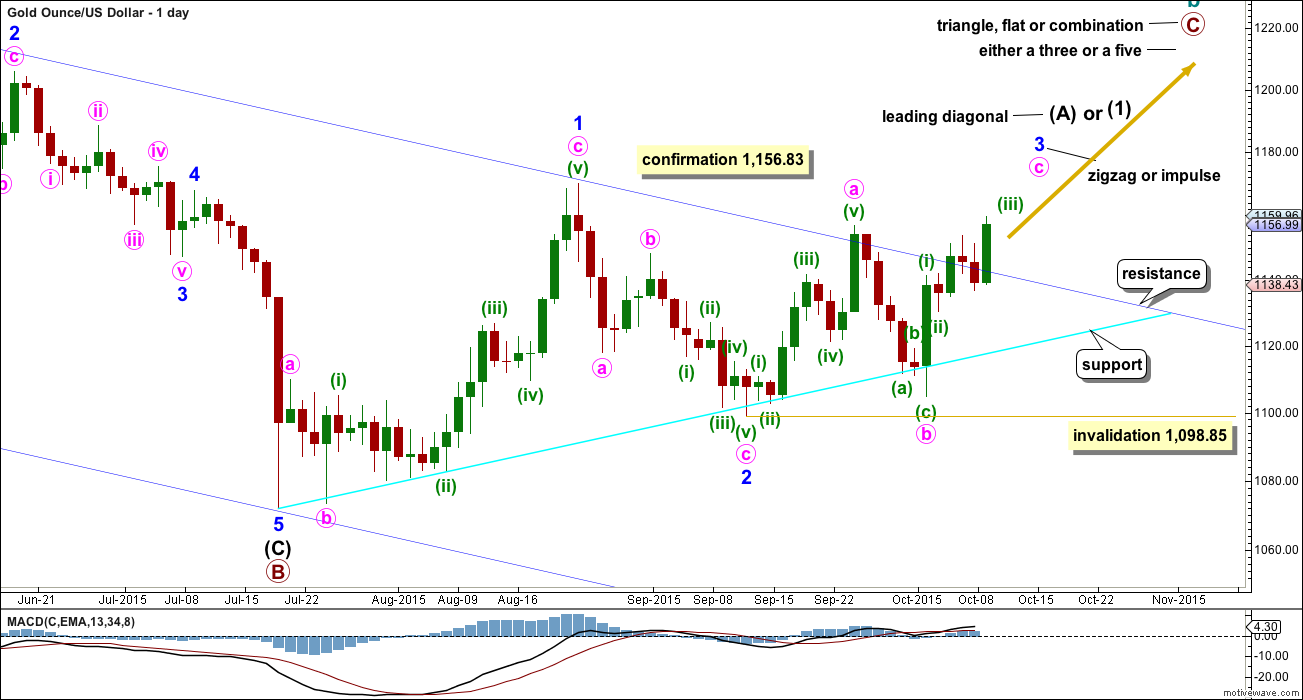
The bull wave count sees cycle wave a complete and cycle wave b underway as either an expanded flat, running triangle or combination. This daily chart works for all three ideas at the weekly chart level.
For all three ideas, a five up should unfold at the daily chart level for a movement at primary degree. This is so far incomplete. With the first wave up being a complete zigzag the only structure left now for intermediate wave (1) or (A) would be a leading diagonal. While leading diagonals are not rare they are not very common either. This reduces the probability of this bull wave count.
A leading diagonal requires the second and fourth waves to subdivide as zigzags. The first, third and fifth waves are most commonly zigzags, the but sometimes may appear to be impulses. So far minor wave 1 fits well as a zigzag.
To the upside, a new high above 1,156.83 would invalidate the bear wave count and provide strong confirmation for this bull wave count.
Now that the upper blue trend line has been overshot any downwards movement early next week may find support there for a throw back. When price behaves like that it offers a low risk opportunity to join a trend.
Minor wave 2 can now be seen as a complete zigzag. It is 0.73 the depth of minor wave 1, nicely within the normal range of between 0.66 to 0.81 for a second wave within a diagonal.
Third waves within leading diagonals are most commonly zigzags, but sometimes they may be impulses. Minor wave 3 should show some increase in upwards momentum beyond that seen for minor wave 1. Minor wave 3 must move above the end of minor wave 1 above 1,170.19. (The previous target for minor wave 3 at 1,163 was inadequate).
There now looks like a five up on the daily chart within minor wave 3. This may be minute wave a within a zigzag, or it may also be minute wave i within an impulse. It is difficult at this stage to see how minute wave b could continue any lower; it is likely to be over now as labelled. I will leave the invalidation point at 1,098.85 to consider the unlikely possibility that it could continue. If it does, then it may not move beyond the start of minute wave a.

Click chart to enlarge.
Within the impulse of minute wave c, subminuette wave (iii) should show an increase in upwards momentum beyond that seen for minuette wave (i). It is showing some increase but not enough yet. This wave count expects to see a further increase in upwards momentum early next week.
At 1,165 micro wave 5 would reach equality in length with micro wave 1. If this target is wrong, it may be too low. Micro wave 5 may show a sharp strong increase in upwards momentum, a typical fifth wave for a commodity.
On Monday, when markets open, micro wave 4 may not move into micro wave 1 price territory below 1,146.71.
When subminuette wave iii is complete the following correction for subminuette wave iv may not move into submineutte wave i price territory below 1,153.80.
The bright aqua blue channel is a best fit. If the upper edge is breached (as it should be for a strong third wave up), then it may provide support.
Minor wave 3 must move beyond the end of minor wave 1 above 1,170.19.
TECHNICAL ANALYSIS
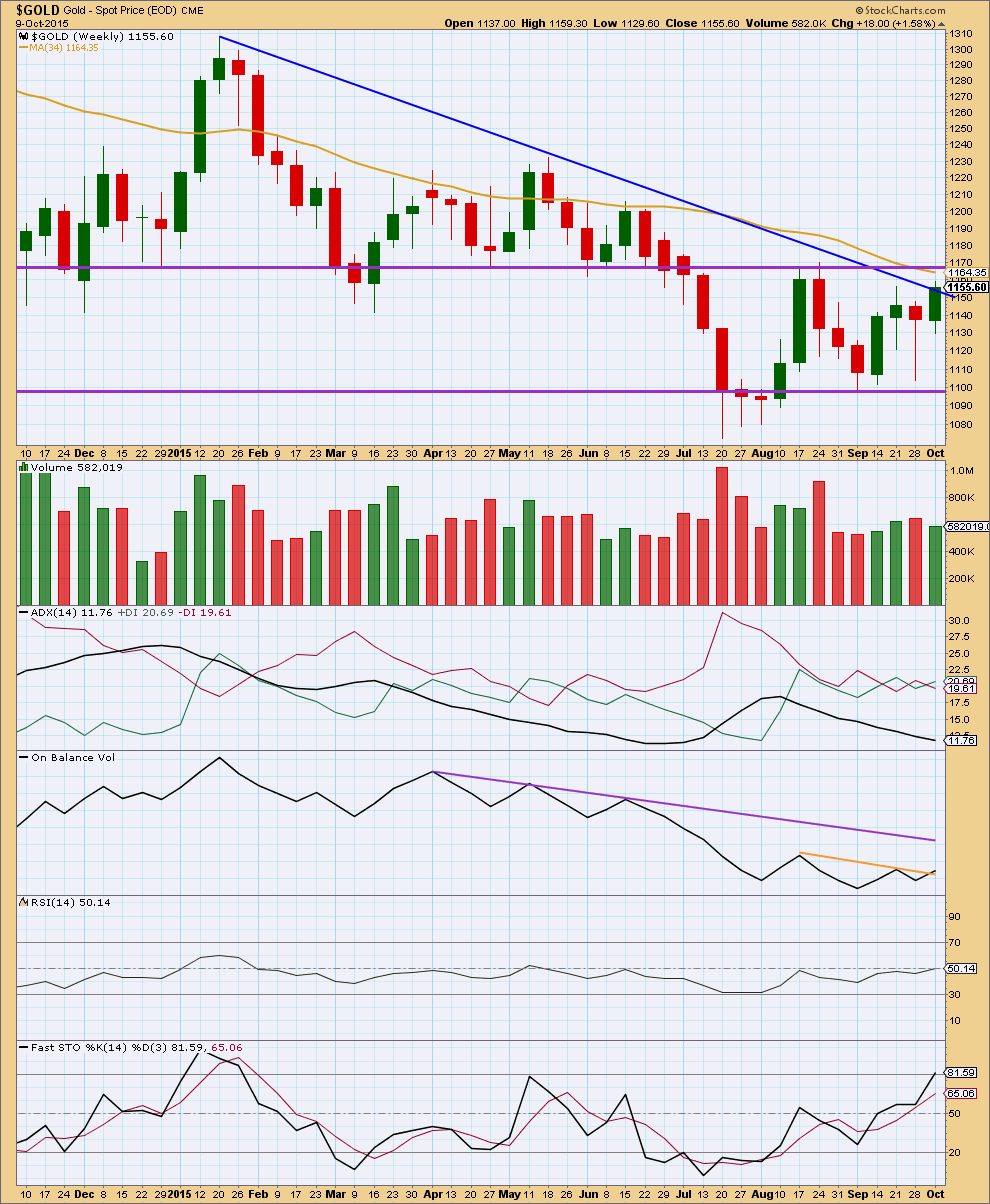
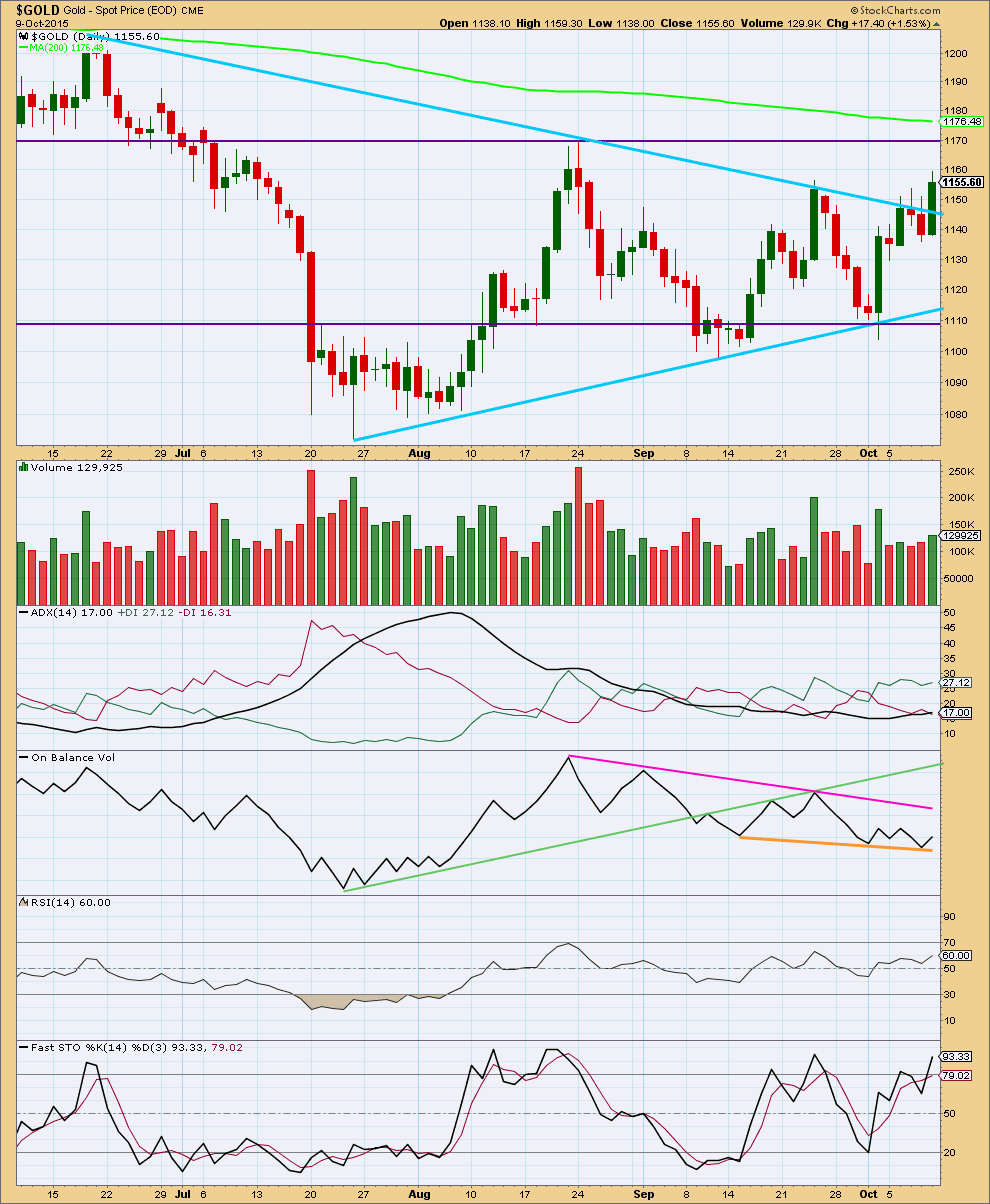
Click chart to enlarge. Chart courtesy of StockCharts.com.
Weekly: This week of upwards movement to complete a green candlestick is not supported by volume at the weekly chart level. During the recent sideways consolidation, it is still a downwards week which has strongest volume indicating a downwards breakout is still more likely than upwards.
At the weekly chart level, ADX still points lower indicating there is no clear trend. The market remains range bound within horizontal purple lines providing support and resistance. Overall volume during this range bound market is declining, which is typical for a consolidation.
On Balance Volume at the week end has slightly breached a small trend line (orange). This is a small bullish signal, but it is weak because the trend line is short and only tested once.
I have changed the Moving Average this week to 34 weeks because it is a Fibonacci number and somewhat close to the 200 day moving average. Price remains just below it; this may provide some resistance.
Click chart to enlarge. Chart courtesy of StockCharts.com.
Daily: Price has overshot the sloping trend lines providing resistance and support. A range bound approach would be best to use the horizontal lines at this stage as the sloping lines are not longer working.
There is some support for upwards movement of Friday with an increase in volume. However, volume is still lower than the upwards day of 2nd October, so as price has risen overall this week volume is weaker than the start.
During this consolidation, which began about 7th August (when the black ADX line began to decline), it remains a downwards day which has strongest volume indicating a downwards breakout may be more likely than upwards.
The black ADX line is beginning to point upwards and is above 15. This may be the earliest indication of a new upwards trend. The signal would be stronger if ADX is over 20.
A range bound trading system should be used as opposed to a trend following system. The system outlined here uses lines on price for support and resistance in conjunction with Stochastics to indicate oversold / overbought. The idea is simple. Expect price to swing between support and resistance. Expect one swing to end and the next to begin when price reaches support or resistance and Stochastics reaches oversold or overbought at the same time. At this time, price is returning from resistance and Stochastics is returning from overbought, so the downwards swing should be expected to continue.
Today’s small downwards day comes on some increase in volume. The fall in price has some support.
I added a new trend line to On Balance Volume. If OBV breaks below this orange line, then that would be further bearish indication. If OBV bounces up from this line, then the strength of the line would be reinforced and that would be bullish indication. OBV tends to work well with trend lines and not always so well with divergence, so I will just focus on using trend lines for it.
RSI indicates there is plenty of room for the market to rise or fall.
This analysis is published about 09:40 p.m. EST.
There is now a full daily candlestick above the upper edge of the blue channel and not touching it.
The bear wave count must now be substantially reduced in probability.
I will keep publishing it until price tells us its wrong though, because price is the ultimate determinator. And because base channels just don’t always work.
A new high above 1,170.19 would invalidate the bear and provide more confidence for the bull.
For now the bull needs to see a fourth wave correction unfold sideways, most likely target is the 0.382 Fibonacci ratio at 1,157. It should show up on the daily chart so that the third wave impulse of minuette (iii) has a five wave look to it on the daily chart. So I’m expecting a red candlestick or doji to Tuesdays session.
Subminuette ii was a deep 0.72 zigzag. Subminuette iv should be a shallow flat, triangle or combination. Subminuette ii lasted two days (produced two red daily candlesticks) so subminuette iv may be a bit longer lasting. It may last 2-5 days possibly.
In regular TA terms I’m expecting Gold to enter a small sideways consolidation which may not break below 1,153.80.
Short term a new low below 1,153.80 would favour the bear over the bull. While price remains above that point now the bull should be favoured over the bear.
I picked up some more dust and JDST pre market. May sell them yet today and just bring my avg down.
Great buy. Curious Lara’s end of day comment if she prefers next move bull or bear?
Bull hourly chart – “The bright aqua blue channel is a best fit. If the upper edge is breached (as it should be for a strong third wave up), then it may provide support.”
I think gold may have just ended a retracement down to 1,159.35 at 10:41 am from high at 1,169.10 at 8:06 am.
1,159.35 may have held at support at upper bright aqua blue channel.
Any buyers of GDX or NUGT at this point for possible move up above 1,170.19 that bull wave minor wave 4 must move above? Or am I too early for this? Any wave counts?
If GDX closes here it will be a huge bearish reversal candle pattern: Dark Cloud. Bearish.
Plus there is bearish divergence with RSI and Oscillators LBR 3/10.
I can’t speak for GDX, but I believe gold itself will push higher in the coming days – although there may still be some short term downward movement – until it reaches 70+ RSI. The bulls need to exhaust themselves.
Looks like it may turn into a bearish engulfing
COT and Gold chart. updated data.
COT and Gold chart.
Thanks Dreamer for your COT chart.
Every time commercial shorts have increased substantially gold has retreated. Combined this with Lara’s bear wave expect gold to put in a reversal candle today IMHO.
Finally a third wave of 3rde is beginning
As of last week COT report commercials are 98000+ Net short. AND in last 3 weeks number of shorts have risen to by 60000+.
Thus gold is a risky trade for long.
Gold will almost certainly break 1170, although it may make a little dip back down before doing so.
While my view doesn’t seem to line up with EW at this time, I am seeing the long term down trendline of this entire bear market as the ultimate final target for this correction. See remarks and charts under Sept 25 comments section. At a minimum, gold should reach the 200 day MA at 1176, but more likely 1180s. IMHO that will be one heck of a shorting opportunity.
That target should be reached this week, or next week at the latest.
IMHO Gold price unlikely to get below 1155 in a hurry with 1145-44 seen as limiting (subject to break below 1148-47)…. Good luck all~!
Interesting monthly gold chart.
https://www.dropbox.com/s/nxzzfr8he0xll2d/BUY%20GOLD%20WITH%20CONFIDENCE.png?dl=0
It looks like gold just broke above Lara’s Monday morning target of $1,165.01 at 1:54 am Monday. Now 1,166.13 at 2:23 am.
“In the short term, both wave counts expect Monday to begin with a little more upwards movement to complete a small impulse with a target at 1,165. What happens after that will be crucial. Look for downwards movement to find some support at the aqua blue trend line on the hourly charts.” (Maybe at about 1,141)
1165 was hit. Let’s see if this is a reversal now or a series of 4’s and 5’s coming. Bull or bear time!
This is a great shorting opportunity.
Remove this old comment from the Bull comment section as that happened on Friday, “To the upside, a new high above 1,156.83 would invalidate the bear wave count and provide strong confirmation for this bull wave count.”
I believe that 1,156.83 confirmation needs to be removed off of the daily bull chart as the daily chart shows gold closed at 1,156.99.
GDX pullback expected
chart courtesy of ThirdEyeOpenTrades
Gold COT. 3rd week in a row for Commercial Short increase
Explanation of COT
Silver COT. Big spike in Commercial Shorts
Lara weekend review of EW by Ron Rosen on long term DOW,SPX and Gold.
Any comments on markets. markets from 1929 to today.
————————————————————————————————————-
THE ROSEN MARKET TIMING LETTER
“One of the first signs that the bull move in gold is underway would be a
substantial increase in volume at an apparent low followed by a clear 5 w ave move up. If the 5 wave move up is followed by a clear 3 waves down we would have additional evidence that the bull move is underway. That is exactly what the daily gold chart on this page is showing us. ”
http://www.321gold.com/editorials/rosen/rosen100515.pdf
I’m looking at the daily Gold chart he has right at the end of that report you link to. The data he’s using is different to the data I’m using.
With the FXCM data I use that wave count won’t work.
The end of primary B (bull daily chart) is the low at 1,072. It cannot be seen as over at the next low (with a truncated fifth wave) where he has his equivalent end to the downwards move because the last wave down just will not subdivide as a five on the hourly chart (with my data). So I can’t see primary B over at that low, where he has the end of the down move.
I can’t see what I have as minor 1 as a five wave structure. There is an overlap between the high of minute a and the low of minuette (iv) (again, I’m referring to my daily bull chart). And so with FXCM data that upwards move may only be a three.
That’s the difference. Everything else I’m seeing the same way (since the low at 1,072).
The wave down I have as minor 2 is a three, the wave up I have as minute a is a five, and the wave down I have as minute b is a three.