
Elliott wave and traditional technical analysis of NZDUSD.
New updates to this analysis are in bold.
ELLIOTT WAVE COUNT
Click chart to enlarge.
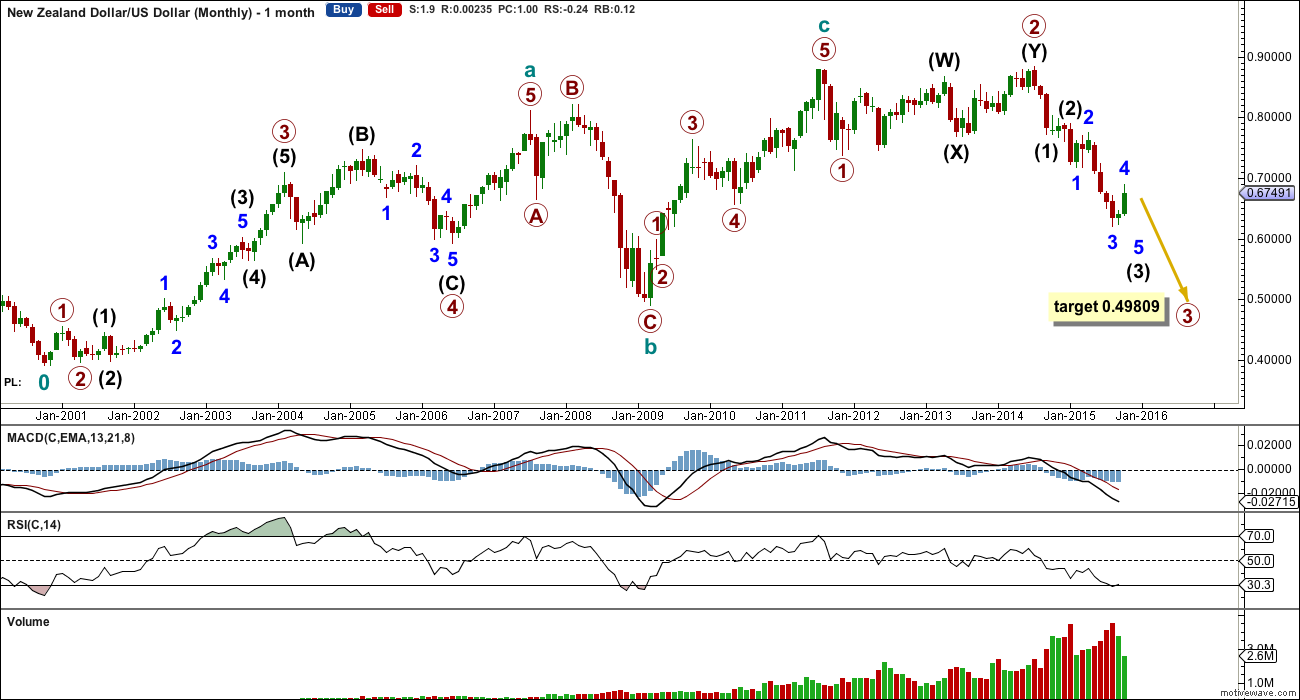
Primary 3 should end when RSI indicates oversold and most likely not before. Currently RSI has returned just above oversold.
Primary 3 would reach 2.618 the length of primary 1 at 0.49809. The structure of primary 3 is incomplete.
Click chart to enlarge.
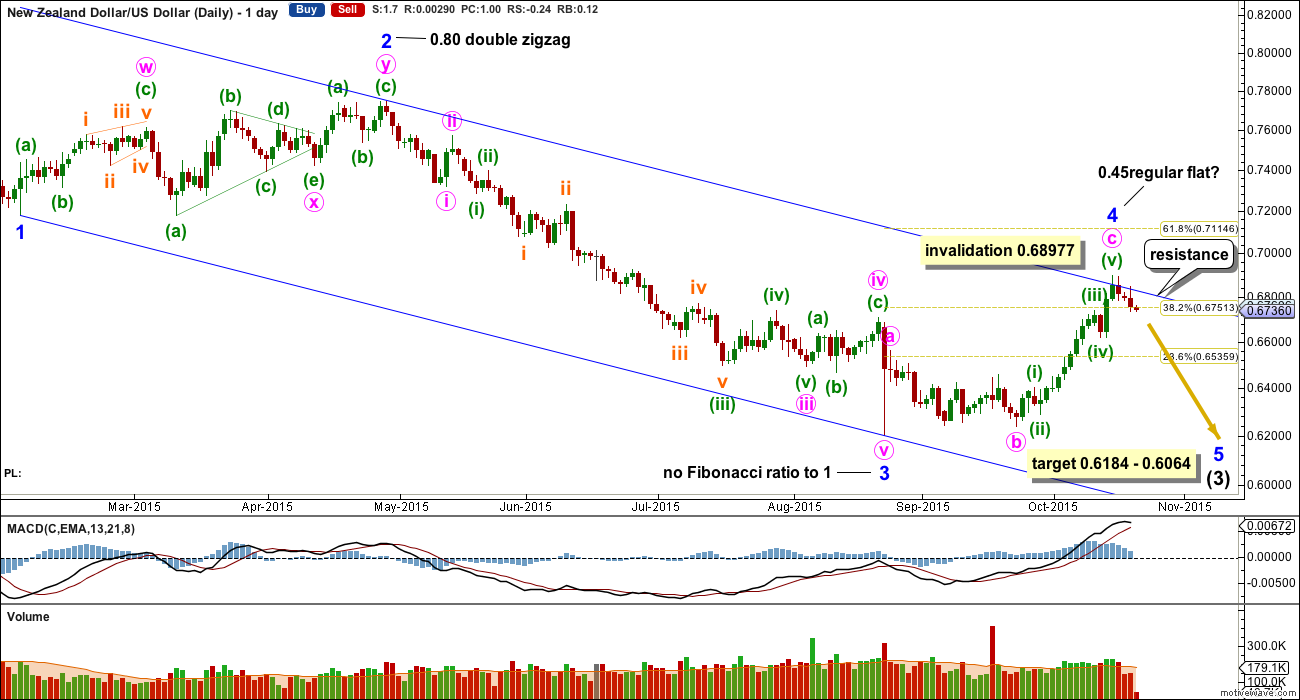
Within intermediate wave (3), minor waves 1, 2, 3 and now most likely 4 are all complete.
There is no Fibonacci ratio between minor waves 3 and 1.
At 0.6184 minor wave 5 would reach equality in length with minor wave 1. At 0.60604 intermediate wave (3) would reach 1.618 the length of intermediate wave (1). This gives a rather large 120 pip target zone. When there is more structure within minor wave 5 (specifically when minute waves i through to iv are complete), then the target calculation may be added to at a third degree. At that stage, the goal will be to narrow the target range.
Minor waves 2 and 4 exhibit alternation: minor wave 2 was a deeper double zigzag and minor wave 4 is a more shallow flat.
The channel is drawn using Elliott’s technique. In this instance it appears so far to be working well to show where minor wave 4 has most likely ended. If price throws back to the upper edge of the trend line and finds resistance again about there, then the strength of the line would be reinforced and may then be more reliable.
The invalidation point is the start of minor wave 5 at 0.68977. If minor wave 5 has begun, then no second wave correction within it may move beyond its start. If the invalidation point is breached, the analysis is wrong. It may be minor wave 4 is continuing further.
The invalidation point is close by at this time, although this wave count is not confirmed. If the upper trend line holds, then this wave count indicates potentially a good risk / reward ratio.
TECHNICAL ANALYSIS
Click chart to enlarge. Chart courtesy of StockCharts.com.
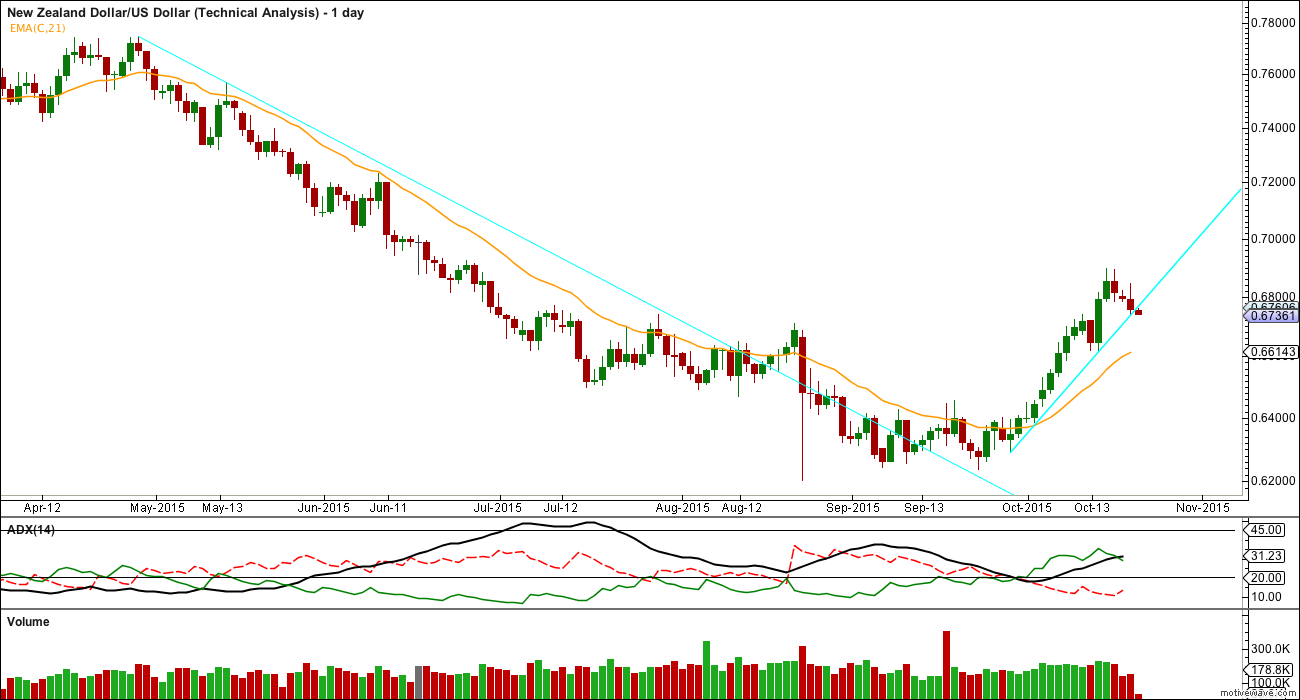
ADX still indicates an upwards trend is intact. The upwards sloping bright aqua blue trend line supporting this last rise in price has not been breached. The bright blue line needs to be breached for more confidence in the Elliott wave count.
ADX tends to be a lagging indicator. By the time it shows a new downwards trend that trend may be about halfway through, if the target is where it may end for a relatively short fifth wave.
The 21 day EMA seems to work reasonably well for the Kiwi. It may assist to show where price finds resistance. The Elliott wave count now expects price to move below the 21 day EMA. If that happens, it would provide further confidence in the wave count.
During the last correction it was a downwards day which has strongest volume. This is some small support for the Elliott wave count which expects a downwards wave to follow.
It looks like volume has increased quite a lot over the last few years. Do you have any thoughts on why this is??
Thanks