
Silver has been in a bear market since April 2011.
Summary: The bear market must be assumed to remain intact while price remains within the bear market channel.
From an Elliott wave perspective, there are still at least three possible wave counts for Silver at the weekly chart level, and at the daily chart level multiple possibilities remain viable. Unfortunately, at this time the Elliott wave picture is unclear for Silver and probably will remain so for some time. Regular technical analysis should be used to determine which wave count is most likely.
New updates to this analysis are in bold.
WAVE COUNT #1
Click chart to enlarge.
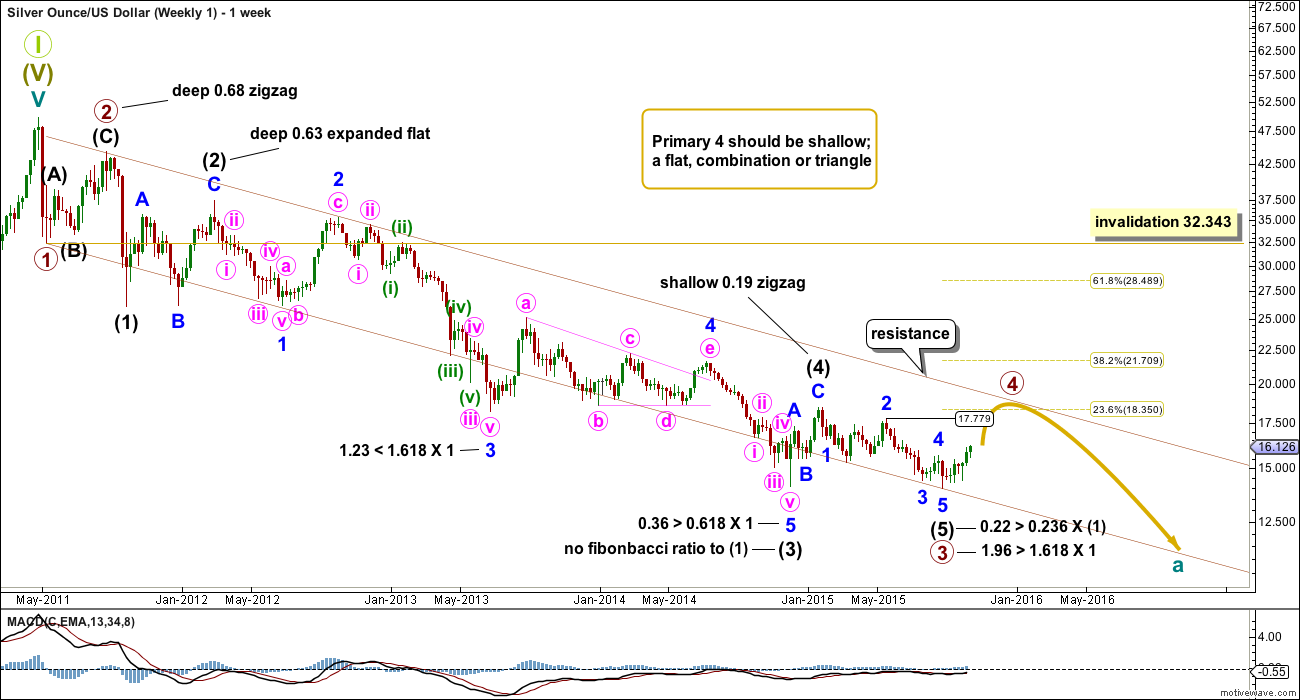
This first wave count sees a 5-3-5 complete downwards for primary waves 1, 2 and 3.
The channel (maroon) drawn about this downwards movement is drawn using Elliott’s first technique. Draw the first trend line from the lows labelled primary waves 1 to 3, then place a parallel copy on the high of primary wave 2. Primary wave 4 may find resistance at the upper edge of the channel.
Primary wave 2 was a deep single zigzag. Given the guideline of alternation expect primary wave 4 to be shallow and a flat, combination or triangle.
The difficulty with this wave count comes with the multiple structural possibilities for primary wave 4. It is impossible to tell which structure will unfold, only that it is most unlikely to be a zigzag or zigzag multiple. If it is an expanded flat, running triangle or combination, it may include a new price extreme beyond its start, so it may include a new low below 13.983.
Intermediate wave (1) lasted a Fibonacci 5 weeks; intermediate wave (2) was 22 weeks, just one more than a Fibonacci 21; intermediate wave (3) was exactly a Fibonacci 144 weeks; and, intermediate wave (5) was 31 weeks, three short of Fibonacci 34.
Primary wave 2 lasted 15 weeks. Primary wave 4 is expected to be longer lasting because zigzags are quicker than combinations, triangles and even flats. Primary wave 4 may total a Fibonacci 21 or 34 weeks, give or take up to three weeks either side of these expectations.
Primary wave 4 may not move into primary wave 1 price territory above 32.343.
Click chart to enlarge.
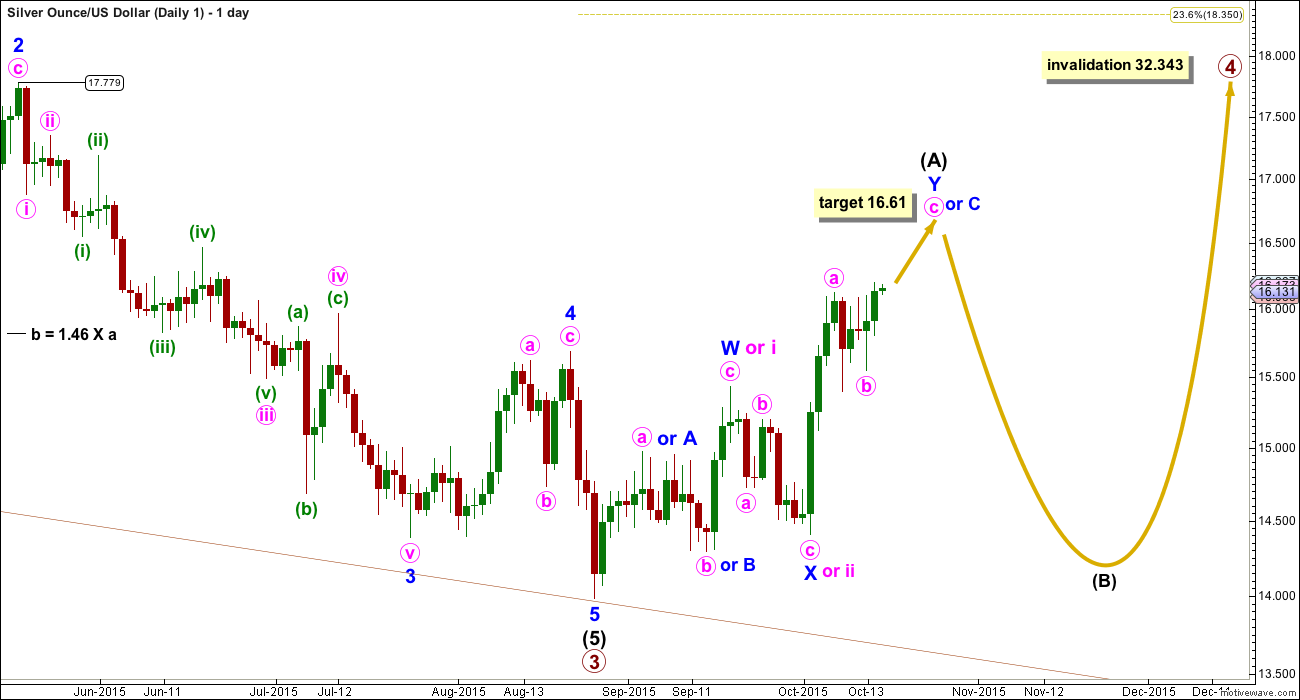
All wave counts will show daily charts from the price point marked at 17.779 which was 18th May, 2015.
Primary wave 4 is most likely to be a flat, combination or triangle. For all of these structures the first wave up should be a three at intermediate degree.
The first movement up has continued and at this stage it may be unfolding as a double zigzag, with price now in the second zigzag of the double. The double may be joined by a three in the opposite direction, a zigzag labelled minor wave X.
This upwards movement may continue to unfold as a single zigzag as per alternate labelling. Instead of a zigzag up for minor wave W the first five up for minor wave A may have ended lower, followed by a three down for minor wave B, and now a five up underway for minor wave C which would be now in the third wave of minute wave iii. For alternate labelling, if minor wave C upwards is unfolding as an impulse, then it would be a long extended impulse. For clearer labelling of that idea look to the Daily 2 chart; instead of minor waves 1, 2, 3 this idea would be labelled minor waves A, B and C. Both A-B-C of a zigzag and 1-2-3 of an impulse subdivide the same way. And so the target for alt minor wave C would be 17.39.
At this stage, there are still multiple possible structures open for primary wave 4. It is impossible to tell which one will unfold, so it is impossible to tell what pathway price may take to complete this consolidation.
WAVE COUNT #2
Click chart to enlarge.
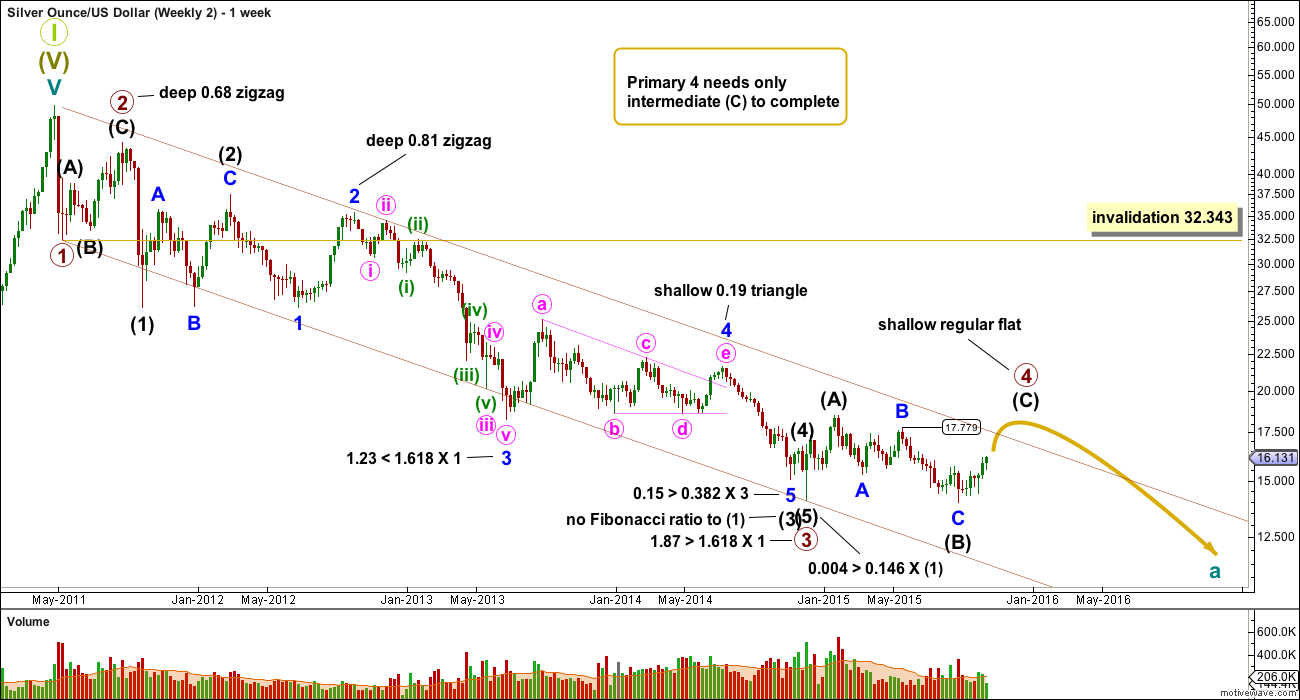
Primary wave 4 may already be underway. Primary wave 3 still has a close Fibonacci ratio to primary wave 1. This wave count and the first wave count both have similar Fibonacci ratios, so there is no advantage nor disadvantage between them in this regard.
Within primary wave 3, intermediate wave (1) lasted a Fibonacci 5 weeks; intermediate wave (2) lasted 22 weeks, one longer than a Fibonacci 21; intermediate wave (3) lasted 40 weeks with no Fibonacci duration; intermediate wave (4) lasted a Fibonacci two weeks; and, intermediate wave (5) lasted a Fibonacci one week.
Primary wave 4 may be over halfway complete as a regular flat correction. Within the flat correction, intermediate waves (A) and (B) both subdivide as three wave structures and intermediate wave (C) is incomplete.
The channel here is a little different, a best fit, so not drawn using Elliott’s technique.
Click chart to enlarge.
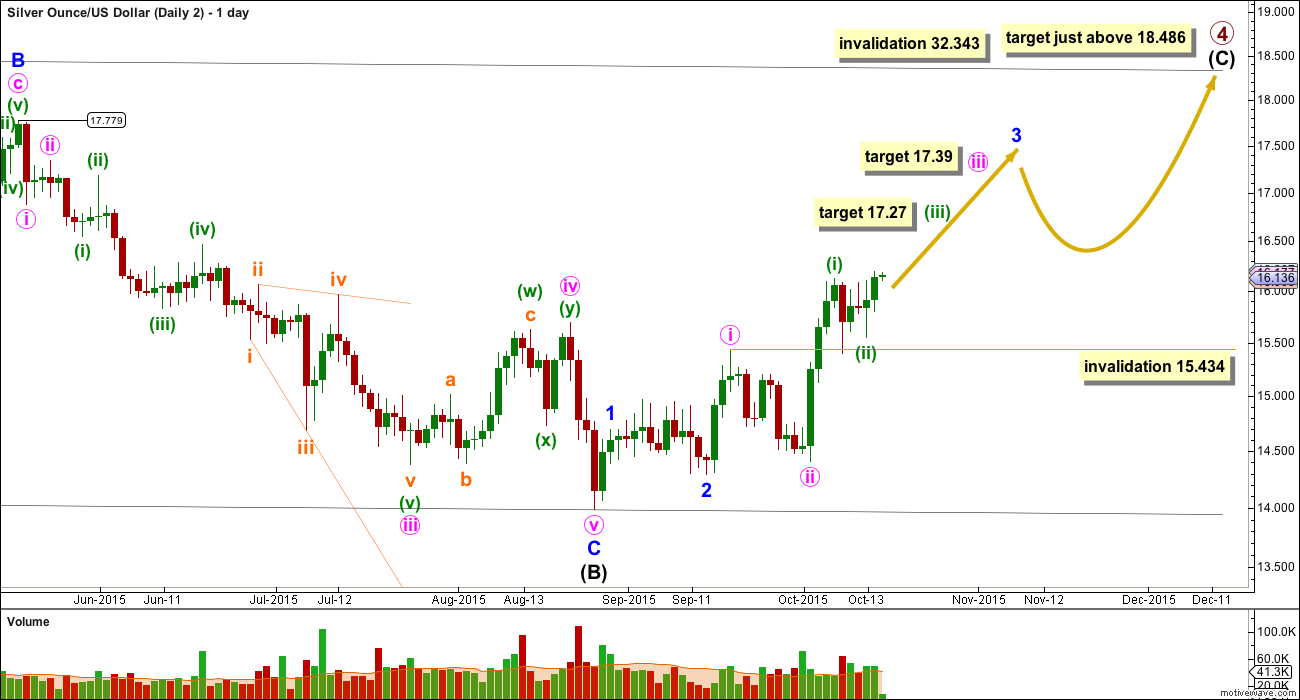
Intermediate wave (C) must be a five wave structure. So far minor waves 1 and 2 may be complete. Minor wave 3 would most likely be incomplete.
Minor wave 3 is extending.
Within the impulse of minor wave 3, minute wave ii and minuette wave (ii) both show on the daily chart. The next interruption to the upwards trend may come when the middle of the third wave is over at the end of minuette wave (iii). At 17.27 minuette wave (iii) would reach equality in length with minuette wave (i).
At 17.39 minute wave iii would reach 2.618 the length of minute wave i.
Intermediate wave (C) is highly likely to move at least slightly above the end of intermediate wave (A) at 18.486 to avoid a truncation. Regular flats normally have a sideways look; the C wave is normally close to equality in length to the A wave. Intermediate wave (C) would be likely to end just above 18.486 to achieve a sideways look.
The structure of upwards movement cannot now be an incomplete ending diagonal (although it could be complete, as per the daily 3 chart it would be far too short to be intermediate wave (C) ). The third wave would be longer than the first indicating an expanding diagonal, but the fourth wave would be shorter than the second and the wave lengths do not meet the rules for either a contracting or expanding diagonal. Intermediate wave (C) must be an impulse.
WAVE COUNT #3
Click chart to enlarge.
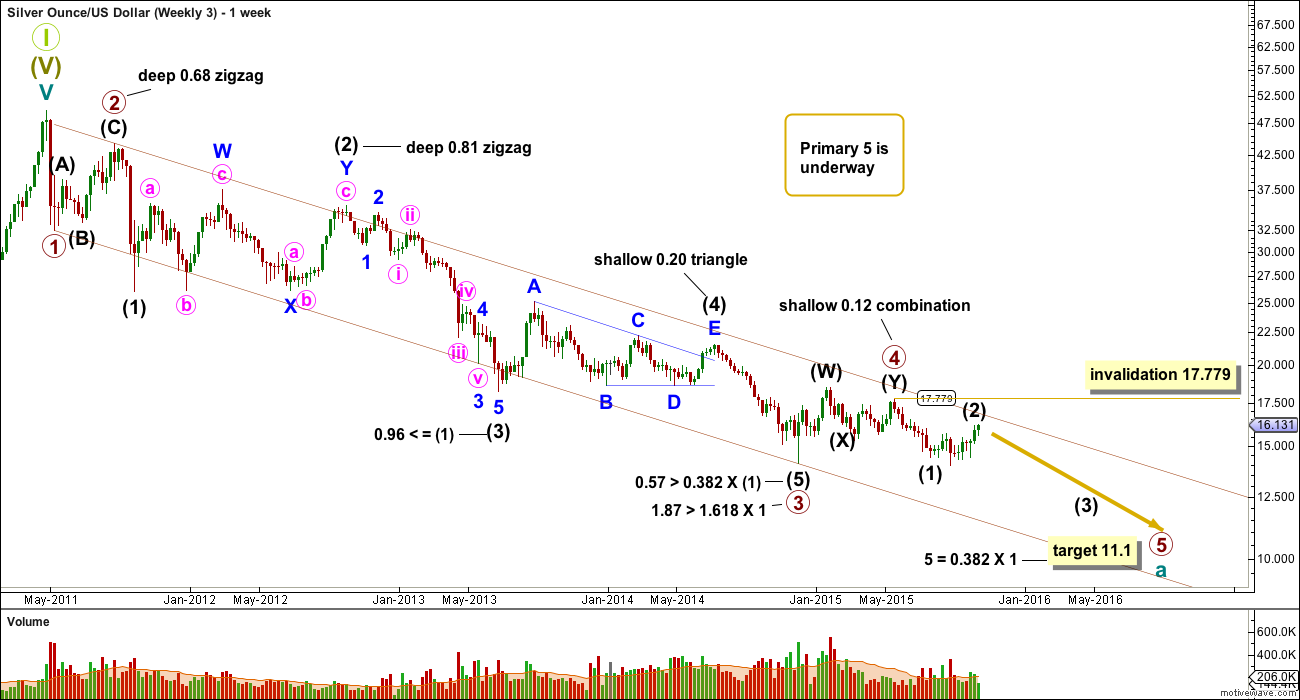
Primary wave 4 may be complete and primary wave 5 may be underway.
Primary waves 2 and 4 exhibit perfect alternation and good proportion: primary wave 2 was a deep zigzag lasting 15 weeks and primary wave 4 was a shallow combination lasting 24 weeks, 1.618 the duration of primary wave 2.
At 11.1 primary wave 5 would reach 0.382 the length of primary wave 1.
Although this wave count is labelled #3 it is my preferred wave count. I am presenting them in the order in which I developed each, not in order of preference. This wave count is preferred primarily for the reason that there has been no technical confirmation of a trend change from bear to bull for Silver.
Intermediate wave (2) may not move beyond the start of intermediate wave (1) above 17.779. A breach of this invalidation point would now also require a strong breach of the bear market channel, so this invalidation point should not be moved any higher. When that channel is breached that should indicate a trend change for Silver from bear to bull. At that stage, only bullish wave counts should be seriously considered.
Click chart to enlarge.
The upper edge of the maroon channel is copied over here from the weekly chart. It should provide resistance if Silver is still within a bear market. If that trend line is clearly breached, then this wave count should be discarded before the invalidation point is passed.
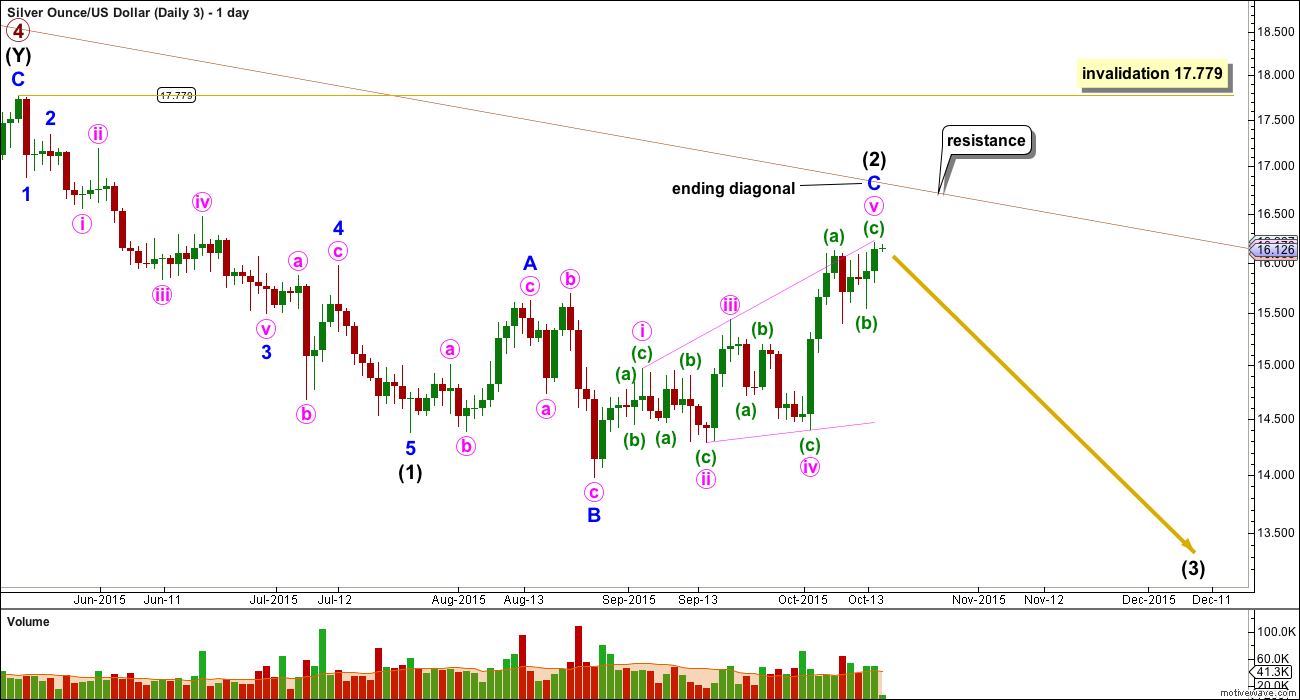
Intermediate wave (2) may be completing as an expanded flat correction. Within intermediate wave (2), minor wave B was a 1.32 length of minor wave A, nicely within the normal range of 1 to 1.38.
Minor wave C may be an ending expanding diagonal. The fifth wave has continued higher and still overshoots the i-iii trend line. There is no longer a Fibonacci ratio between minor waves A and C.
Ending diagonals require all sub waves to subdivide as zigzags.
I would have a little confidence that intermediate wave (2) is over when there is a downwards day on increased volume. At that stage, I would calculate a target for intermediate wave (3) to end. To do so today would be premature. The target for the whole of primary wave 5 remains the same at 11.1 (weekly chart).
TECHNICAL ANALYSIS
Click chart to enlarge. Chart courtesy of StockCharts.com.
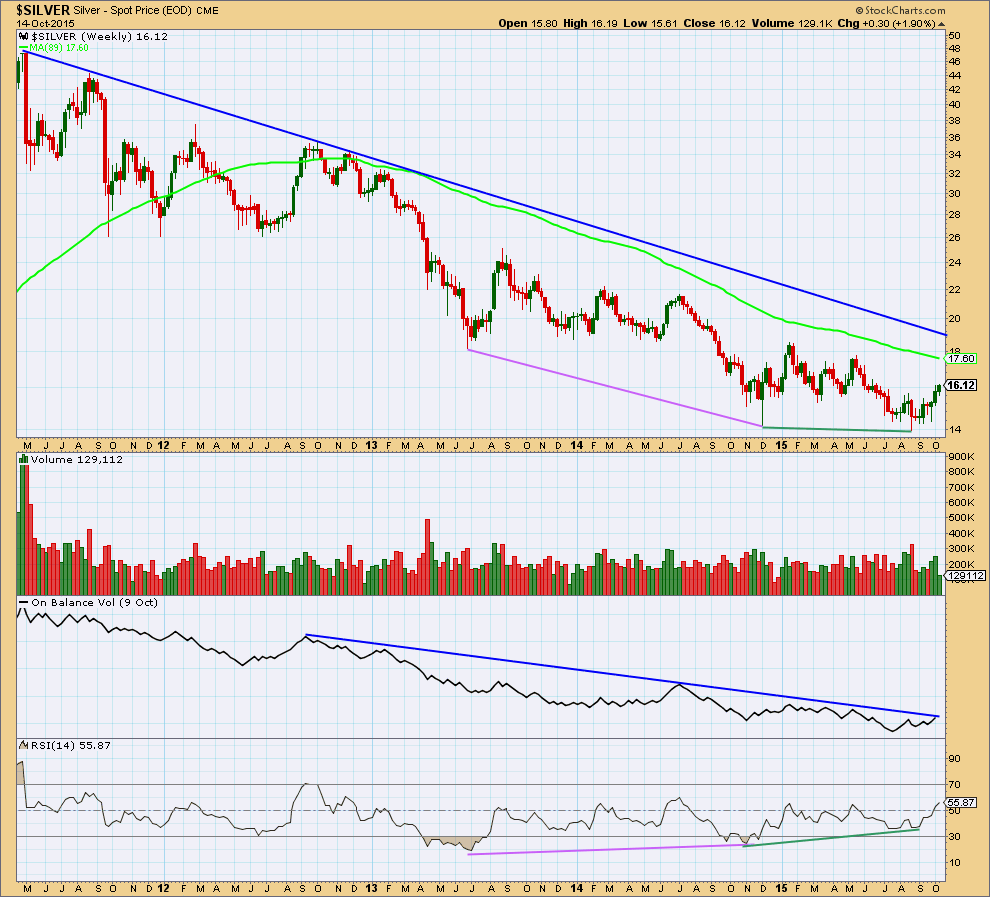
Weekly: Silver has been in a bear market since April 2011. I am adjusting the length of the weekly moving average, so that it shows where this bear market has been finding resistance. The 89 week (a Fibonacci number) Simple Moving Average works well for this bear market. If that is breached by a weekly candlestick, it would be strong indication that Silver has changed from bear to bull.
Overall, while Silver has been in a bear market, volume is declining which indicates the bear trend is maturing, a change to a bull market is closer. Volume will not tell us exactly when that change comes though. It is a warning sign only.
Of recent weeks, strongest volume is for a downwards week. This is bearish.
On Balance Volume remains below a long held trend line. This trend line is somewhat shallow, repeatedly tested, and reasonably technically significant. While OBV remains below that trend line it will remain bearish. This week OBV has come up to touch this line. A break above it would be bullish. If OBV finds resistance and turns down here, it would be bearish.
RSI shows strong double divergence with price over a long time period (pink and green lines on price and RSI). While price made new lows RSI failed to make new lows. This indicates weakness in downwards movement and is bullish. Because this divergence is double and over such a long time period it is highly technically significant. This indicator is often leading (anticipates a trend change). The first two bull wave counts must be seriously considered for this reason.
The regular technical analysis picture is unclear at the weekly chart level. A trend change will come and RSI is indicating it may come sooner or have arrived already. It needs to be confirmed by price, and a break above the blue bear market trend line would be full and final confirmation of a trend change.
Click chart to enlarge. Chart courtesy of StockCharts.com.
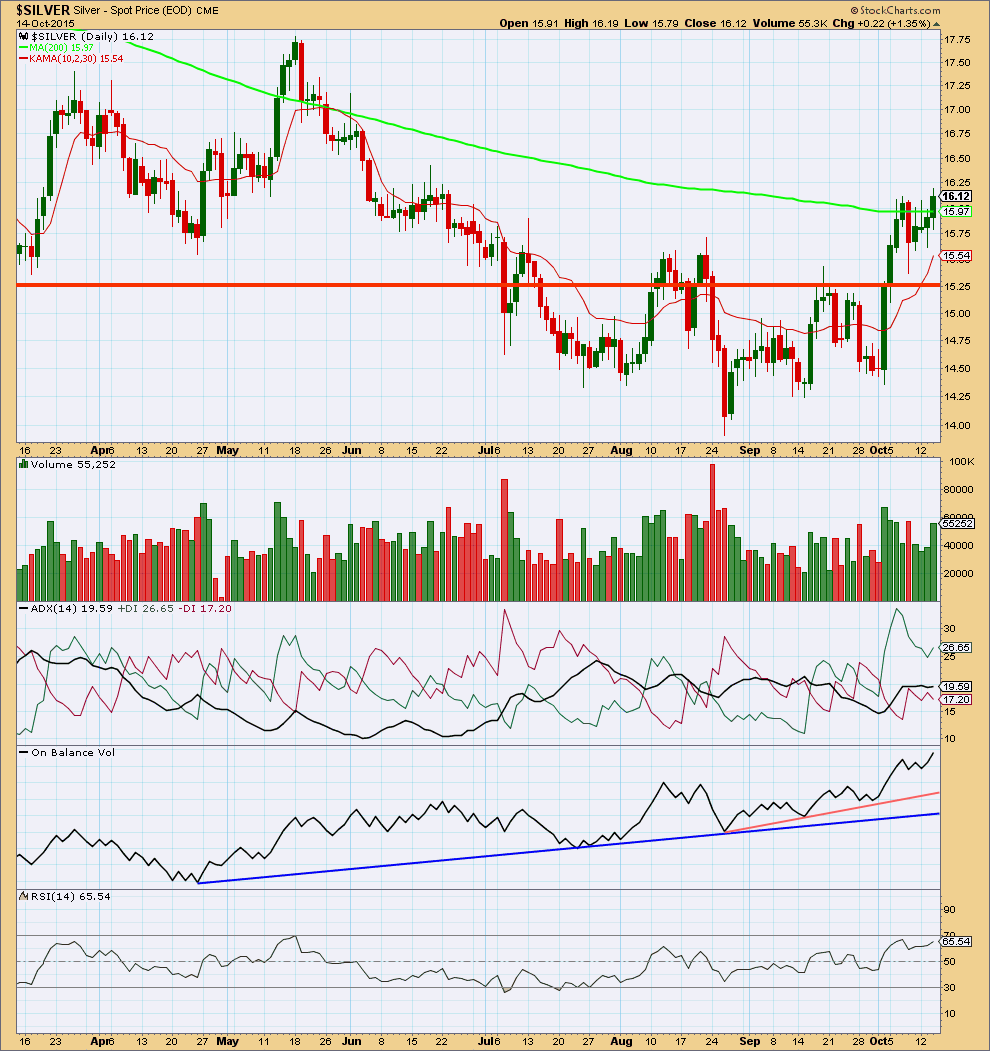
Daily: The strong upwards day on an increase in volume of 2nd October was a warning of an upwards breakout. This was confirmed when price closed above the upper horizontal trend line on 5th October. Price has now come to close just above the 200 day Simple Moving Average. This is the most bullish indication from Silver for some time.
The volume profile for Silver is remarkably unclear. The last rise in price came on declining volume, but for the last three days a second rise in price comes on increasing volume.
The 200 day Simple Moving Average has not been a reliable indicator of a trend change nor resistance more recently. Silver keeps moving above it for short periods then returning below to make new lows.
ADX is less clear this week and only slightly rising and below 20. The upwards trend may still be intact. If the black ADX line still points upwards in the next day or two, then an upwards trend would be indicated.
While ADX indicates a trend, albeit weak, support and moving averages should be used rather than oscillators. I am removing Stochastics.
I have added Kaufman’s Moving Average because ADX now indicates a trending market. This may be useful to show where downwards movement may find support during this upwards trend.
This regular technical analysis today at the daily chart level strongly supports the Elliott wave count numbers 1 and 2.
This analysis is published about 03:42 a.m. EST.
Lara thanks for Silver EW report.
As I have learned gold and PM sector bull/bear trend are same as silver. Silver to gold ratio (SGR) is a good indicator of gold and PM sector’s trend.
So far there is no sign of this ration turning up.
Unless some does an Elliott wave analysis of the ratio.
There is plenty history of this ratio’s relation to the gold trend.
Attached chart of SGR going back 1980 indicates only two times they diverge; 1997. and 1986.
I will be monitoring this ratio and its ADX line. In 2011 it went parabolic so as silver and gold.
Thanks