
Downwards movement was expected.
The session for 21st October provided confirmation of a trend change when it clearly breached the channel.
Summary: Downwards movement should continue towards 26.86. The target may be met in another 44 days.
New updates to this analysis are in bold.
MONTHLY ELLIOTT WAVE COUNT
Click chart to enlarge.
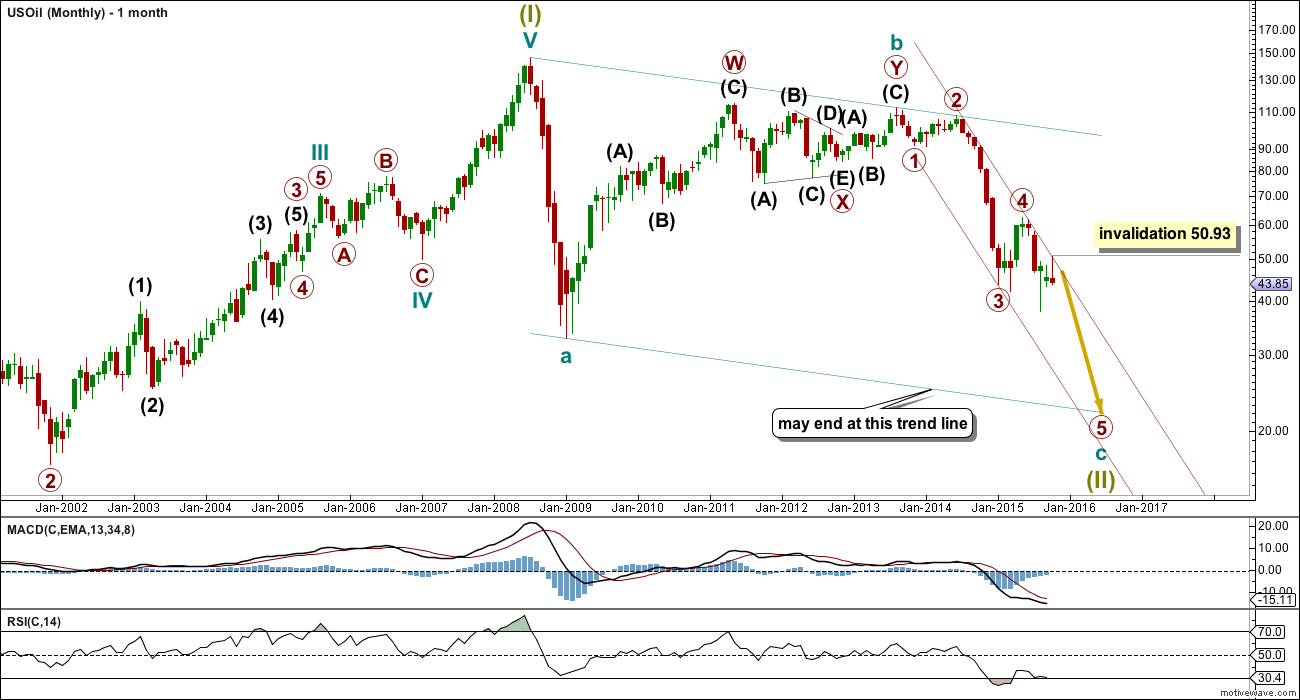
US Oil has been in a bear market since August 2013. While price remains below the upper edge of the maroon channel drawn here and below the 200 day simple moving average it must be accepted that the bear market most likely remains intact. I will not publish a bull wave count while this is the case and while there is no technical confirmation of a trend change from bear to bull.
The structure of cycle wave c is incomplete.
This wave count sees US Oil as within a big super cycle wave (II) zigzag. Cycle wave c is highly likely to move at least slightly below the end of cycle wave a at 32.70 to avoid a truncation. Cycle wave c may end when price touches the lower edge of the big teal channel about this zigzag.
It is just possible that cycle wave c could be complete at the last low of 37.75. However, that would see cycle wave c truncated by 5.05, which is a large truncation. I would consider this possibility only if it is confirmed with a clear breach of the maroon channel on the monthly chart.
Within cycle wave c, primary wave 5 is expected to be extended which is common for commodities.
Within primary wave 5, no second wave correction may move beyond its start above 62.58.
Draw a channel about this unfolding impulse downwards. Draw the first trend line from the highs labelled primary waves 2 and 4 then place a parallel copy on the end of primary wave 3. Next push up the upper trend line slightly to contain all of primary waves 3 and 4. Copy this channel over to the daily chart. The upper edge should provide resistance.
DAILY ELLIOTT WAVE COUNT
Click chart to enlarge.
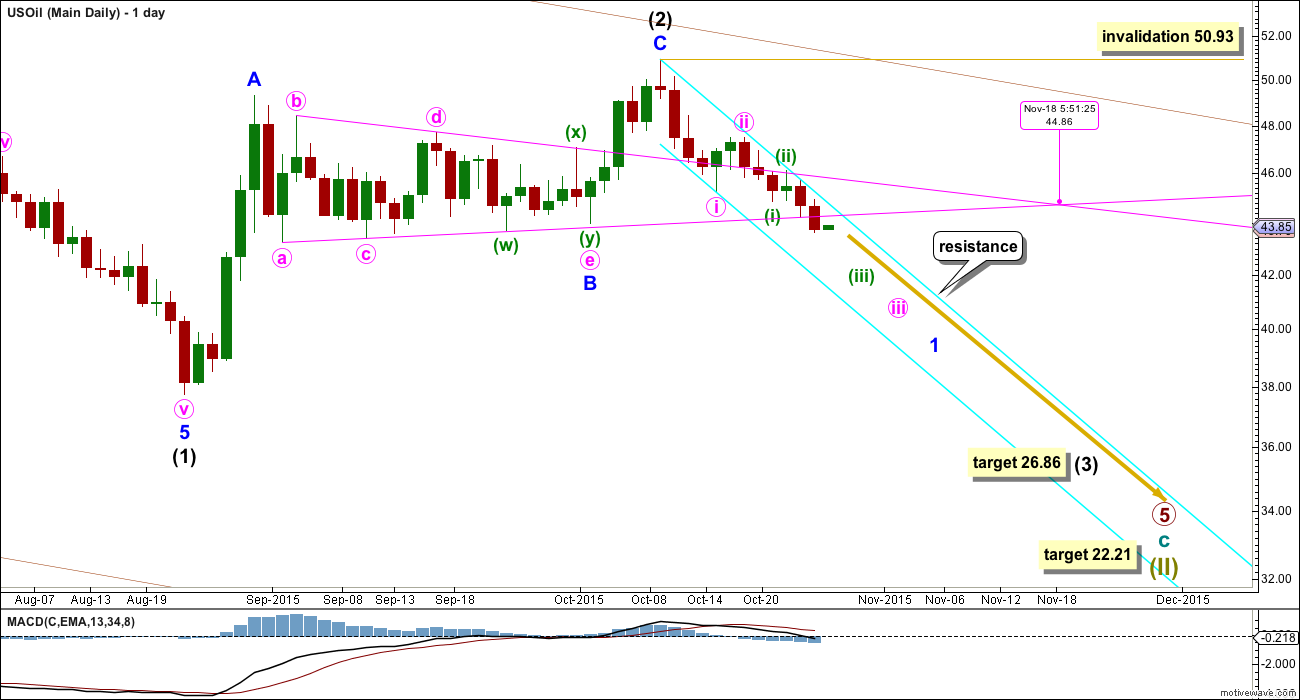
The channel drawn on the daily chart for last analysis was clearly breached by a full daily candlestick below it and not touching the lower edge on 21st October. This provided trend channel confirmation that intermediate wave (2) was over and intermediate wave (3) had most likely begun.
The invalidation point may be moved lower now that there is confirmation of a trend change. Within intermediate wave (3), no second wave correction may move beyond its start above 50.93.
At 26.86 intermediate wave (3) would reach equality in length with intermediate wave (1).
Intermediate wave (1) lasted 53 days, two short of a Fibonacci 55. Intermediate wave (2) lasted a Fibonacci 34 days. If intermediate wave (3) is equal in duration as well as length to intermediate wave (1), then it may continue now for a further 44 days to last a total Fibonacci 55. Give or take up to two days either side of this expectation would be reasonable.
The final target remains the same. At 22.21 primary wave 5 would reach 0.618 the length of primary wave 3. If this target is wrong, then it may not be low enough.
Extend the triangle trend lines from minor wave B outwards. The point in time at which they cross over may see a trend change. This would be the 18th of November. This method does not always work, but it works often enough for it to be a tendency to look out for. It may be that minor wave 1 completes on 18th of November.
The bright aqua blue channel is a best fit. Each time price touches the upper edge the strength of that line is reinforced. When price trends within a channel the edge of the channel may provide an indication of entry points to join the trend.
TECHNICAL ANALYSIS
DAILY CHART
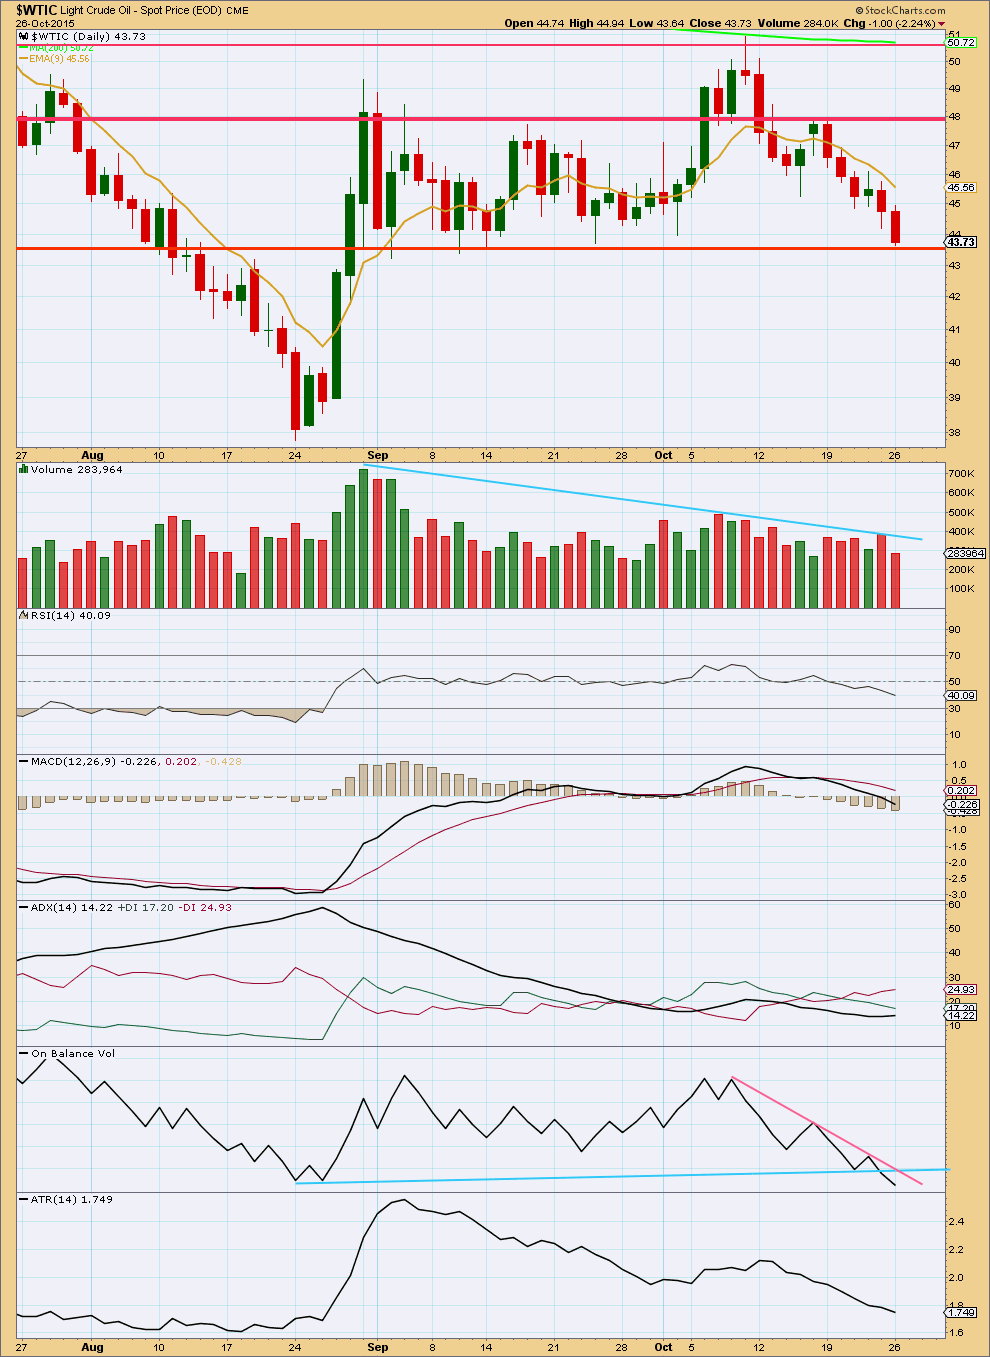
Click chart to enlarge. Chart courtesy of StockCharts.com.
Volume is still declining which indicates price may remain within a consolidation. The return of price to below the horizontal trend line, and a throwback to that line, is bearish.
The market may fall of its own weight. It does not require an increase in sellers for price to fall, only an absence of buyers. During the last big downwards move for US Oil there were periods of time where price fell on declining volume for several days. This may be happening again.
Price has come down to find support at the horizontal trend line which previously provided support. A break below this line would provide further confidence that the consolidation is over and a new downwards trend is beginning.
ADX is only slightly rising and still below 15. If the black ADX line rises above 15 a new downwards trend would be indicated. The red -DX line is above the green +DX line and so the trend would be down.
On Balance Volume has broken below the short held blue line. This is a weak bearish signal.
ATR indicates the range price is moving in continues to decline. This supports ADX in indicating the market most likely is range bound and not yet trending. If ATR turns upwards a new trend may be indicated.
When ATR has been flat or declining for long periods of time it should be expected that it will again turn upwards. The consolidation is very mature, a breakout should occur shortly.
Overall, this regular technical analysis supports the direction expected by the Elliott Wave count, but it does not quite yet support the idea of a new trend. There the Elliott Wave analysis may be an earlier indicator of a new downwards trend. When the regular TA supports the EW count I would have more confidence in the EW count.
This analysis is published about 05:15 p.m. EST.
Hi Lara: Thanks for update.
Does wave Y has to be higher than wave w????
A doji within a trading range is not much of direction. According to Steve Nison.
After a trend is established and a doji appears it may be a reversal or a continuation.
US oil is battling at at critical price point 46 confluence of resistance and trend lines.
Once it closes below 9 ema trend will begin down.
IMHO!!!
A new high above 46.46 indicates the move down from the high I had labelled intermediate (2) is a three. I can’t see this as a five on the hourly chart.
And so there is no five down, only a three.
Which means intermediate (2) is probably continuing higher as a combination or double zigzag. I would expect it to end when price comes to touch the upper edge of the maroon channel which is copied over from the monthly chart.
New chart updated here.
A long legged doji is formed on daily chart…it may also show reversal..??
Doji are just as likely to be continuation patterns as reversals, according to Bulkowski anyway.
Is there a leading diagonal possibility Lara? Do the counts fit for it?
US Oil has made a deep retracement today.
As long as this upwards move does not move above 46.46 the wave count will remain valid.
If price moves above 46.46 then the downwards move out of intermediate (2) is a three wave structure and it’s complete. That means intermediate wave (2) would not be over and would be continuing further as a double zigzag (most likely). New highs would be expected, the invalidation point would be at 61.82, but use the upper edge of the maroon channel (monthly and daily charts) for resistance.
If price turns down from here and does not move above 46.46 then it’s a fourth wave correction as per the updated chart here.
More downwards movement would be expected. Short term target 41.55.
Yes. Plenty of downside potential with a clear upside safety limit. Appreciate the timely update. Thanks Lara.
Lara, based on your labeling, Minor 1 would be a leading diagonal, correct? With pink i and iv overlapping? I am asking because one of your quotes that rings in my ears is – every time I think it’s a leading diagonal, it isn’t.
I will be keeping an eye on 46.46, thanks.
No. I determined the labelling within minor 1 on the hourly chart.
Minute i ends at 46.46.
So far minute iv has reached up to 46.22. So far there is no overlap between minute i and iv.
Which is why I say as long as price doesn’t move above 46.46 the wave count will be valid.
Interestingly, Motive Wave tells you to reconsider your wave count if 4 and 2 overlap, which is very strange. The rule is 4 may not overlap wave 1 price territory. There is no rule which states 4 may not overlap 2.
If the second wave is an expanded flat then the fourth wave can overlap into second wave price territory and the rule for the 4-1 overlap is still met. That is what is happening here.
Thanks for the update!
Looks like the oil did move higher… We touched 46,52 not long ago..
Thank you so much for these oil updates, Lara!
The trend changed when green crossed below red -D1 line. Being lagging the black remained below 15.
Once price traded below 9ema and trending down oil is expected to follow EW count.
Great call Lara. Perfect target for wave 2.
Thanks.
Thanks for the update Lara!!