
The triangle completed sideways and was followed by upwards movement, as expected.
The target is recalculated today.
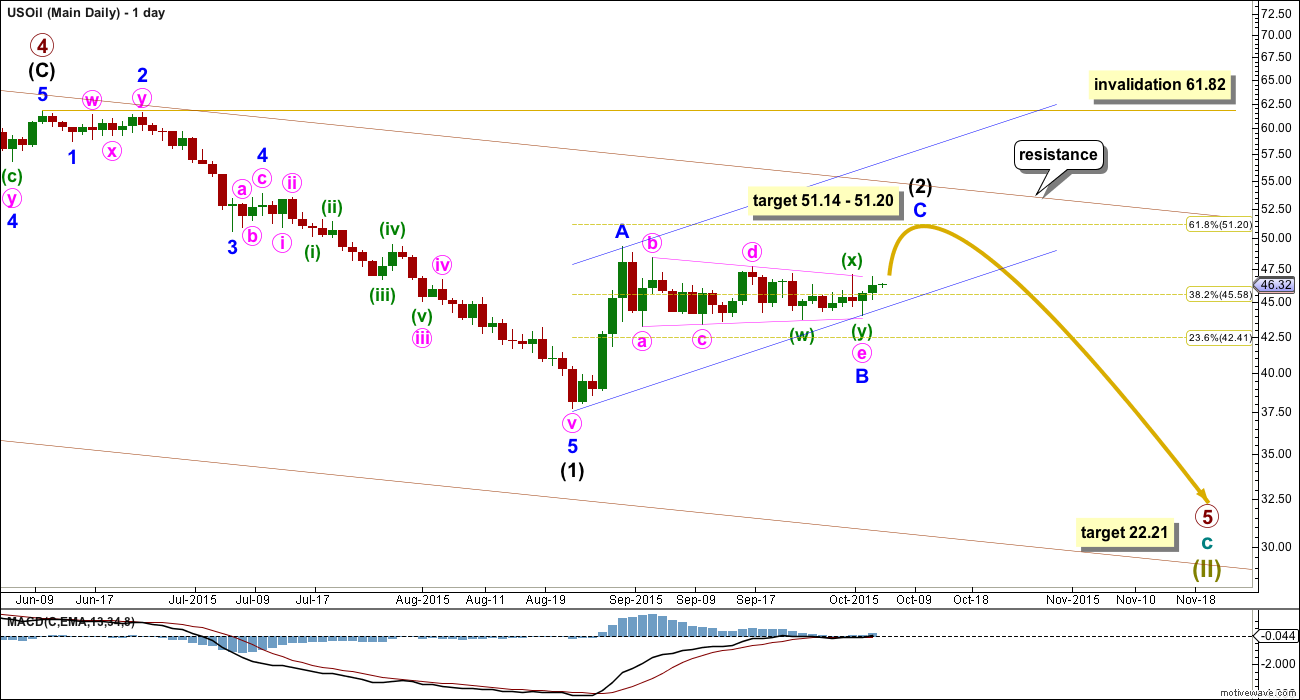
Summary: I expect a zigzag is completing upwards. The target is at 51.14 to 51.2. If it is met in three days time, the correction would last a Fibonacci 34 days in total, give or take up to two days either side of this expectation.
Changes and additions to last analysis are bold.
MONTHLY ELLIOTT WAVE COUNT
Click chart to enlarge.
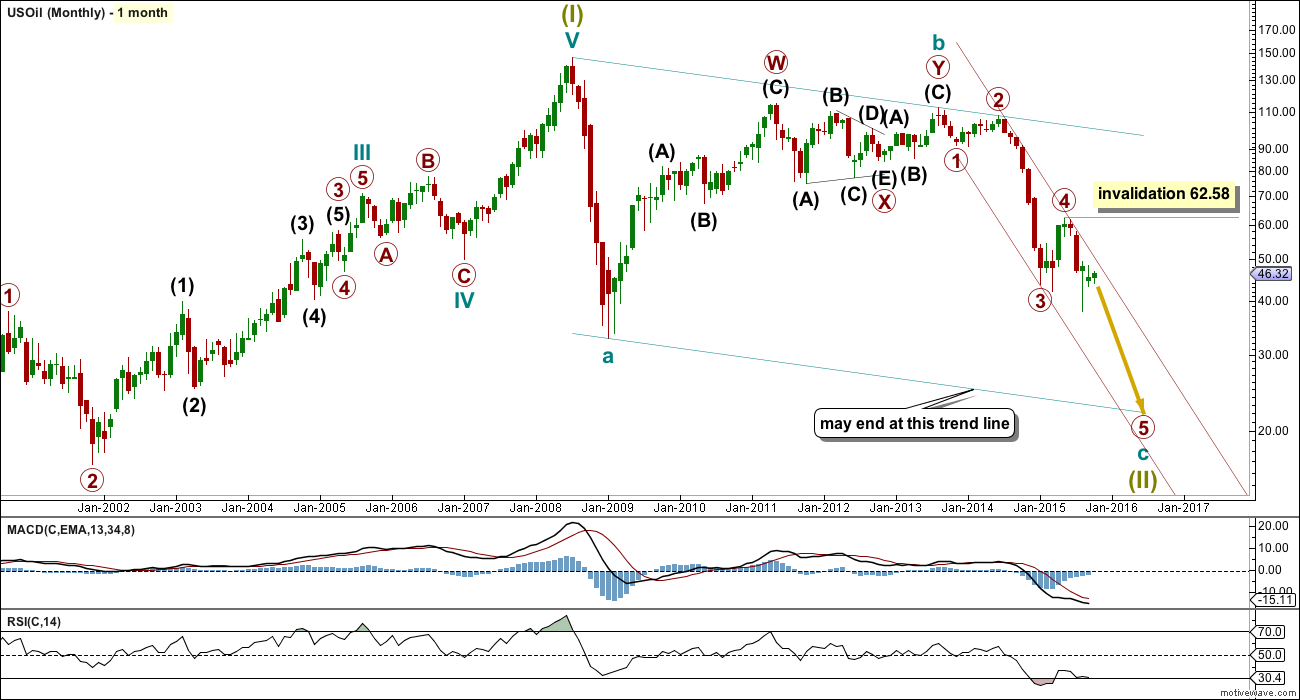
US Oil has been in a bear market since August 2013. While price remains below the upper edge of the maroon channel drawn here and below the 200 day simple moving average it must be accepted that the bear market most likely remains intact. I will not publish a bull wave count while this is the case and while there is no technical confirmation of a trend change from bear to bull.
The structure of cycle wave c is incomplete.
This wave count sees US Oil as within a big super cycle wave (II) zigzag. Cycle wave c is highly likely to move at least slightly below the end of cycle wave a at 32.70 to avoid a truncation. Cycle wave c may end when price touches the lower edge of the big teal channel about this zigzag.
It is just possible that cycle wave c could be complete at the last low of 37.75. However, that would see cycle wave c truncated by 5.05, which is a large truncation. I would consider this possibility only if it is confirmed with a clear breach of the maroon channel on the monthly chart.
Within cycle wave c, primary wave 5 is expected to be extended which is common for commodities.
Within primary wave 5, no second wave correction may move beyond its start above 62.58.
Draw a channel about this unfolding impulse downwards. Draw the first trend line from the highs labelled primary waves 2 and 4 then place a parallel copy on the end of primary wave 3. Next push up the upper trend line slightly to contain all of primary waves 3 and 4. Copy this channel over to the daily chart. The upper edge should provide resistance.
DAILY ELLIOTT WAVE COUNT
Click chart to enlarge.
The intermediate degree corrections were brief and shallow within primary wave 3 down. Now, within primary wave 5, this correction for intermediate wave (2) is neither brief nor shallow.
Minor wave B may have continued sideways and minute wave e of the triangle may have unfolded as a double.
At 51.14 minor wave C would reach 0.618 the length of minor wave A. This is close to the 0.618 Fibonacci ratio of intermediate wave (1) which is at 51.20.
Intermediate wave (2) is likely to find resistance at the upper edge of the maroon channel copied over from the monthly chart.
At 22.21 primary wave 5 would reach 0.618 the length of primary wave 3.
Intermediate wave (2) may not move beyond the start of intermediate wave (1) above 61.82.
Draw a channel about intermediate wave (2) using Elliott’s technique for a correction: draw the first trend line from the start of minor wave A to the end of minor wave B, then place a parallel copy on the end of minor wave A. Minor wave C may end midway within the channel. When the channel is clearly breached by subsequent downwards movement it shall provide trend channel confirmation that intermediate wave (2) may be over and intermediate wave (3) may have begun.
Once intermediate wave (2) is over, if price turns down as expected, then look for some support initially about the lower edge of the blue channel. If price breaks below support there, then look for a throwback to that trend line. If a throwback to the line ends at resistance, at the line, then the trend line strength is reinforced. When price behaves like that it provides a perfect opportunity to join a trend.
TECHNICAL ANALYSIS
Click chart to enlarge. Chart courtesy of StockCharts.com.
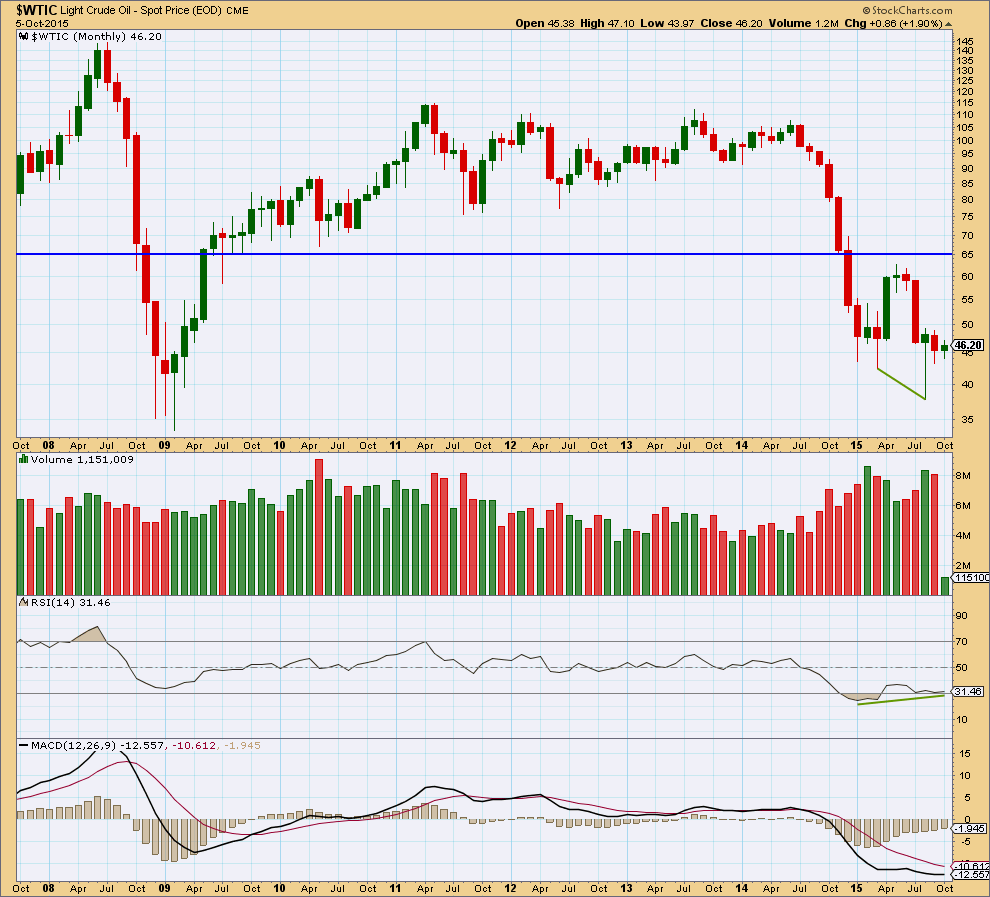
Monthly Chart: Price is finding resistance just below a prior area of support.
The last big fall in price was well supported by a rise in volume. Importantly, the rise in price over the two months to May this year was clearly not supported by volume. This indicates the trend remains down; a new bull market for US Oil is not indicated by volume.
There is some bullish divergence between RSI and price; as price made the last low RSI made a higher low. This indicates a waning trend but does not indicate exactly where the trend will end.
Click chart to enlarge. Chart courtesy of StockCharts.com.
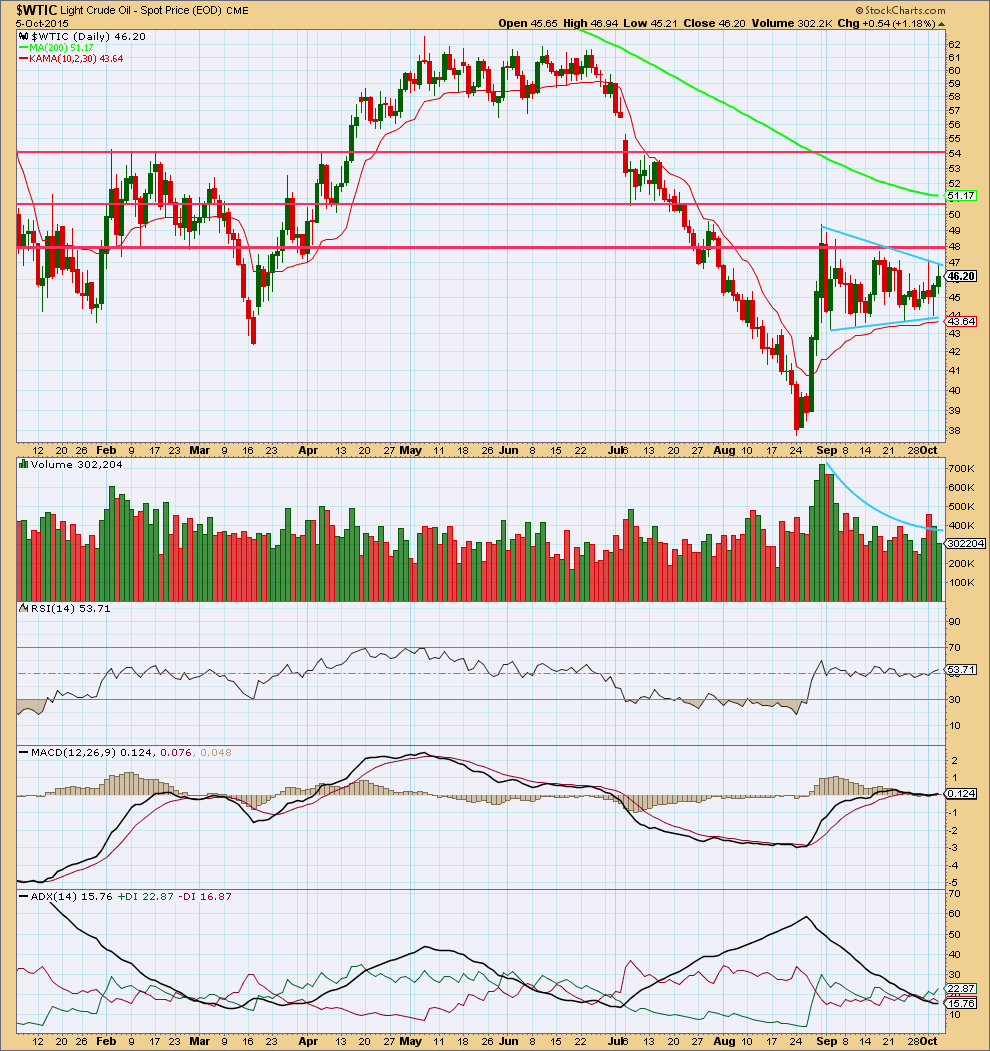
Daily Chart: Since 27th August the black ADX line has steadily pointed downwards indicating at first an expiring trend and now a consolidation. Price continues to drift sideways within the two sloping lines of support and resistance. During this consolidation, it is an upwards day which has strongest volume indicating an upwards breakout may be more likely. This is in opposition to the Elliott wave count, although that does expect some upwards movement.
Price is finding resistance about the horizontal trend line which previously provided some support. If price breaks above the first horizontal line of resistance, then it may find resistance at each subsequent line.
A breakout from this triangle would be indicated by a breach of either of the sloping blue trend lines, up or down, coming on a day with an increase in volume.
This analysis is published about 03:55 a.m. EST.
US oil is backtesting the BO line (red) at 46.72.
That will be place to add oil long.
Lara,
I have a question from your analysis: I don´t understand why you would expect oil to probably top at 51.14, where as you state “At 51.14 minor wave C would reach 0.618 the length of minor wave A. This is close to the 0.618 Fibonacci ratio of intermediate wave (1) which is at 51.20.”
Why to expect having wave c=0.618 wave a rather than to expect a=c? Thanks!
Lara, oil is behaving really nicely! It came really close to your target (30 cents) and then turned back.
Can we get your updated thoughts on oil this weekend?
At the moment FXCM has decided to take their data feed down.
Sunday NY time it should be back up. I’ll take a look then.
But I’m pretty sure my analysis will be that we cannot have any confidence whatsoever that this upwards wave is over until the channel which contains it is breached. The lower edge of that dark blue channel must be breached, and then look for a throwback. When price breaches trend lines and throws back to them it provides perfect entry points to join a trend.
Patience is required to wait for that channel to be breached. It’s a few days away at least.
The risk is that while price is still in the channel it could continue higher.
Lara
Is the correction over..??
Or else the target of 51.2 still intact..??
Only a break below the lower dark blue trend line (channel about intermediate (2) ) would confirm the correction is over. Todays downwards day could be a second wave within minor C.
This is not enough to confirm an end to intermediate (2). Not by a long shot.
Thnk u for reply
Oil Chart
Lara, thanks for your oil analysis.
Do you have any ideas about oil price targets and cycle wave timings after oil will reach the end of super cycle wave II ? Not for trading, just interested in your opinion. Thank you.
If primary wave 5 was equal in duration and length with primary 3 it would last a total 7 months, so end now in another two. But that doesn’t look to be long enough and the subdivisions within it are more time consuming.
If the whole thing ends in another 12 months from now it will total a Fiboancci 34 months. So that would be my expectation.
I mean what targets do you expect after “whole thing ends”?
Once super cycle (II) is complete then a super cycle (III) to new highs should begin. It may begin slowly, another first up and a second wave down.
It must move above the end of super cycle (I) to make a new high above 146.73, but that is years away!
I cannot calculate a target for super cycle (III) up until super cycle (II) is done, because I don’t know where it starts.
Lara great analysis of US oil.
Oil just BO above red line.
Where is the backtest point on your chart???? to enter long for 102 days trade?
It still has to go up to the target.
The lower dark blue trend line then has to be breached by downwards movement. If price finds some support there before breaking through then that is the line which should after its broken provide resistance.
That’s the backtest I would be waiting for.
And so the entry set up using that approach would still be maybe a couple of weeks away.
And the trade would be short, not long. For intermediate (3) within primary 5 down.
That is, if this works.
For a shorter term outlook I’m still expecting Oil to rise up to the target. I don’t think its done yet.
Thanks Lara. I just took good profit in UWTI.
Shhhhh!!!!!
Nicely done 🙂