Sideways movement to complete a small real body for Tuesday’s candlestick fits the Elliott wave count nicely.
Summary: This fourth wave correction may continue for at least another one day to last a total Fibonacci three days. Choppy overlapping sideways movement is expected as very likely. If it does not end in three days total, then the next Fibonacci numbers in the sequence of five and eight would be expected for the duration. Targets are either the 0.236 Fibonacci ratio at 1,108 or 0.382 Fibonacci ratio at 1,122. If it takes long enough, it may find resistance at the upper edge of the Elliott channel drawn on both daily and hourly charts.
To see weekly charts click here.
New updates to this analysis are in bold.
BEAR ELLIOTT WAVE COUNT
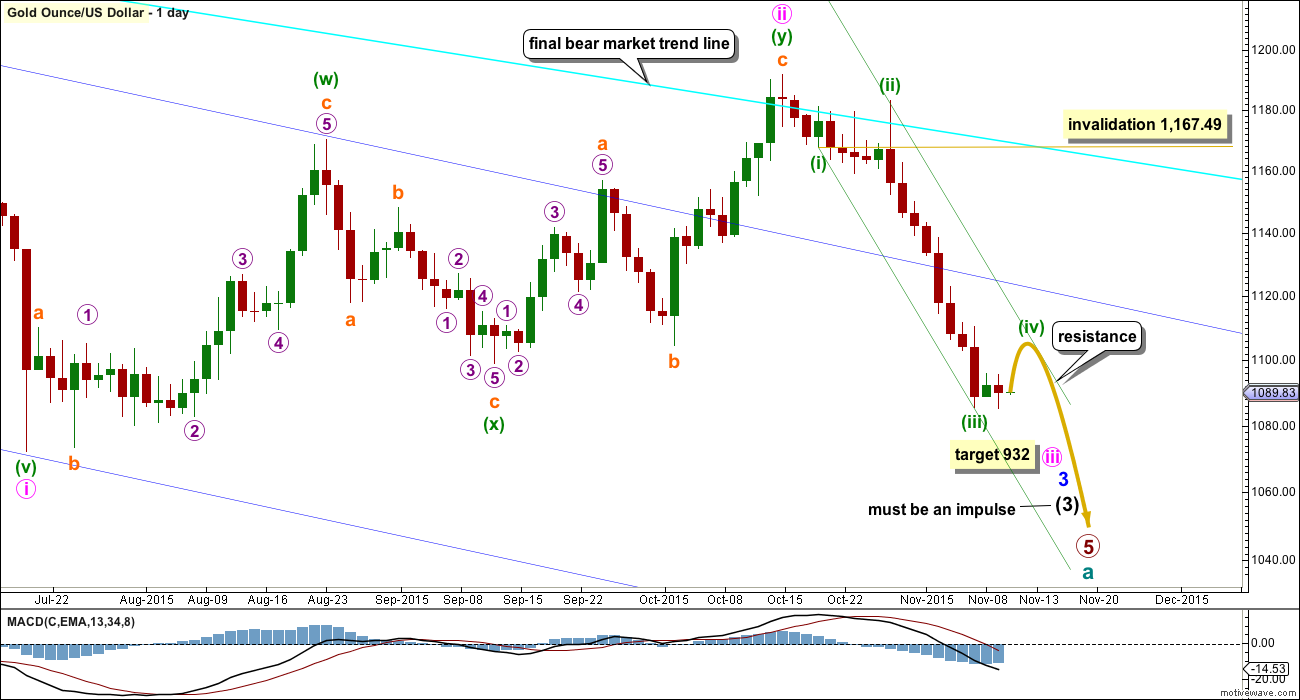
Gold has been in a bear market since September 2011. There has not yet been confirmation of a change from bear to bull. Price remains below the 200 day moving average and below the final bear market trend line (copied over from the weekly chart). The bear market should be expected to be intact until we have technical confirmation of a big trend change. At this stage, all bull wave counts have been invalidated. This is the only wave count left.
The final line of resistance (bright aqua blue line copied over from weekly charts) is only overshot and not so far properly breached. While this line is not breached the bear wave count will remain possible. Simple is best, and the simplest method to confirm a trend change is a trend line.
Minute wave ii is a complete double zigzag and deep at 0.75 the length of minute wave i. It has breached the dark blue base channel drawn about minor waves 1 and 2, one degree higher. When a lower degree second wave correction does this it reduces the probability of the wave count but does not invalidate it. Base channels most often work to show where following corrections find support or resistance, but not always.
At 932 minute wave iii would reach 1.618 the length of minute wave i.
Gold often exhibits swift strong fifth waves, particularly its fifth waves within its third waves. When price moves towards subminuette wave v of minuette wave (iii) it may be explosive. For this wave count look out for surprises to be to the downside.
At 1,080 minuette wave (iii) would reach 4.236 the length of minuette wave (i).
Draw a channel about this downwards movement using Elliott’s first technique: draw the first trend line from the end of minuette wave (i) to the last low which may be minuette wave (iii), then place a parallel copy on the high of minuette wave (ii). Minuette wave (iv) may find resistance at the upper edge of the channel.
Minuette wave (iv) may not move into minuette wave (i) price territory above 1,167.49.
FIRST HOURLY CHART
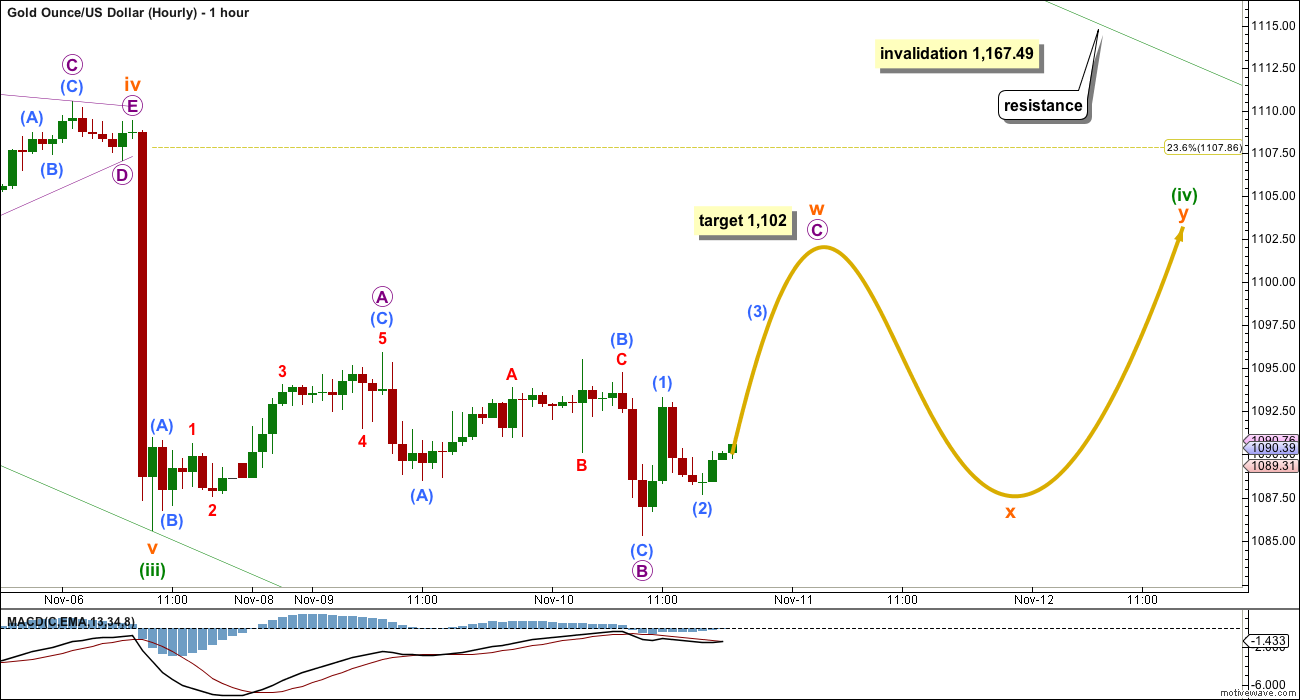
I have two hourly wave counts today. I will favour neither. At this stage, it is not possible to tell with certainty what structure minuette wave (iv) will complete as.
Minuette wave (ii) was a deep 0.65 expanded flat lasting six days. Minuette wave (iv) may be shallow, most likely ending at either the 0.236 or 0.382 Fibonacci ratios. It would most likely be a zigzag or triangle.
It may be quicker than minuette wave (ii) due to the strong downwards pull of minuette wave (v) to come, and may last most likely a Fibonacci three days and possibly (less likely) a Fibonacci five. It is also possible (but even less likely) that it may last a Fibonacci eight days.
This first hourly wave count expects minuette wave (iv) to be longer lasting, maybe a Fibonacci five or eight days in total. This chart looks at how a combination may unfold sideways.
The first structure in the combination may be a regular flat labelled subminuette wave w. At 1,102 micro wave C would reach 1.618 the length of micro wave A.
A three down for subminuette wave x may unfold when subminuette wave w is complete. It may make a new low below the price extreme of subminuette wave w. There is no downwards invalidation point for this wave count.
Thereafter, another corrective structure, most likely a zigzag, may unfold upwards to end about the same level as subminuette wave w so the whole structure moves sideways.
Minuette wave (iv) may not move into minuette wave (i) price territory above 1,167.49.
If minuette wave (iv) were to unfold as a flat correction, the expected pathway would be mostly the same as this chart depicts. I am not labelling that possibility though because it has the lowest probability; minuette wave (iv) is unlikely to be the same structure as minuette wave (ii).
SECOND HOURLY CHART
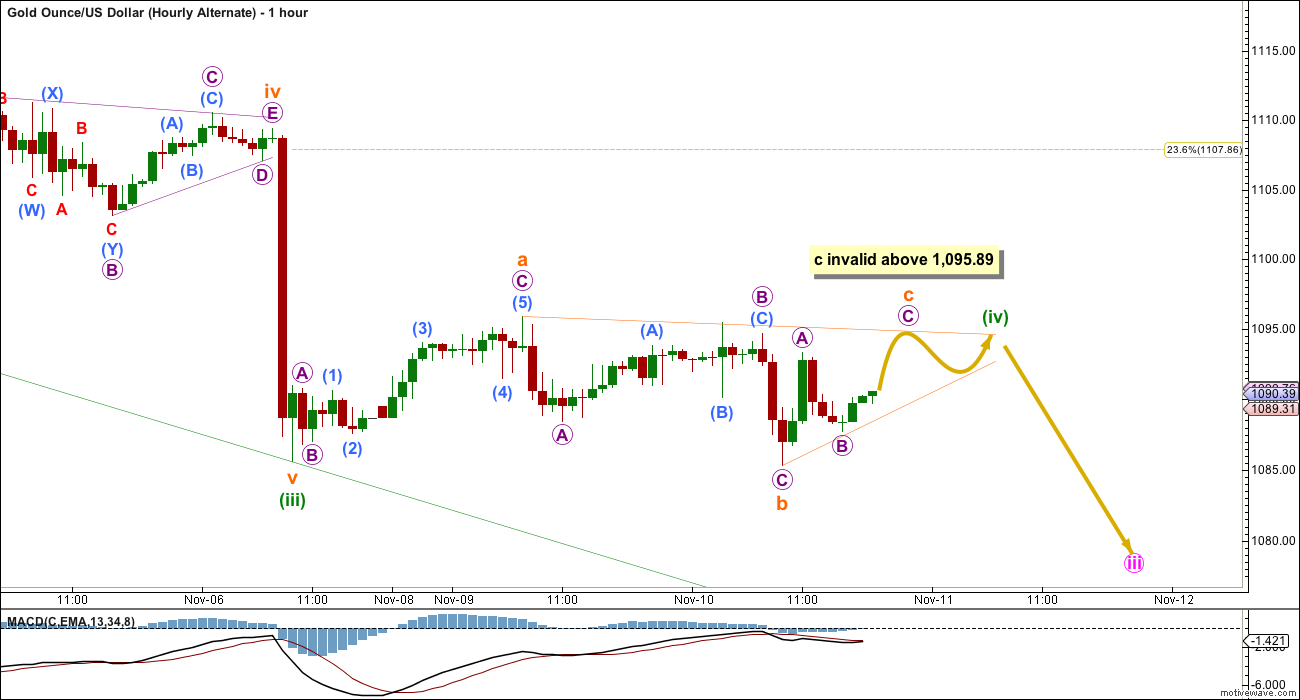
I expect this chart (although is labelled “alternate”) has a close to even probability with the first hourly chart. I will favour neither.
Minuette wave (iv) may be unfolding as a running contracting triangle. Within the triangle, subminuette wave c may not move beyond the end of subminuette wave a above 1,095.89.
This triangle may continue sideways in an ever decreasing range for another one or possibly even two days. At this stage, this idea sees minuette wave (iv) maybe coming to a swifter end than the first hourly wave count.
If price moves sideways and remains below 1,095.89, and if MACD hovers about the zero line, then this wave count would increase in probability.
Minuette wave (v) downwards is expected to show a strong increase in momentum beyond that seen so far. Expect surprises to be to the downside.
TECHNICAL ANALYSIS

Click chart to enlarge. Chart courtesy of StockCharts.com.
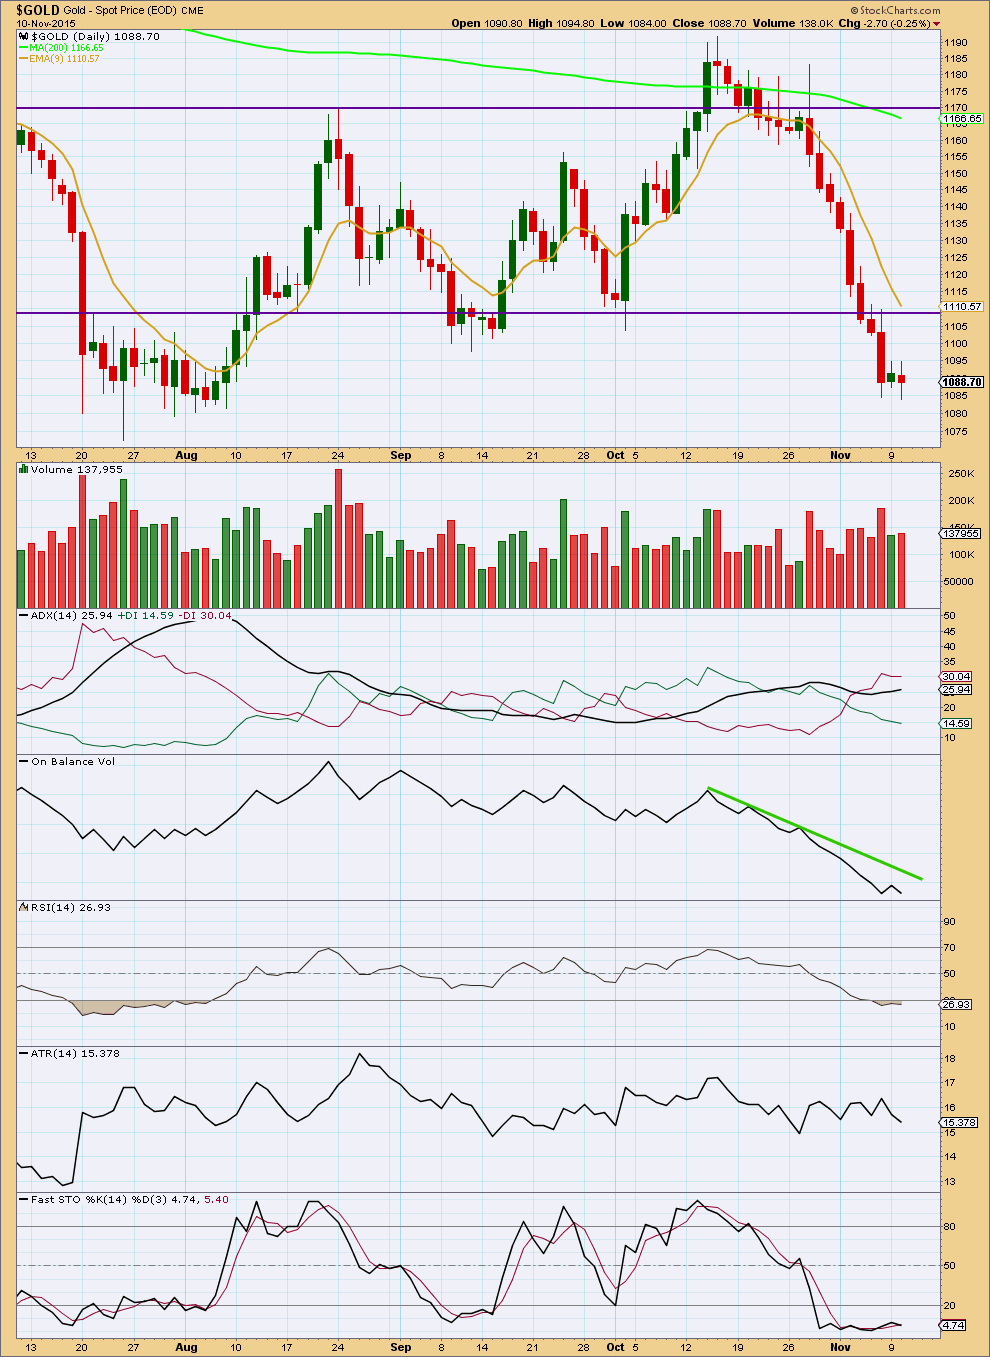
Daily: Volume is only slightly higher than the prior day which had relatively low volume. This looks corrective. The small real body with even upper and lower shadows for Tuesday’s candlestick also looks corrective. This fits the Elliott wave count.
ADX still indicates a downwards trend is in place. Today ATR is beginning to disagree. Price range is smaller. ATR has a new low short term.
If price manages to get up that high during this small correction, then it may find resistance at the lower horizontal trend line. Resistance should be found at the 9 day EMA prior to that though.
On Balance Volume may assist to indicate when the correction will end. If OBV comes up to touch the new green trend line, then at that time the correction may be complete. OBV should find resistance at that line.
This analysis is published about 07:30 p.m. EST.


….anywhere close to pivot is as good a place to go short on this as any, with minimal risk 1092-95….
I know that the slight new low today may have many guessing about whether or not this correction is over, maybe the fifth wave down has begun already.
But combinations and running triangles may include new price extremes, the B or X wave can move beyond the start of A or W to make a new low, and the correction is still unfolding.
I’m going to spend more time today to consider all possibilities, including and especially can I see a complete structure for minuette (iv). So far as per my comment below that’s problematic, but I’ll keep on looking for alternates.
I’ve tried to see if the triangle could be over and it won’t work. There is not a complete triangle in there which meets all EW rules.
I can see minuette (iv) as complete as a double zigzag, but the second zigzag doesn’t move beyond the end of the first, the whole thing is sideways which does not look at all like a double zigzag.
It could be complete as a quick shallow single zigzag. But that is followed by a three down not a five, indicating that it was not over at the first zigzag.
My conclusion at this stage has to be that minuette (iv) is incomplete. Maybe one more day.
It looks like it will be very shallow.
You might be able to get a clue from stochastics which is very oversold on the daily chart. Downward macd momentum is still strong although it has just started to slow down on the histogram. I’m inclined to think the correction is not over but it won’t be very deep with momentum as strong as it is. Providing no surprises from fundamental news.
I agree. Some upwards movement to resolve Stochastics oversold short term…
But for the next trend Stochastics will probably remain oversold for a while.
There’s some pretty strong divergence from MACD on the hourly chart with the last two lows and the end of minuette (iii)
Is it possible gold just finishing wave iii green?
US oil where the action is. EW works well.
The correction may now be over?
Wave D cannot go below Tuesday morning’s low.
Well it did at 12:48 am today’s low of 1,084.47 is another new low below Tuesday’s low of 1,085.41 9:30 am
Gold has continued to make a new low on a daily basis.
So much for any significant correction.
The market sentiment is very bearish gold.
Revised wave count tonight?
Any wave count?
I am not able to identify gold’s short term moves as of late – will leave that up to Lara.
Since gold isn’t tanking just yet, and is moving very slowly, it Is likely still consolidating (in one form or another) above the July low. Today’s volume should be rather thin, because of the US holiday, which may cause exaggerated movements.
long term move, this gold is going down. Obviously there will be a correction but the next move will be so powerful and swift that this correction everyone is expecting will be short lived and will probably disappoint a lot of people. Just my thoughts
Laura’s comment above agrees with you.
It is possible that the minuette iv triangle is over, and it is possible that minuette v is near its end (because fifth waves following a 4-th wave triangle can be small and quick), but it would take a lot of courage to bet that way. Lara’s comments before market close today will be very much appreciated.
The Hourly Alternate appears to me to be the wave count in play as the high since Tuesday close was only 1,094.27 at 1:37 am this morning perhaps to end Minuette wave (iv) and it didn’t go above it’s invalidation at 1,095.89.
I may be jumping the gun and it isn’t over yet as Lara said this triangle may continue sideways in an ever decreasing range for another one or possibly even two days.
Any and all comments or wave counts would be appreciated.
In the context of the hourly alternate, we could be late in wave D or early in wave E. Wave D cannot go below Tuesday morning’s low.
It just did go below Tuesday it just made a new low at 12:48 am 1,084.47.
The only way I can see a triangle now is to see it in wave C up.
The low for today would be wave B.
Richard
I did not ignore your ?? from yesterday on Bull Box.
——————————————————–
“Last week I discussed the step-sum bull box forming in the gold market, in which the price of gold either goes up or trends sideways as its step sum trends bearishly downward. A bull box is a bullish development in any market as its shows the price of something holding firm or actually advancing as market sentiment collapses. Take a look at the price of gold (Blue Plot) and its step sum (Red Plot) in the bull box below. Now compare what is happening these last few weeks with what happened in April and June 2013, when the price of gold collapsed as it hit two air pockets. At no time during 2013, or any time since August 2011, did the step sum (market sentiment) collapse as we see it doing now.”
http://www.investing.com/analysis/bull-box-in-the-gold-market-270619
Gold trading range 1085- 1095. Break on one of the side will set the trend.
Tuesday – Gold struggled to gain ground today but eventually gave up and sank about 0.4% in late trading. Silver and platinum shared gold’s fate, although they were dented to the tune of well more than 1.00% each.
On the promise of higher interest rates in December, the U.S. dollar hit seven-month highs against the euro.