
A new high above 1,095.89 confirmed the preferred alternate Elliott wave count.
Summary: A correction is most likely underway against the trend. It may continue for a minimum of three more days but more likely another six or twelve. The preferred target for it to end is at 1,118. A new low may be part of the correction. It may be choppy and overlapping.
New updates to this analysis are in bold.
MAIN ELLIOTT WAVE COUNT
Click chart to enlarge.
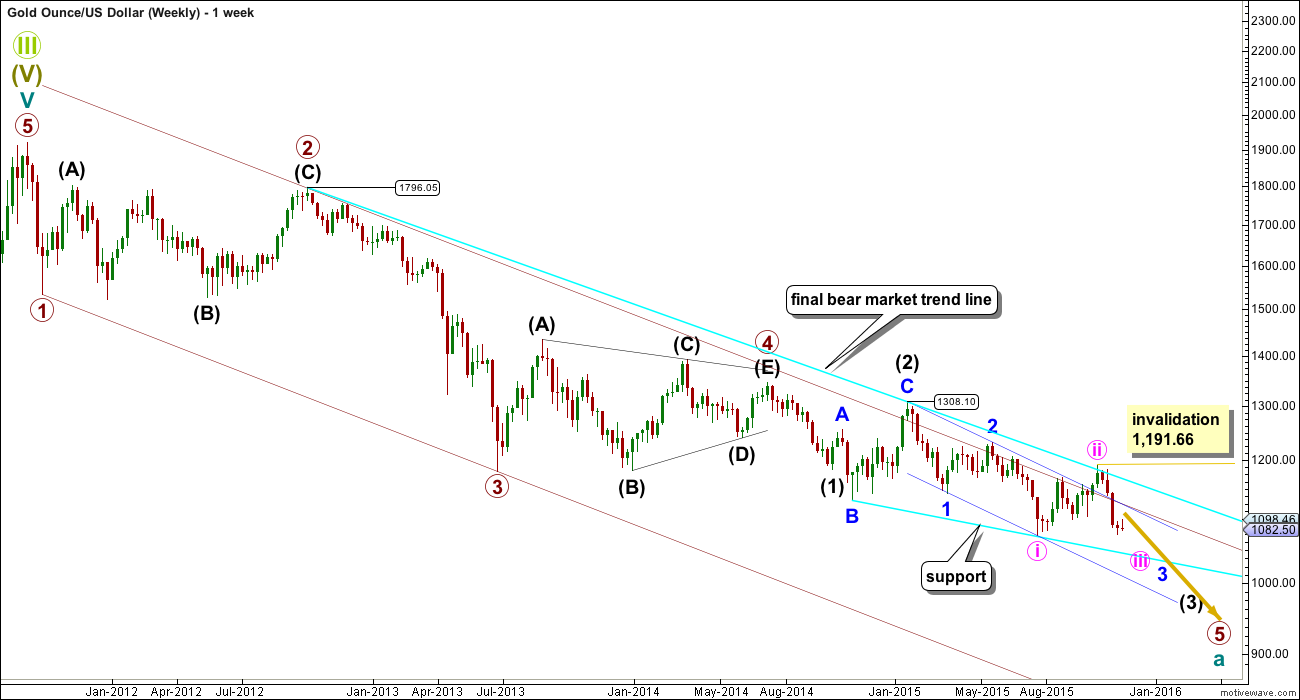
Gold has been in a bear market since September 2011. There has not yet been confirmation of a change from bear to bull, and so at this stage any bull wave count would be trying to pick a low which is not advised. Price remains below the 200 day moving average and below the blue trend line (copied over to the daily chart). The bear market should be expected to be intact until we have technical confirmation of a big trend change.
The maroon channel is drawn using Elliott’s technique about an impulse: draw the first trend line from the ends of primary waves 1 to 3, then place a parallel copy on the end of primary wave 2. The upper edge of this channel has been breached slightly twice during primary wave 5, which is a cause for concern and a reason to consider a possible bull wave count, but the breaches are not enough confirmation of a big trend change though.
A five wave impulse is unfolding lower from the all time high. The subdivisions all fit perfectly.
It is not possible to see primary wave 1 ending any earlier because it must be a five. Primary wave 2 was a deep 0.68 running flat lasting 53 weeks. Primary wave 3 was a perfect impulse and 12.54 short of 1.618 the length of primary wave 1. Primary wave 4 was a shallow 0.27 regular contracting triangle lasting 54 weeks. There is perfect alternation in depth and structure between primary waves 2 and 4. There is almost perfect proportion also, which gives the wave count a textbook perfect look at the weekly chart level. It is the proportion between the corrections of an impulse which give it the “right look”.
Within primary wave 5, there is some concern that intermediate wave (2), minor wave 2, and now minute wave ii are all much bigger and time consuming than these corrections at these degrees normally are. This is the second reason for considering a bull wave count.
If price moves above 1,191.66, then this bear wave count would be invalidated.
I am adding a lower trend line in cyan to this chart which may show where downwards movement finds support. Copy this trend line over to daily charts.
Click chart to enlarge.
The final line of resistance (cyan line copied over from weekly charts) is only overshot and not so far properly breached. While this line is not breached the bear wave count will remain possible. Simple is best, and the simplest method to confirm a trend change is a trend line.
Minute wave ii is a complete double zigzag and deep at 0.75 the length of minute wave i. It has breached the dark blue base channel drawn about minor waves 1 and 2, one degree higher. When a lower degree second wave correction does this it reduces the probability of the wave count but does not invalidate it. Base channels most often work to show where following corrections find support or resistance, but not always.
Draw a channel about this downwards movement using Elliott’s first technique: draw the first trend line from the end of minuette wave (i) to minuette wave (iii), then place a parallel copy on the high of minuette wave (ii).
Minuette wave (ii) should show up on the daily chart and may last a total Fibonacci five or eight days. It may be longer lasting, but at this early stage a quicker end should be expected. The middle of a big third wave is still approaching which may force corrections to be more brief and shallow than otherwise.
Minuette wave (ii) should first breach the orange channel containing minuette wave (i). If it ends at resistance at the dark blue line, it may reach only up to the 0.382 Fibonacci ratio of minuette wave (i) at 1,118. Final resistance would be at the final bear market trend line.
This may resolve RSI being oversold.
Click chart to enlarge.
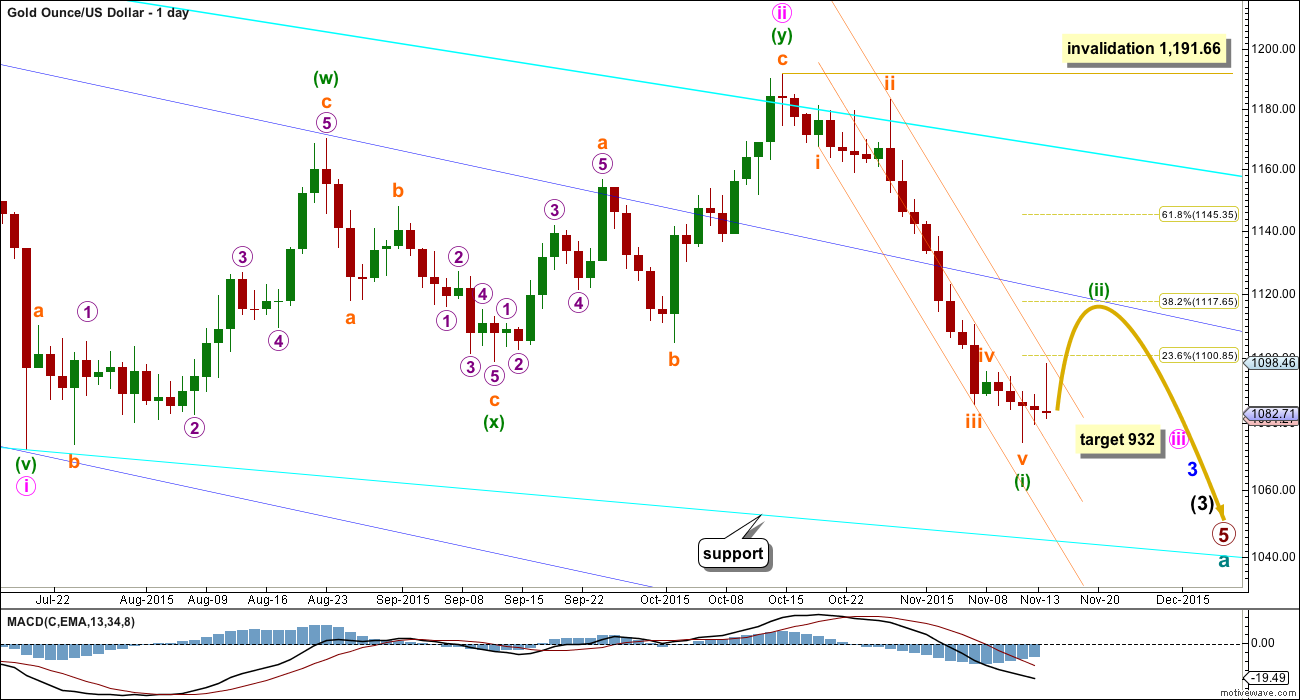
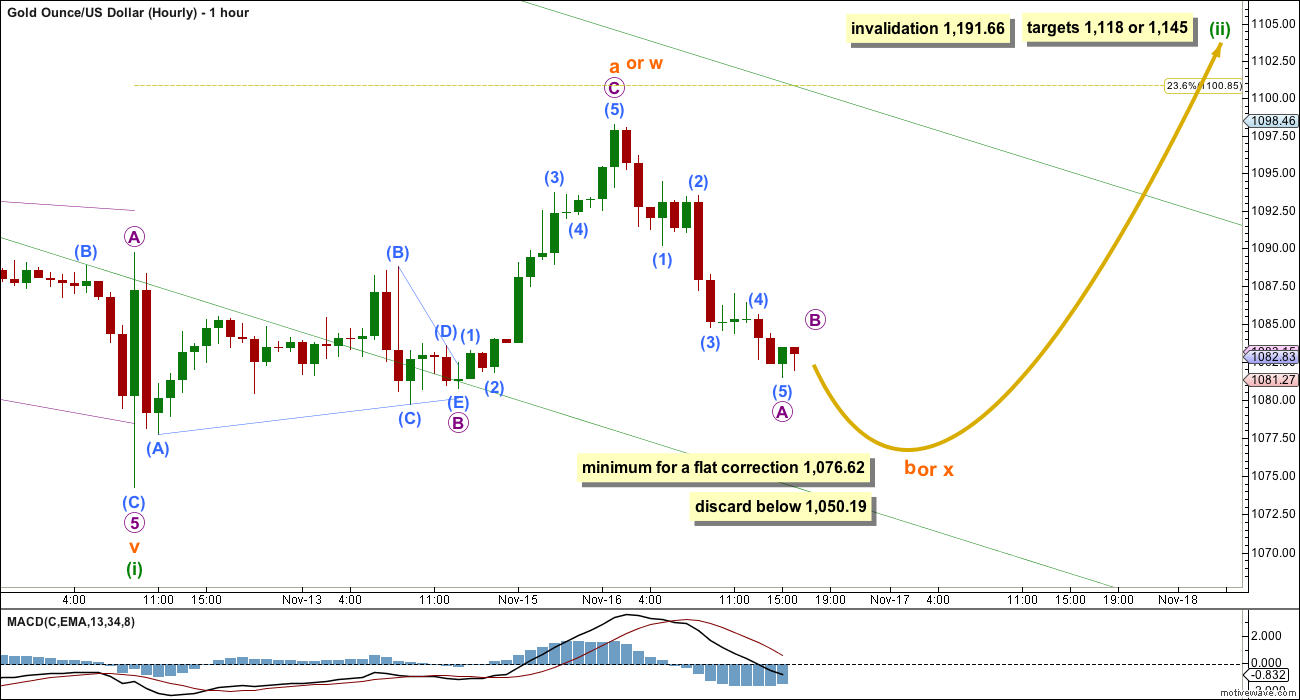
There are several possible structures that minuette wave (ii) may be unfolding as. It is also just technically possible that it is over as a very quick shallow zigzag, if the degree of labelling within subminuette wave a or w is moved up one degree.
Minuette wave (ii) may be unfolding as a flat correction. Within the flat correction, subminuette wave a subdivides as a completed three, a zigzag. Subminuette wave b of a flat must retrace a minimum 90% of subminuette wave a at 1,050.19. If minuette wave (ii) is an expanded flat (the most common type), then subminuette wave b must retrace a minimum 105% of subminuette wave a at 1,073.02. There is no rule stating a maximum limit for a B wave within a flat correction, but there is an Elliott wave convention which states it is unlikely to be longer than twice the length of the A wave. The idea of an expanded flat should be discarded below 1,050.19.
Minuette wave (ii) may be unfolding as a combination. The first structure would be a zigzag labelled subminuette wave w. The double combination may be joined by a three in the opposite direction labelled subminuette wave x, which is subdividing as a zigzag. The second structure in a double combination may be either a flat or a triangle. There is no minimum nor maximum requirement for subminuette wave x within a combination, but they are normally quite deep. Subminuette wave x may make a new low below the start of subminuette wave w at 1,074.22. A second structure in a double combination normally ends about the same level as the first, so that the whole structure has a sideways direction.
Minuette wave (ii) may be unfolding as a double zigzag. The first zigzag in the double would be complete now labelled subminuette wave w. The double would be joined by an incomplete three in the opposite direction labelled subminuette wave x which is unfolding as a zigzag. The second zigzag in a double normally moves comfortably beyond the end of the first, so that the whole structure has a clear direction against the trend one degree higher.
It is also just technically possible that minuette wave (ii) may be over as a very quick shallow zigzag. Only a new low below 1,050.19 and a clear five down on the hourly chart would be sufficient to see this idea taken seriously. If that happens, then expect to see a strong increase in downwards momentum.
ALTERNATE ELLIOTT WAVE COUNT
Click chart to enlarge.
I am aware that this is the wave count which EWI and Danerics have. The implications are important, so I will follow this wave count daily for members here too.
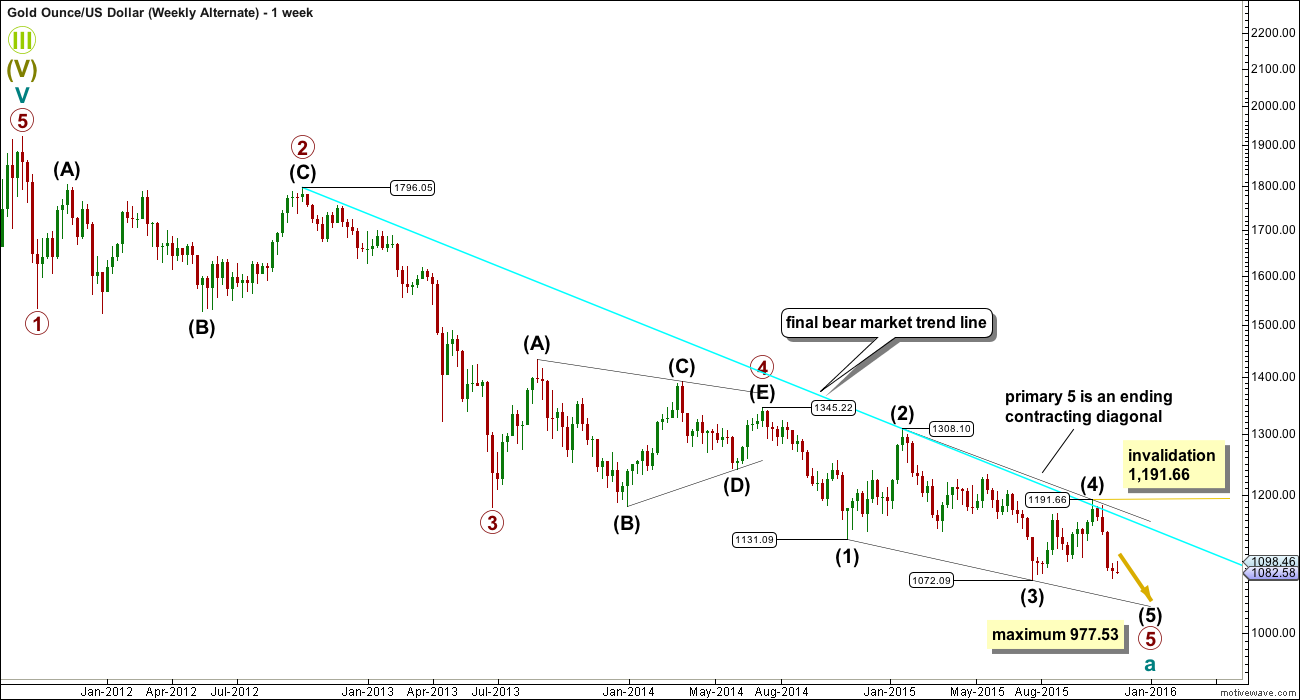
Everything is the same up to the end of the triangle for primary wave 4. Thereafter, primary wave 5 is seen as an ending contracting diagonal.
Within the ending contracting diagonal, it is not possible to see intermediate wave (2) as a zigzag and meet all Elliott wave rules. To see an explanation of why see this video at 10:25.
The same problem exists for the ending diagonal of primary wave 5 itself. Intermediate wave (3) is longer than intermediate wave (1) which would suggest an expanding diagonal, but intermediate wave (4) is shorter than intermediate wave (2) and the trend lines converge which suggests a contracting diagonal.
From “Elliott Wave Principle” by Frost and Prechter, 10th edition, page 88: “In the contracting variety, wave 3 is always shorter than wave 1, wave 4 is always shorter than wave 2, and wave 5 is always shorter than wave 3. In the expanding variety, wave 3 is always longer than wave 1, wave 4 is always longer than wave 2, and wave 5 is always longer than wave 3.”
This structure violates the rules for both a contracting and expanding variety. If the rules in Frost and Prechter are accepted, then this is an invalid wave count.
It may be that the rules need to be rewritten to add “sometimes a third wave may be the longest within a contracting or expanding diagonal”. But I have never seen Robert Prechter publish such a rule, I do not know that it exists.
I cannot reconcile this wave count from EWI with the rules in Frost and Prechter.
If an ending contracting diagonal is unfolding, then the (1) – (3) trend line may be overshot signalling the end of intermediate wave (5). If price behaves thus and turns around and moves strongly higher, then this wave count must be accepted and the rules for diagonals will need to be rewritten.
I will continue to follow this possibility as price moves lower.
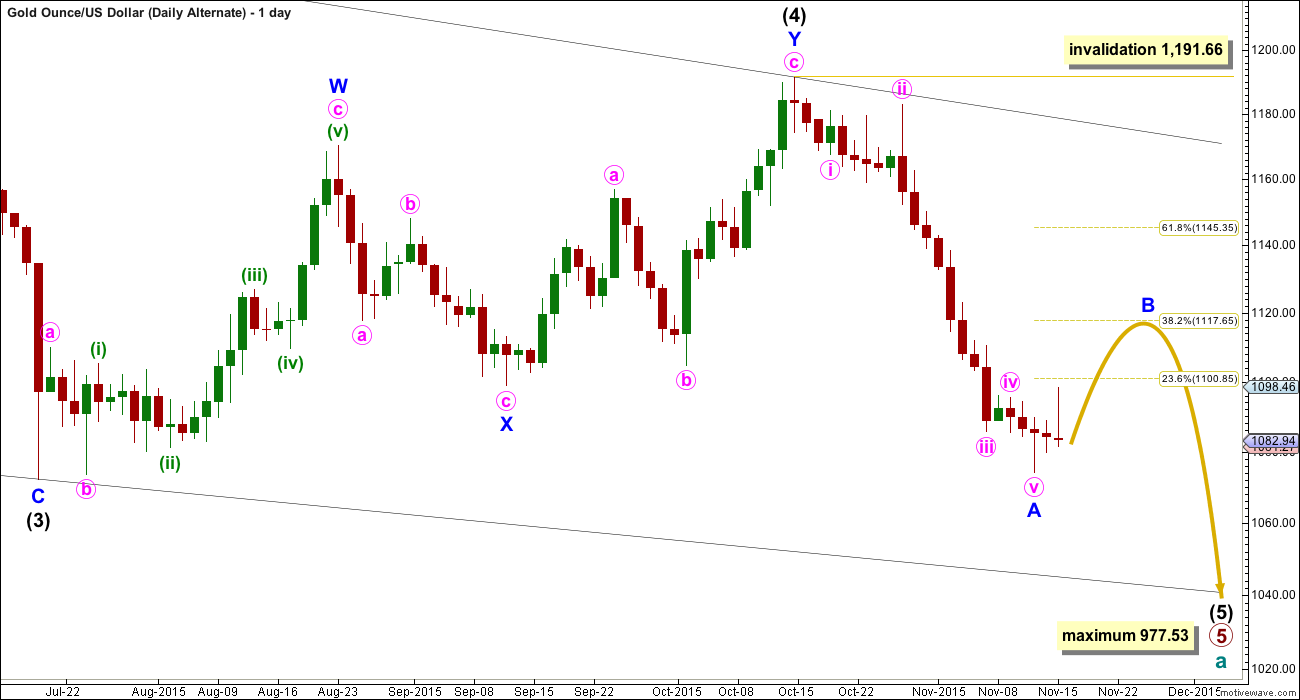
Click chart to enlarge.
Intermediate wave (5) should be shorter than intermediate wave (1). At 977.53 intermediate wave (5) would reach equality in length with intermediate wave (1). A new low below this point would take this possible diagonal structure too far from the rules. At that stage, it really should be finally discarded.
All sub waves within ending diagonals must subdivide as zigzags. Within the zigzag of intermediate wave (5), minor wave B should unfold over several days. At this stage, there is no divergence between this idea and the main Elliott wave count.
Minor wave B may not move beyond the start of minor wave A above 1,191.66.
TECHNICAL ANALYSIS
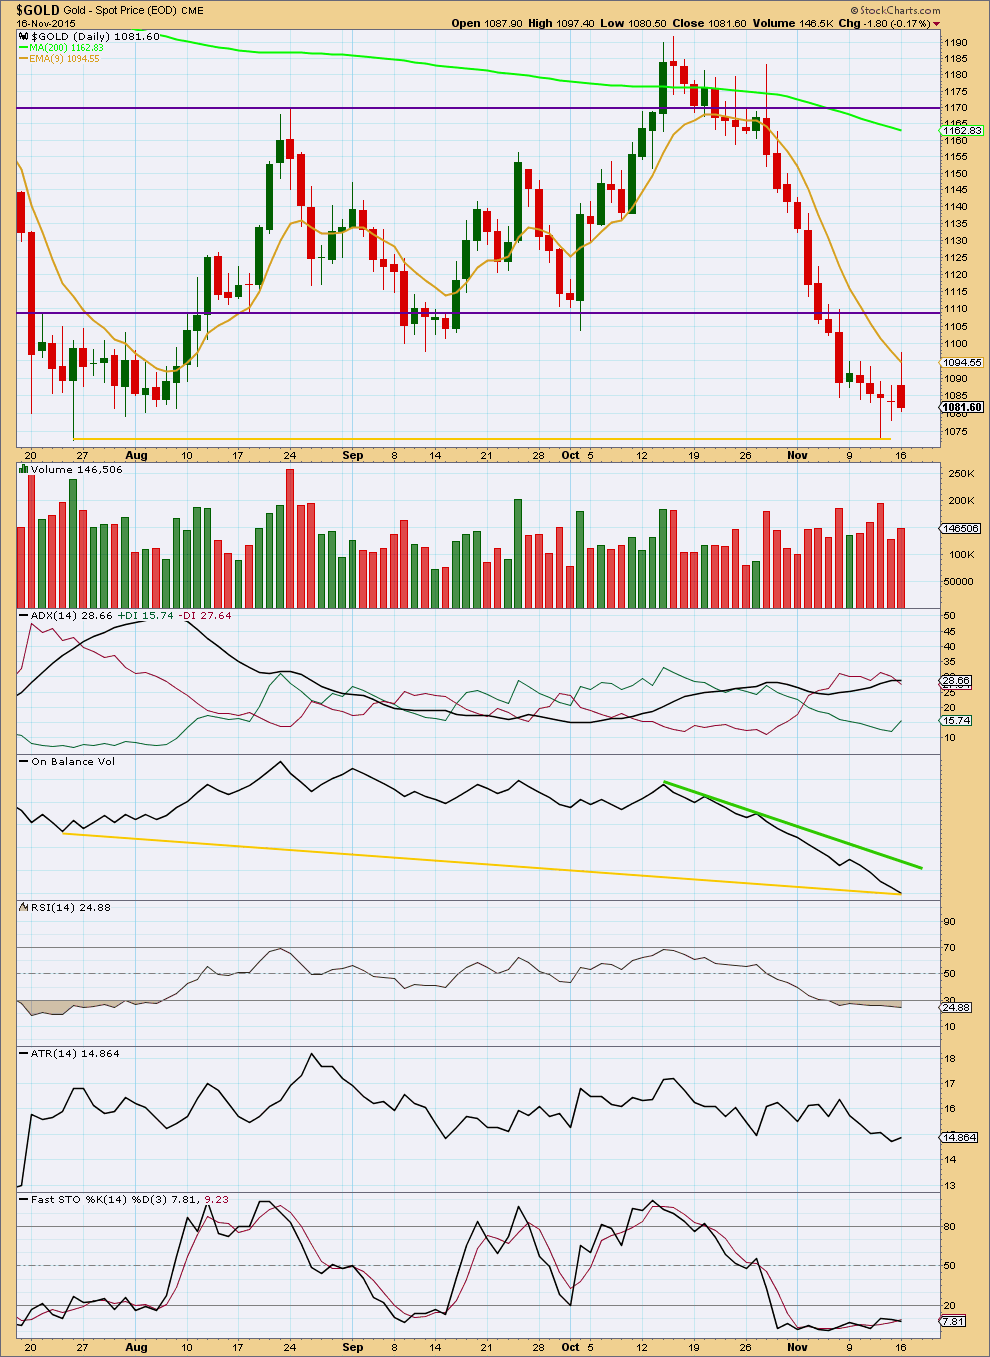
Click chart to enlarge. Chart courtesy of StockCharts.com.
Daily: A red candlestick with some increase in volume still supports the wave count. Overall, volume is lower than the downwards day to the last low. Lighter volume indicates a correction is unfolding.
ADX still indicates a downwards trend is in place. ATR disagrees, the range price is moving in is on average declining.
On Balance Volume still shows bullish divergence (yellow lines) with price. With RSI currently oversold, the alternate Elliott wave count is better supported by this regular technical analysis. Some upwards movement to resolve RSI may occur about here.
RSI is still oversold. An upwards day to complete a green candlestick is highly likely to resolve this.
This analysis is published about 06:47 p.m. EST.
IMPORTANT: the confidence point must be moved slightly to 1,077.44.
A new high above 1,077.44 would give confidence this correction continues and confidence in a C wave upwards. It should last two days to 1,101 – 1,104 or 1,128.
Looks like gdx is in the 5th wave on its way down to Lara’s target of 12.3-12.6.
Jdst just broke out of its flag and is on the way up!
Maybe gdx will finish its 5th wave in the morning?
Or will it finish it after fomc, and then a powerful reversal?
Come on Gold get moving up fast above $1,077.06 before the close so I can buy some GDX!!!
“So a new high above 1,077.06 would confirm that the downwards wave today is a three and is complete. At that stage I’d have a lot of confidence that minuette (ii) is continuing and I’d have confidence in the target.”
I was thinking of buying some GDX before the close as it may bounce up quite a lot since it is oversold. Lara even thinks gold may retrace to 1,128. However gold hasn’t yet gone above $1,077.06. “While price remains below 1,077.06 the outside possibility that minuette (ii) is actually over will remain. It still has a low probability.”
However the FMOC is Wednesday 2:00 pm and the minutes are released from the last meeting that started this $120 big 3 week drop in gold from $1,183.04 October 28th the last FOMC meeting. 14 out of 15 daily candlesticks have been red since then. Will seeing the details of the minutes get the market even more bearish on gold or to change to bullish because of a bullish EW count?
After further analysis I’m adjusting my target for this to end to 1,101 – 1,104.
The confidence point at 1,077.06 remains the same.
WEDNESDAY, NOV. 18
2 pm FOMC minutes
http://www.marketwatch.com/Economy-Politics/Calendars/Economic
Sould we By GDX????
Unless gold gets above $1,077.06 before the close I won’t buy GDX as that is the confirmation point that this down wave is over and have confidence that minuette (ii) is continuing and in the 1,128 target.
Lara’s clarity is exceptional.
What is most likely today is an expanded flat is unfolding. The B wave down has just ended and the C wave up should now begin.
B is 1.36 X A, nicely within normal range of up to 1.38.
C = 2.618 X A at 1,128. This is the target for minuette wave (ii) to end now. If the target is met in two days then minuette (ii) would last a total Fibonacci five days.
Within B downwards the structure is a zigzag. I’m shifting micro A and B. Micro A now has its low at 1,077.06. A new high above 1,077.06 may not be a fourth wave correction within a new impulse unfolding downwards because at that stage it would be in what would be its first wave price territory. So a new high above 1,077.06 would confirm that the downwards wave today is a three and is complete. At that stage I’d have a lot of confidence that minuette (ii) is continuing and I’d have confidence in the target.
While price remains below 1,077.06 the outside possibility that minuette (ii) is actually over will remain. It still has a low probability.
FOMC day tomorrow????
… looking to position sell between 1076-1080 (if a break above 1072-73 can occur) for take out 1065…. Upside risk 1094-95… Lets see if this works for me…~!
Just sold DUST 22.36. Now waiting to buy NUGT/JNUG. Once Lara’s update at 3 PM is posted..
Kimble Charting Solutions has gold following the Swiss Franc breakout or bounce of long term many years. Today for sure it is broken out. Anyone follow this thinking and tried EW on the CHFUSD?
I am trying to follow and learn. Seems like this has already been ruled out – but is there potential for a more complex flat up C?
C doesn’t work. It must be a five wave structure. You can’t fit an unfolding five up into movement from the last big swing low at 1,072. And now with a new low below that point today it cannot be a second wave correction within C, so C just won’t work.
The low of 1065.56 could be the end of wave B. It looks now like an expanded flat in the making. If so, wave C could target the 2.618 retrace.
Alan what is the target price of 2.168?
Thanks.
1,128
Gold Slumps to 5.5-Year Low as U.S. Dollar, Stock Markets Rally
Tuesday November 17, 2015 11:59 – By Jim Wyckoff, contributing to Kitco News
http://www.kitco.com/news/2015-11-17/Gold-Slumps-to-5-5-Year-Low-as-U-S-Dollar-Stock-Markets-Rally.html
Gold just dropped to make a new low of 1,066.60 at 11:50 am breaking below the previous low July 20th of 1,072.01
IMHO 1056-48 will also not be long to follow…
Things To Consider As We Near The End Of The 4+ Year Correction
By Avi Gilburt – EW Tuesday, 17 November 2015 – First published Sat Nov 14 for members
http://news.goldseek.com/GoldSeek/1447769040.php
I can see us heading down to make our final lows over the next several weeks, as long as these resistance levels are held. Avi Gilburt
Gold futures fall back to 2010 levels – Nov 17, 2015 11:06 a.m. ET
http://www.marketwatch.com/story/gold-edges-lower-as-global-stock-markets-climb-2015-11-17
Global stock markets climb, dulling interest in gold
Staying with Sell, no consideration for Buy with Gold price unlikely to get past 1083-84….
You sound bearish. Thanks for sharing.
Hi Richard: IMHO risk above 1083-84 is 1094-95 with 1097-98 on the outside…. A downside reversal pretty much occured the other day when Gold price hit a high of 1098 being 23.6% retrace of H 1183 / L 1073… Gold price would need to begin to coast above 1089 to target 1096-97/1105… Gold price coasting below 1080-81 pretty much opens up downside risk 1073-1065 range…. Playing for it lol….~! //// Daily RSI below 30 at 25 is a concern but I guess in a bearish situation RSI between 30-20 is not really oversold lol
Thank you for your insight Syed.
I believe that Micro wave B ended at on Monday at 8:50 pm at a high of 1,085.26.
Did Micro wave C for subminuette b or x just complete a 5 wave count and end at a low of 1,074.88 at 10:16 am today? I’d like to go bullish on gold when a 2nd wave comes back down and tests this low 1,074.88 and I see that it will hold?
Any other wave counts or comments?
I’m pushing micro wave B out to the next small high on the hourly chart at 1,083.6.
Now micro A has a better fit. The whole thing looks to be done now. A nice zigzag.
A new high above the end of micro wave A at 1,077.06 would confirm that this downwards wave is a three and is complete.
While price remains below that point there is the possibility that the second wave correction is over and was a very brief shallow zigzag, and this downwards day is the start of a strong third wave.
Lara’s analysis indicates gold may drop to a minimum of either 1,076.62 or 1074.22 or 1073.02 or 1,050.19 and discard hourly wave count below 1,050.19.
I did buy DUST at 3:59:58 at Monday’s close and sold 9:35:18 Tuesday for a quick 2.76% profit.
I sold too soon however got some profit. Now looking for another DUST intraday swing or else get into GDX or NUGT at a lower cost for a swing up to 1,118 area.
Did flat correction wave b complete at 1076.77?
How high will the wave c correction travel to???
Lara, thank you for adding the diagonal count. I do hope it is proven wrong, but in the meantime, we can now keep a close eye on it!
You’re welcome. At the weekly chart level it has the right look. It does certainly look like a diagonal is unfolding.
But it violates the rule.
So yeah, we need to keep an eye on this possibility.
Bullish gold cot??? Net commercial shorts drop big. Also commercial shorts drop by 36000+
As gold drops below 1075 in few days COT will be more favor for bounce to wave ii target.
11/13 Commercial shorts 316,069, Spec long: 167,232; Gold close:1082 (-36992) Net Shorts +69,352
11/06 Commercial shorts 352,992, Spec long: 190,149; Gold close:1089 (-36012) Net Shorts +123,381
10/30 Commercial shorts389,003, Spec long: 225,777; Gold close:1141 (-9641) Net Shorts +171,480
10/23 Commercial shorts398,644, Spec long: 233,132; Gold close:1164 (+42,854) Net Shorts +174952
Here’s the COT chart
Thanks Papudi and Dreamer. This info is good timing for me.
How do you use this info?