
Yesterday’s hourly chart expected some more downwards movement short term and warned a new low may be seen. This is what happened.
Summary: What looks most likely today is some upwards movement which may last about two days. The target is 1,101 – 1,104 in the first instance. If that first target is breached, the next target is 1,128. A new high above 1,077.44 would provide confidence in this expectation. The alternate hourly wave count allows for a slight new low before some upwards movement. A new low does not mean this correction is over. Only a new low below 1,050.19 would see the idea of price remaining in a correction discarded.
New updates to this analysis are in bold.
To see weekly charts and the difference between the two wave counts go here.
MAIN ELLIOTT WAVE COUNT
Click chart to enlarge.
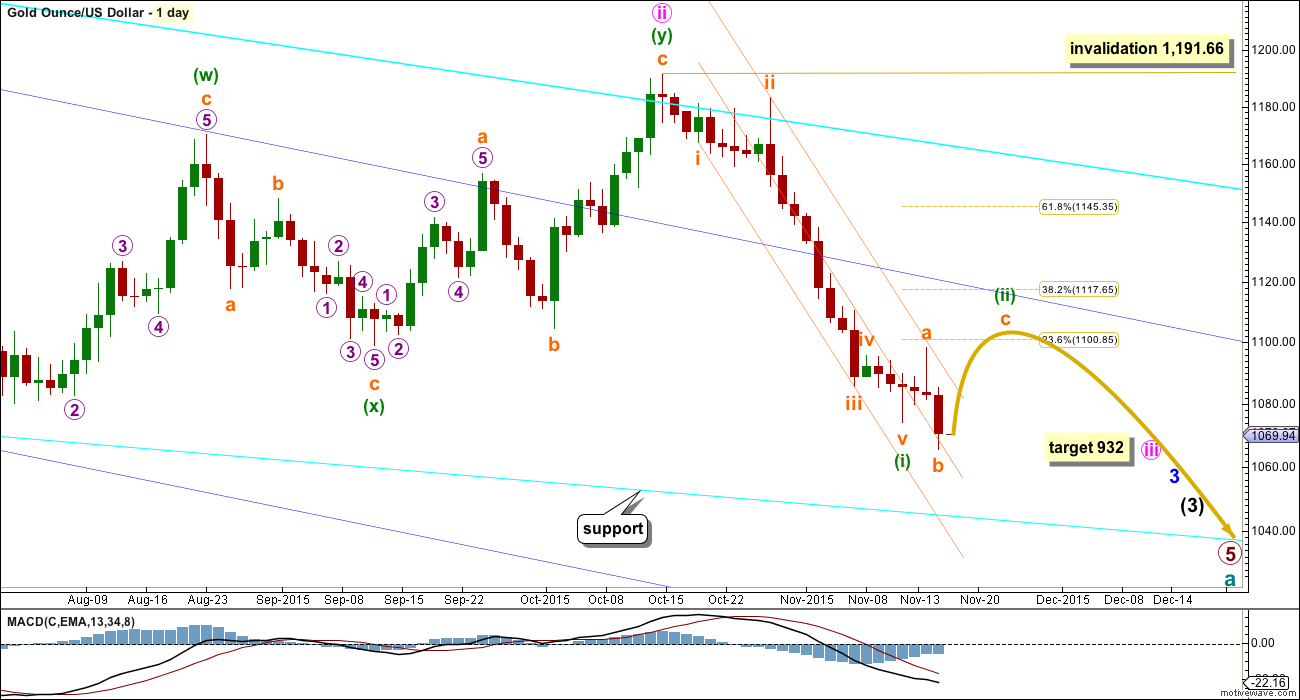
Gold has been in a bear market since September 2011. There has not yet been confirmation of a change from bear to bull, and so at this stage any bull wave count would be trying to pick a low which is not advised. Price remains below the 200 day moving average and below the blue trend line (copied over from the weekly chart). The bear market should be expected to be intact until we have technical confirmation of a big trend change.
The final line of resistance (cyan line copied over from weekly charts) is only overshot and not so far properly breached. While this line is not breached the bear wave count will remain possible. Simple is best, and the simplest method to confirm a trend change is a trend line.
Minute wave ii is a complete double zigzag and deep at 0.75 the length of minute wave i. It has breached the dark blue base channel drawn about minor waves 1 and 2, one degree higher. When a lower degree second wave correction does this it reduces the probability of the wave count but does not invalidate it. Base channels most often work to show where following corrections find support or resistance, but not always.
Draw a channel about this downwards movement using Elliott’s first technique: draw the first trend line from the end of minuette wave (i) to minuette wave (iii), then place a parallel copy on the high of minuette wave (ii).
Minuette wave (ii) should show up on the daily chart and may last a total Fibonacci five or eight days. It may be longer lasting, but at this early stage a quicker end should be expected. The middle of a big third wave is still approaching which may force corrections to be more brief and shallow than otherwise.
Minuette wave (ii) should first breach the orange channel containing minuette wave (i). If it ends at resistance at the dark blue line, it may reach only up to the 0.382 Fibonacci ratio of minuette wave (i) at 1,118. Final resistance would be at the final bear market trend line.
This may resolve RSI being oversold.
MAIN HOURLY WAVE COUNT
Click chart to enlarge.
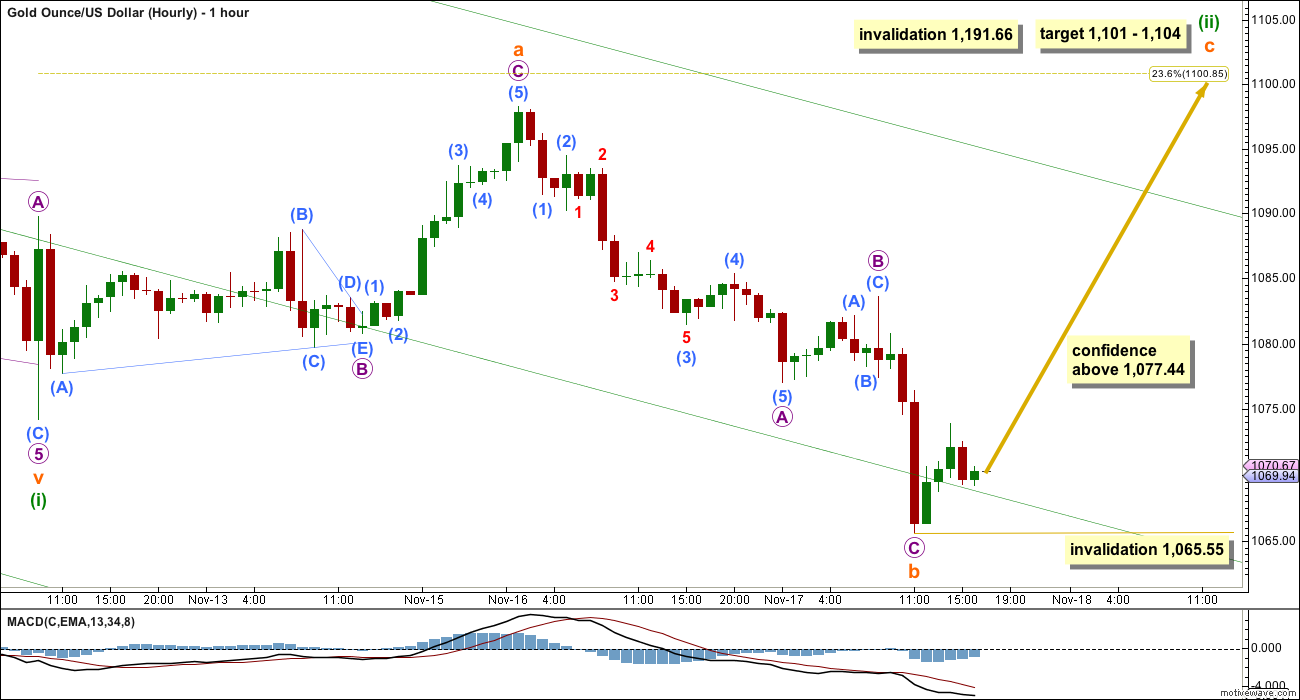
There are still several possible structures that minuette wave (ii) may be unfolding as. At this stage, an expanded flat looks most likely. Minuette wave (ii) may be a combination, but that looks much less likely because X waves in combinations aren’t normally this deep.
Subminuette wave b is 1.36 times the length of subminuette wave a within the expanded flat. This is within the most common range of 1 to 1.38.
It is very likely that subminuette wave c will make at least a slight new high above the end of subminuette wave a at 1,098.25 to avoid a truncation and a very rare running flat.
At 1,104 subminuette wave c would reach 1.618 the length of subminuette wave a. This is close to the 0.236 Fibonacci ratio at 1,101 giving a $3 target zone with a reasonable probability.
If upwards movement continues through the first target, or if when price gets there the structure of subminuette wave c is incomplete, then a second target would be at 1,128 where subminuette wave c would reach 2.618 the length of subminuette wave a.
At this stage, subminuette wave b is very likely to be over, but this is unconfirmed. A new high above 1,077.44 would invalidate the alternate hourly wave count below and provide confidence in this main wave count.
If subminuette wave c has begun, then within it no second wave correction may move beyond the start of a first wave within it below 1,065.55.
ALTERNATE HOURLY WAVE COUNT
Click chart to enlarge.
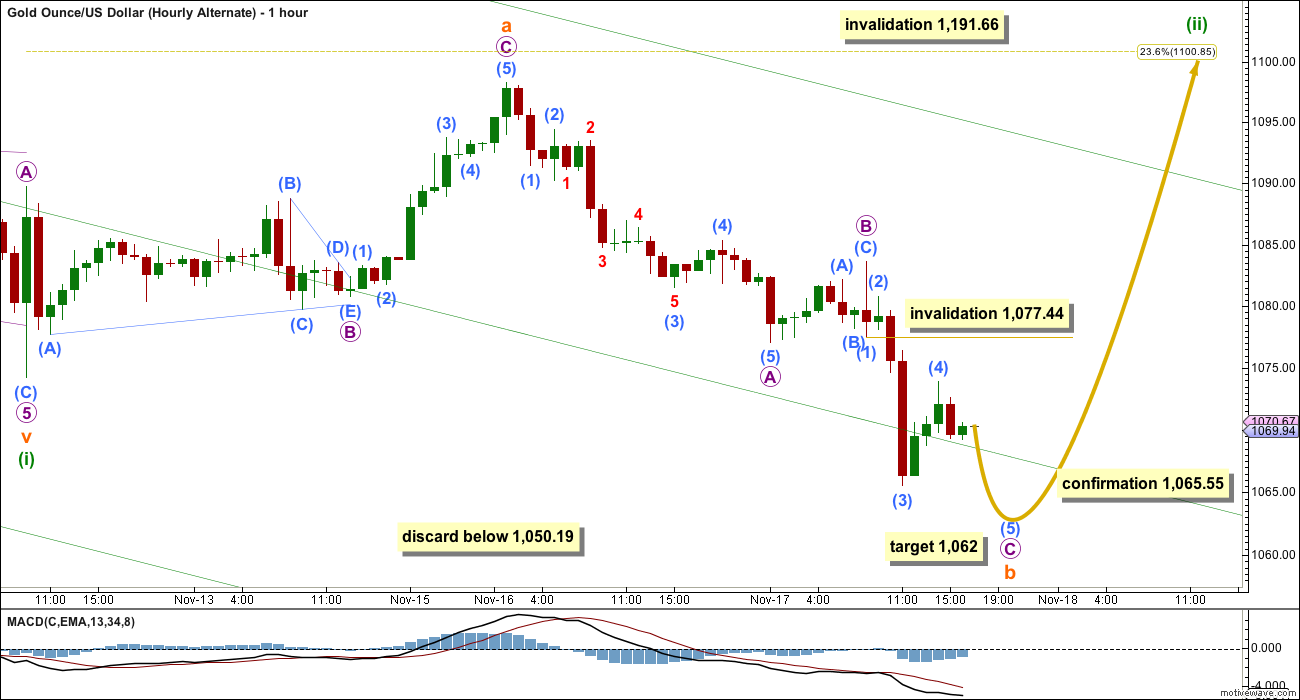
This hourly wave count is identical to the main hourly wave count up to the end of micro wave B within subminuette wave b. Thereafter, it sees micro wave C slightly differently.
If upwards movement at the end of Tuesday’s session is a fourth wave correction within micro wave C, then we may yet see a slight new low before subminuette wave c upwards begins.
Within micro wave C, submicro wave (4) may not move into submicro wave (1) price territory above 1,077.44.
At 1,062 micro wave C would reach equality in length with micro wave A.
At this stage, this alternate idea looks like it has a lower probability than the main hourly wave count due to the duration of submicro wave (4). Gold’s fourth waves are normally quicker than that.
If downwards movement continues, then only below 1,050.19 should the idea of a correction continuing be discarded. Subminuette wave b would reach twice the length of subminuette wave a at that stage. Although there is no Elliott wave rule which limits the length of a B wave within a flat correction, there is a convention that states when the B wave is twice the length of the A wave the probability that a flat is unfolding is so low the idea should be discarded.
A target may be calculated for subminuette wave c upwards when subminuette wave b is complete.
ALTERNATE ELLIOTT WAVE COUNT
Click chart to enlarge.
I am aware that this is the wave count which EWI and Danerics have. The implications are important, so I will follow this wave count daily for members here too.
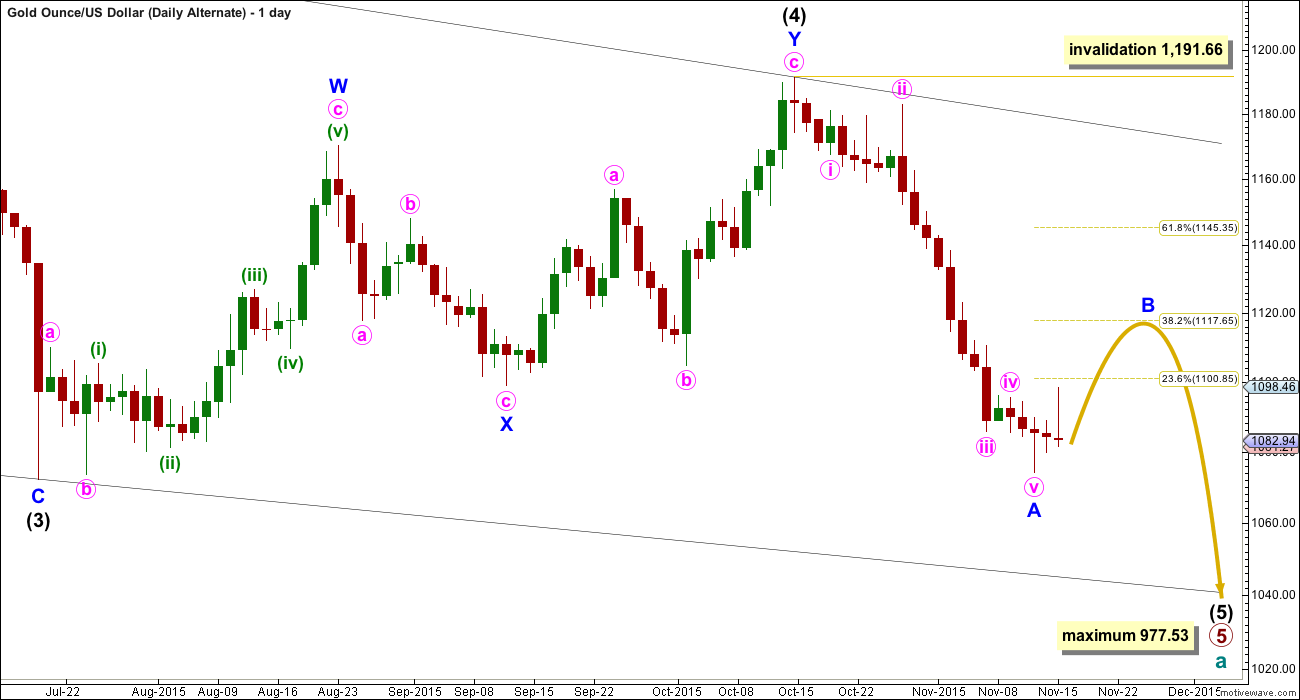
Everything is the same up to the end of the triangle for primary wave 4. Thereafter, primary wave 5 is seen as an ending contracting diagonal.
Within the ending contracting diagonal, it is not possible to see intermediate wave (2) as a zigzag and meet all Elliott wave rules. To see an explanation of why see this video at 10:25.
The same problem exists for the ending diagonal of primary wave 5 itself. Intermediate wave (3) is longer than intermediate wave (1) which would suggest an expanding diagonal, but intermediate wave (4) is shorter than intermediate wave (2) and the trend lines converge which suggests a contracting diagonal.
From “Elliott Wave Principle” by Frost and Prechter, 10th edition, page 88: “In the contracting variety, wave 3 is always shorter than wave 1, wave 4 is always shorter than wave 2, and wave 5 is always shorter than wave 3. In the expanding variety, wave 3 is always longer than wave 1, wave 4 is always longer than wave 2, and wave 5 is always longer than wave 3.”
This structure violates the rules for both a contracting and expanding variety. If the rules in Frost and Prechter are accepted, then this is an invalid wave count.
It may be that the rules need to be rewritten to add “sometimes a third wave may be the longest within a contracting or expanding diagonal”. But I have never seen Robert Prechter publish such a rule, I do not know that it exists.
I cannot reconcile this wave count from EWI with the rules in Frost and Prechter.
If an ending contracting diagonal is unfolding, then the (1) – (3) trend line may be overshot signalling the end of intermediate wave (5). If price behaves thus and turns around and moves strongly higher, then this wave count must be accepted and the rules for diagonals will need to be rewritten.
I will continue to follow this possibility as price moves lower.
Intermediate wave (5) should be shorter than intermediate wave (1). At 977.53 intermediate wave (5) would reach equality in length with intermediate wave (1). A new low below this point would take this possible diagonal structure too far from the rules. At that stage, it really should be finally discarded.
All sub waves within ending diagonals must subdivide as zigzags. Within the zigzag of intermediate wave (5), minor wave B should unfold over several days. At this stage, there is no divergence between this idea and the main Elliott wave count.
Minor wave B may not move beyond the start of minor wave A above 1,191.66.
I am uncomfortable with publishing this wave count and I only do so because it has been published by Elliott Wave International. I am not comfortable with publishing any wave count which violates the rules in Frost and Prechter. However, when looking at primary wave 5 on the weekly chart it does look like a diagonal is unfolding.
Short to mid term there is no divergence in expected direction between this wave count and the main wave count.
TECHNICAL ANALYSIS
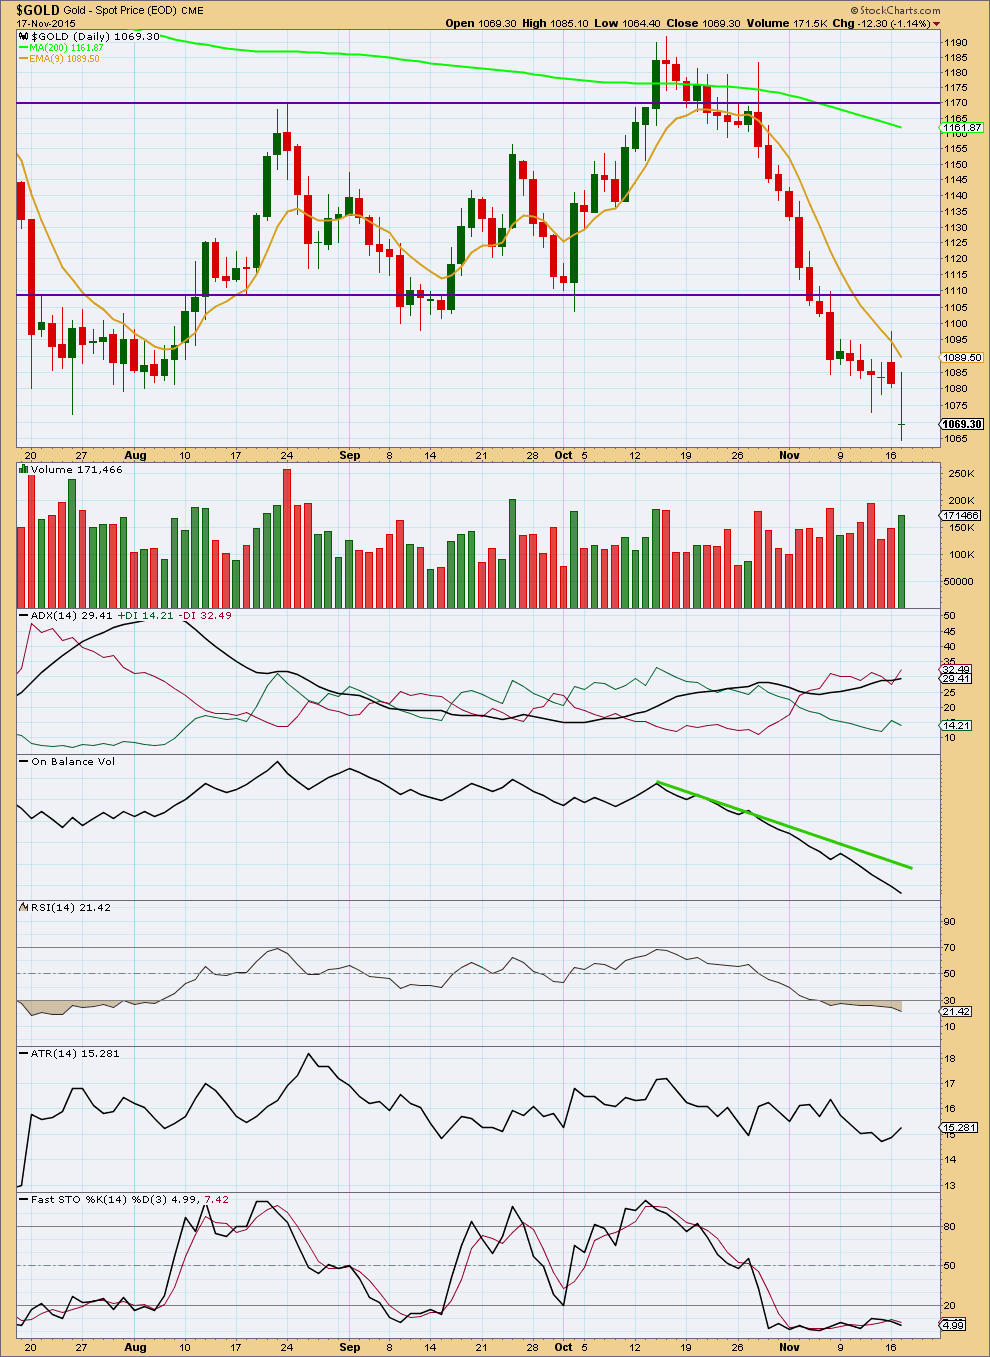
Click chart to enlarge. Chart courtesy of StockCharts.com.
This regular technical analysis has been updated at 1:37 a.m. EST 18th November.
Daily: StockCharts data is finalised with a green long legged doji for Tuesday’s session. As the market is oversold, this doji could on its own be considered a reasonably strong reversal indicator. However, several recent candlesticks also contain small real bodies and another doji reducing the potency of this doji as a reversal indicator.
Volume is slightly higher for Tuesday’s session. This may be interpreted as some small weight to expecting some more upwards movement from here as there is some support for upwards movement.
ADX still indicates the market is in a downwards trend. On Balance Volume remains bearish.
This analysis is published about 06:39 p.m. EST.
Webinar – starts at 5:00 – 6:00 pm EST Wednesday
Avi Gilburt – EW – Interviews Doug Eberhardt
Perspective Of The Metals Market From The Eyes Of A Metals Dealer:
EWT founder Avi Gilburt interviews Doug Eberhardt, wholesaler of physical gold and silver bullion and author of the book, “Buy Gold and Silver Safely.” Gain a fresh perspective on the precious metals market in this 1-hour live Q&A, in which attendees are also invited to share their questions.
https://attendee.gotowebinar.com/register/3632582279484154626
The fastest news site.
Some are just headlines without articles.
http://www.marketwatch.com/newsviewer
A new high above 1,073.88 then confidence in target of 1,103 – 1,101.
A new Gold low below 1,064.02 gold may be continuing down.
A new low below 1,050.19 the idea of a correction continuing up should be discarded.
Is >1077 still valid marker for 1128 target?
NO that was from analysis chart. I’d say forget about both of those amounts.
Lara added a comment and updated chart below.
Lara November 18, 2015 at 12:14 am
This is the updated hourly alternate.
If Gold makes another new low (below 1,064.02) sub micro (5) could be continuing….
A new high above 1,073.88 may not be a second wave correction within sub micro (5), so at that stage sub micro (5) would have to be over. I’d then have confidence in this wave count and confidence in the target.
At 1,103 subminuette c would reach 1.618 the length of subminuette a. This is close to the 0.236 Fibonacci ratio at 1,101.
Dollar rises after Fed’s Lockhart says rate-hike criteria has been met -Nov 18 9:43am
Minutes from Fed’s October meeting due at 2 p.m. EST Wed.
http://www.marketwatch.com/story/us-dollar-mostly-keeps-its-strength-with-fed-minutes-in-focus-2015-11-18
Hi Richard: Do you see any reason why Gold price has not been able to drive through 1072-73 as yet?
Yes blame it on the FED.
DUSTY day today so far today.
However I think an Elliott 5 wave cycle down may be finishing soon and may turn up?
Without that confidence above 1073.88 I am thinking the gold bearishness from the last FED meeting October 28th may continue. It looks that way so far today.
Some FED Governors today talking suggesting an interest rate hike in December which is bearish gold.
Richard: Many thanks. I guess the markets may be waiting for the release of FOMC minutes. //// No interest in Buy, staying with sell…. 🙂
Imo it is possible to see the correction as a completed running flat as of 5 am NY time. It is also still possible that price can go higher and convert that into an expanded flat.
No. The C wave would be massively unreasonably truncated. It does not even end within the territory of the A wave.
PM annihilation has begun!!!
Phase III Annihilation
http://goldtadise.com/?p=356116
Papudi, great charts thank you.
Yesterday’s candle on stockchart chart is gravestone doji. A reversal pattern for short term. Till crazy FOMC time today!!!
No, a gravestone doji has no lower shadow. That candlestick has a lower shadow.
Its closer to a long legged doji, or Rickshaw Man.
And the other special one is a dragonfly doji, that has no upper shadow.
Pics on pg 156 of “Japanese Candlestick Charting Techniques” by Nison.
Here are the real facts about supply and demand for Gold.
https://monetary-metals.com/little-change-to-supply-and-demand-report-25-oct-2015/
This is the updated hourly alternate.
If Gold makes another new low sub micro (5) could be continuing…. but its going to start to look strange at that stage.
A new high above 1,073.88 may not be a second wave correction within sub micro (5), so at that stage sub micro (5) would have to be over. I’d then have confidence in this wave count and confidence in the target.
At 1,103 subminuette c would reach 1.618 the length of subminuette a. This is close to the 0.236 Fibonacci ratio at 1,101.
Thanks a lot Lara. Great timing.
Richard
The new update means wave C will end at 1103????
So before 2 pm if gold goes to 1103 short it and expect gold to go down after 2 pm???
Lara was thinking 2 days to 1101 if confidence above 1073.88 so hitting that 1101 before FOMC won’t happen as the market will begin big moves at 2:00 pm EST when FED minutes released.
Gold has moved from the technical indicator tops to the bottom in the last 3 – 4 weeks so I think that IF gold moves down at 2 pm then it may be fast then bounce. Remember that gold can change directions overnight after FOMC news as the world market gets a 2nd opinion of the news so a 3XETF is not a sure thing overnight tonight.
http://stockcharts.com/freecharts/gallery.html?$GOLD
Its going to take longer than originally expected.
So far its been 4 days. I don’t think it can complete in a Fibonacci 5.
So the next number would be 8. After that 13.
So now another 4 days to total a Fibonacci 8 looks about right.
The Main Hourly wave count has been invalidated at 10:12 pm when gold went below the 1,065.55 invalidation point and down to 1,064.76.
The Alternate Hourly wave count target is first down to 1,162 then up to 1,100.85 area. A more precise target may be calculated for subminuette wave c upwards when subminuette wave b is complete.
In case you were unaware, the FOMC minutes from the Oct meeting will be published tomorrow at 2pm EST. Could cause a whipsaw.
Can you believe we are only $90 from the $977 target? How many years have we been waiting for this….
MTLSD it’s been way too long.
The Target of 977 is only on the alternate daily chart.
The main daily chart doesn’t have the final bottom target yet and that may be weeks or months.
Lara about a week ago gave 19 weeks plus minus 3 weeks for the main daily bottom.
The alternate daily wave count that bottoms at 977.53 would be invalidated if gold goes below that. Lara prefers the main daily chart.
Just think this way if gold has gone up 900 up in last four years we would have made ton of money. I certainly would have made four times the portfolio.
But bear market in gold is worst grinding down.
Bear market in general market is quick and swift. Sheesh!!!!
Hoping for this to end so I can go back to 19 bagers stocks.
Lara: At 8:10PM EST God chart for today is same from Stockchart. It is dragon doji. A reversal candle.
A good chance tomorrow gold will be up with gap.
That is so weird. The data on FXCM is very different indeed. There’s often a small difference… but with StockCharts data there must have been a huge gap down on the open….
in fact, their close of 16th Nov to open 17th Nov has a gap of 12.3