
Upwards movement was expected.
Summary: Targets remain the same for more upwards movement: either 1,101 to 1,103 or 1,127. Upwards movement is incomplete and extremely likely to make at least a slight new high above 1,098.25. Upwards movement may continue for a further three days and may be choppy and overlapping.
New updates to this analysis are in bold.
To see weekly charts and the difference between the two wave counts go here.
MAIN ELLIOTT WAVE COUNT
Click chart to enlarge.
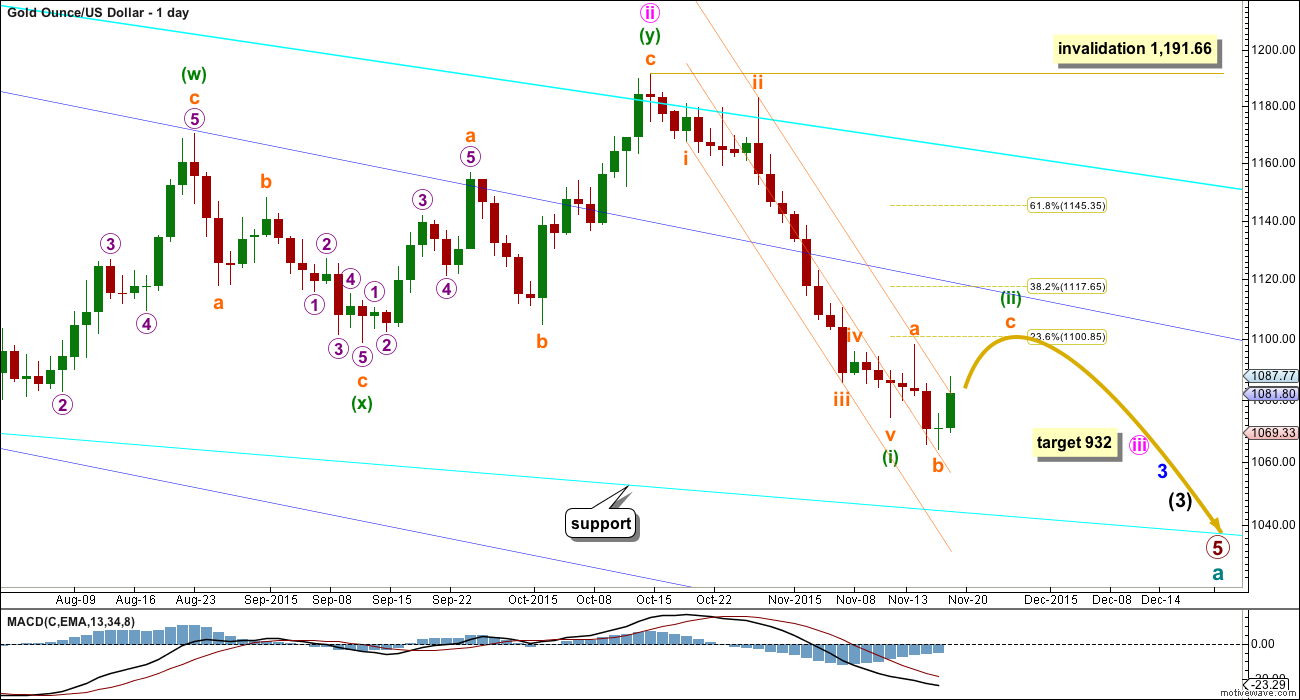
Gold has been in a bear market since September 2011. There has not yet been confirmation of a change from bear to bull, and so at this stage any bull wave count would be trying to pick a low which is not advised. Price remains below the 200 day moving average and below the blue trend line (copied over from the weekly chart). The bear market should be expected to be intact until we have technical confirmation of a big trend change.
The final line of resistance (cyan line copied over from weekly charts) is only overshot and not so far properly breached. While this line is not breached the bear wave count will remain possible. Simple is best, and the simplest method to confirm a trend change is a trend line.
Minute wave ii is a complete double zigzag and deep at 0.75 the length of minute wave i. It has breached the dark blue base channel drawn about minor waves 1 and 2, one degree higher. When a lower degree second wave correction does this it reduces the probability of the wave count but does not invalidate it. Base channels most often work to show where following corrections find support or resistance, but not always.
Draw a channel about this downwards movement using Elliott’s first technique: draw the first trend line from the end of minuette wave (i) to minuette wave (iii), then place a parallel copy on the high of minuette wave (ii).
Minuette wave (ii) should show up on the daily chart and may last a total Fibonacci five or eight days. It may be longer lasting, but at this early stage a quicker end should be expected. The middle of a big third wave is still approaching which may force corrections to be more brief and shallow than otherwise.
Minuette wave (ii) should first breach the orange channel containing minuette wave (i). If it ends at resistance at the dark blue line, it may reach only up to the 0.382 Fibonacci ratio of minuette wave (i) at 1,118. Final resistance would be at the final bear market trend line.
This may resolve RSI being oversold.
Today I have two hourly wave counts. The first may be only slightly more likely because an impulse would be a more common structure for a C wave. The second hourly wave count is entirely valid and has a good probability. The difference in probability is slight.
FIRST HOURLY WAVE COUNT
Click chart to enlarge.
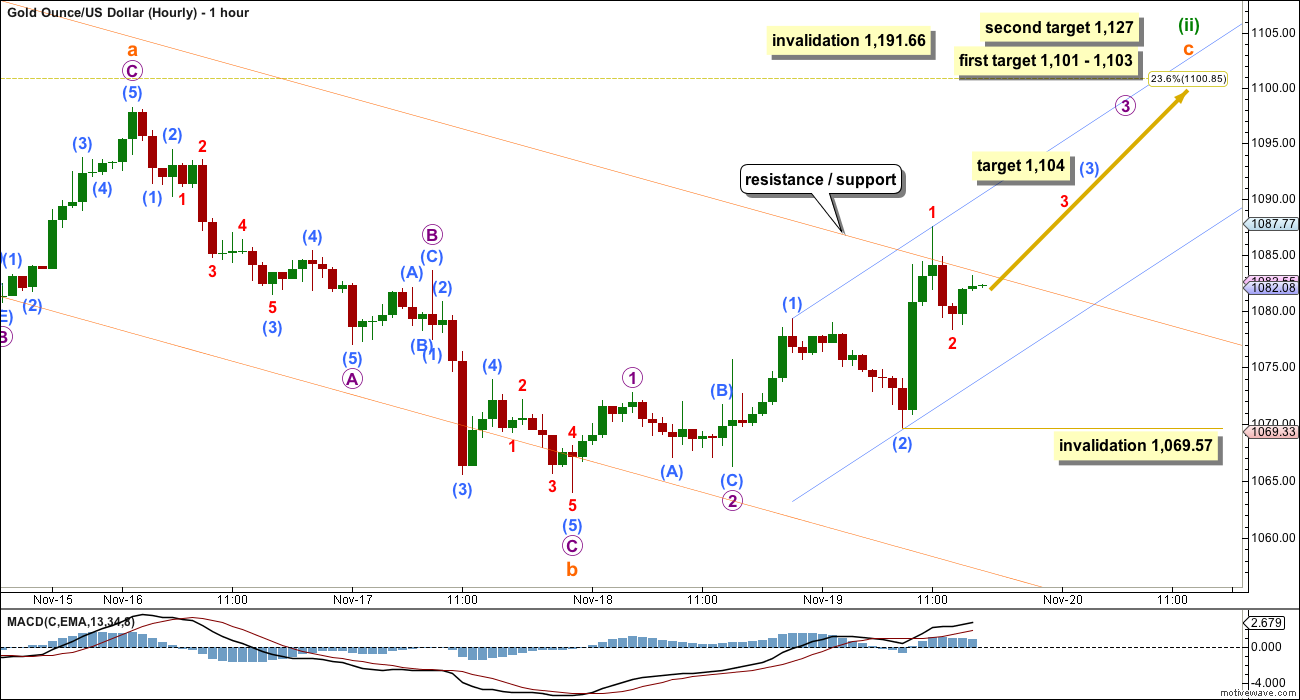
There are technically still several structural possibilities for minuette wave (ii): it may be an expanded flat correction as labelled or it may be a combination. A combination looks to be unlikely though because normally their X waves are not this deep. This looks like a typical expanded flat.
Subminuette wave b is now 1.43 times the length of subminuette wave a. This is longer than the normal length of up to 1.38, but well within the allowable convention of 2 times the length of A.
Subminuette wave c is highly likely to move at least slightly above the end of subminuette wave a at 1,098.25 to avoid a truncation and a very rare running flat.
At 1,103 subminuette wave c would reach 1.618 the length of subminuette wave a. This is close to the 0.236 Fibonacci ratio at 1,101 giving a $2 target zone.
If upwards movement continues through the first target, or if when price gets there the structure of subminuette wave c is incomplete, then a second target would be at 1,127 where subminuette wave c would reach 2.618 the length of subminuette wave a.
Subminuette wave c must subdivide as a five wave structure, either an ending diagonal or an impulse. This first hourly wave count looks at the more common impulse. The second hourly wave count below looks at the slightly less common ending diagonal.
If subminuette wave c is an impulse, then it has begun with three first and second waves. Minuscule wave 2 may not move beyond the start of minuscule wave 1. At 1,104 submicro wave (3) would reach 2.618 the length of submicro wave (3). This target expects that subminuette wave c will end at the final second target at 1,127.
So far minuette wave (ii) has lasted five days and the structure is incomplete. The expectation will now be for this correction to continue for a further three days to total a Fibonacci eight.
Minuette wave (ii) may not move beyond the start of minuette wave (i) above 1,191.66.
SECOND HOURLY WAVE COUNT
Click chart to enlarge.
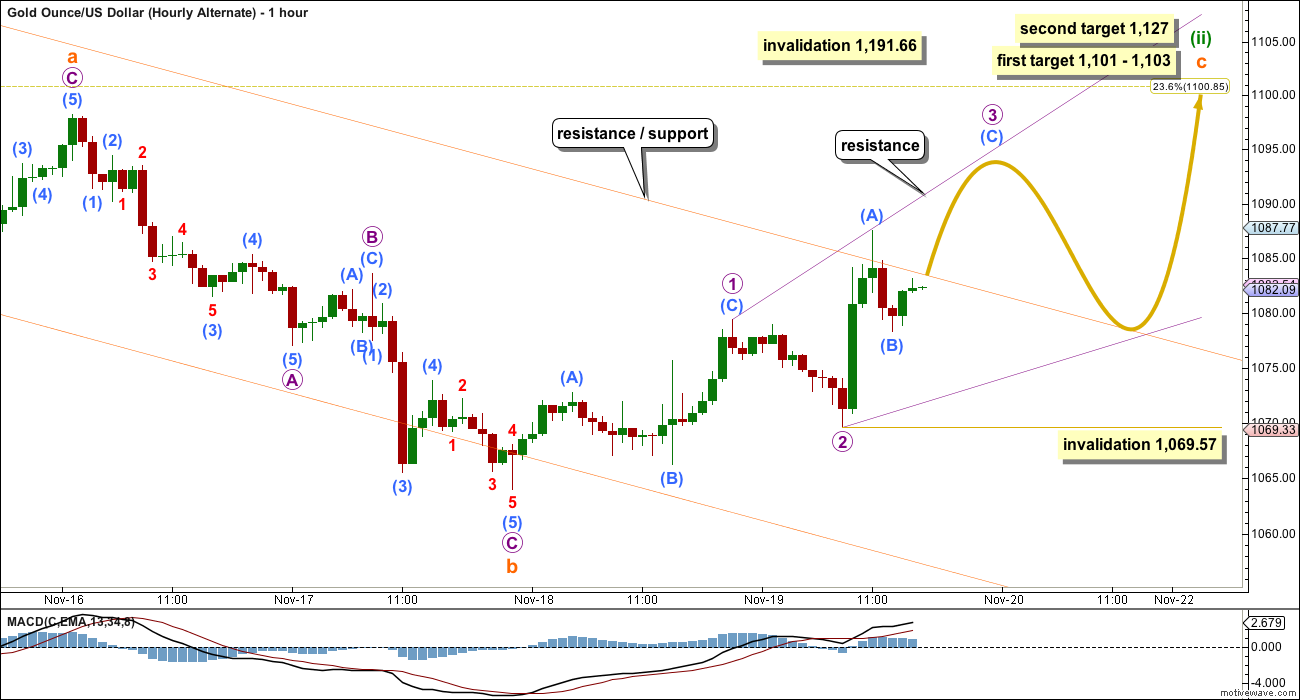
The other structural possibility for subminuette wave c is an ending diagonal. At this stage, it looks like a diagonal may be expanding rather than contracting.
All the sub waves must subdivide as zigzags within an ending diagonal.
Micro wave 3 may be likely to end at the trend line drawn from the end of micro wave 1 across the high of submicro wave (A). Diagonals normally adhere well to their trend lines.
Micro wave 3 must break above resistance at the upper edge of the orange channel copied over from the daily chart. Micro wave 4 may find support at that trend line.
The first target at 1,101 – 1,103 looks most likely for this second idea.
Diagonals are choppy and overlapping. The regular technical analysis equivalent is a rising wedge. The difference between diagonals and Elliott wave triangles is diagonals have a slope while triangles do not.
ALTERNATE ELLIOTT WAVE COUNT
Click chart to enlarge.
I am aware that this is the wave count which EWI and Danerics have. The implications are important, so I will follow this wave count daily for members here too.
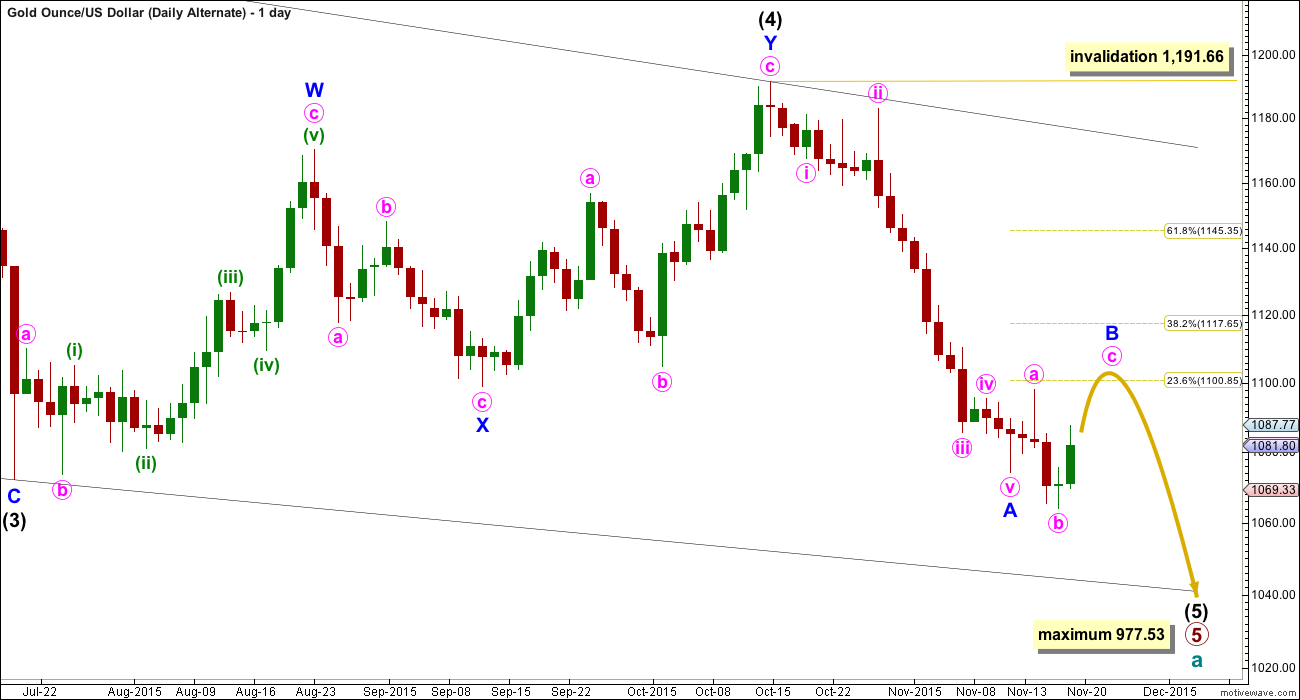
Everything is the same up to the end of the triangle for primary wave 4. Thereafter, primary wave 5 is seen as an ending contracting diagonal.
Within the ending contracting diagonal, it is not possible to see intermediate wave (2) as a zigzag and meet all Elliott wave rules. To see an explanation of why see this video at 10:25.
The same problem exists for the ending diagonal of primary wave 5 itself. Intermediate wave (3) is longer than intermediate wave (1) which would suggest an expanding diagonal, but intermediate wave (4) is shorter than intermediate wave (2) and the trend lines converge which suggests a contracting diagonal.
From “Elliott Wave Principle” by Frost and Prechter, 10th edition, page 88: “In the contracting variety, wave 3 is always shorter than wave 1, wave 4 is always shorter than wave 2, and wave 5 is always shorter than wave 3. In the expanding variety, wave 3 is always longer than wave 1, wave 4 is always longer than wave 2, and wave 5 is always longer than wave 3.”
This structure violates the rules for both a contracting and expanding variety. If the rules in Frost and Prechter are accepted, then this is an invalid wave count.
It may be that the rules need to be rewritten to add “sometimes a third wave may be the longest within a contracting or expanding diagonal”. But I have never seen Robert Prechter publish such a rule, I do not know that it exists.
I cannot reconcile this wave count from EWI with the rules in Frost and Prechter.
If an ending contracting diagonal is unfolding, then the (1) – (3) trend line may be overshot signalling the end of intermediate wave (5). If price behaves thus and turns around and moves strongly higher, then this wave count must be accepted and the rules for diagonals will need to be rewritten.
I will continue to follow this possibility as price moves lower.
Intermediate wave (5) should be shorter than intermediate wave (1). At 977.53 intermediate wave (5) would reach equality in length with intermediate wave (1). A new low below this point would take this possible diagonal structure too far from the rules. At that stage, it really should be finally discarded.
All sub waves within ending diagonals must subdivide as zigzags. Within the zigzag of intermediate wave (5), minor wave B should unfold over several days. At this stage, there is no divergence between this idea and the main Elliott wave count.
Minor wave B may not move beyond the start of minor wave A above 1,191.66.
I am uncomfortable with publishing this wave count and I only do so because it has been published by Elliott Wave International. I am not comfortable with publishing any wave count which violates the rules in Frost and Prechter. However, when looking at primary wave 5 on the weekly chart it does look like a diagonal is unfolding.
Short to mid term there is no divergence in expected direction between this wave count and the main wave count.
TECHNICAL ANALYSIS
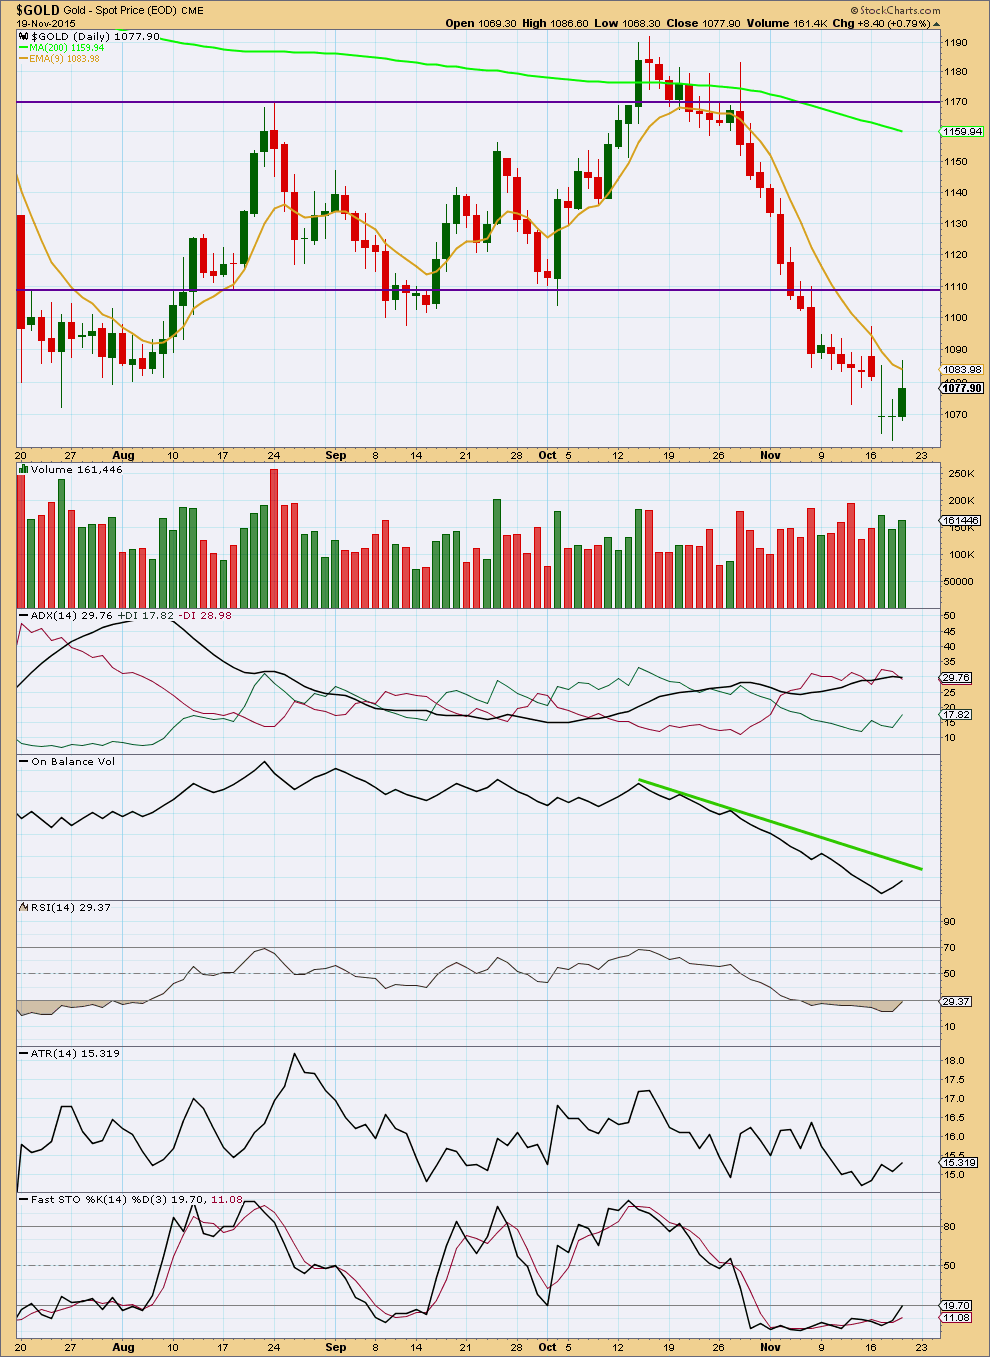
Click chart to enlarge. Chart courtesy of StockCharts.com.
Daily: Upwards movement may be finding some resistance at the 9 day EMA. An increase in volume today supports the rise in price, indicating the likelihood of more upwards movement is reasonable.
Upwards movement may end when On Balance Volume comes up to touch its green trend line.
ADX still indicates a downwards trend is in place. Today ATR is rising which indicates also that the market is trending.
RSI is has almost retuned from oversold. At least one more upwards day, maybe a few more, may resolve RSI being oversold.
This analysis is published about 04:42 p.m. EST.
Lara said it looks like it is the alternate hourly count. They have the same targets.
Lara said once gold went above the top of the trend line that gold would pull back to the trend line.
Today’s low of 1,075.87 at 3:33 pm was at upper trend line now acting as support.
GDX hit a low then of 13.34.
I bought some GDX at the close at 13.42.
Gold and GDX both moving up after the close.
Lara said gold “Two more days may see it over.”
Will sell my GDX maybe in 2 days.
Gold extremely likely to make at least a new high above $1,098.25, maybe target 1,101 – 1,103, maybe 1,127.
Thanks for the summary.
You’re welcome!
Emotional Intelligence Can Make You A Better Stock Investor
Posted 17 Nov
http://stockal.com/emotional-intelligence-could-make-you-a-better-stock-investor/
Just a little downwards movement to complete micro wave 4. Normal range 1,076 – 1,073. After that a big zigzag up.
The diagonal is expanding, micro 3 is longer than 1 and 4 is longer than 2.
5 must be longer than 3.
Lara, if hourly alternate were to be invalidated… that is IF… then what are we looking at? Go back to the alternate idea (hourly alternate) on 11-16? Your help appreciated.
Yes. If the hourly alternate is invalidated then this correction must be over.
So a new low now (prior to a new high) below 1,069.57 would indicate the correction should be over and a third wave down should be underway.
It’s possible, but technically it looks extremely unlikely.
I’ll chart it again today and present it as an alternate. It has a REALLY low probability. But we need to consider all possibilities.
What if?
The alternate wave count looks right. An ending diagonal is unfolding, generally trending upwards.
Two more days may see it over.
I think that micro wave 3 was over at the slight new high even though the 1-3 trend line is overshot by sub micro (A) within it.
Micro 4 is completing. It should be done here or very soon.
A final zigzag upwards for micro 5 is all that’s needed to complete this structure. Still very likely to end at least slightly above 1,098.25 to avoid a truncation, and the most likely target is 1,101 – 1,103.
Darn it, posted a question after it sat in the comment box so i missed your post before hitting enter. Anyway.. Despite the comforting projection of completing the expanding diaganol, I’m interested in what would the game plan be if the 1069.57 were to invalidate this chart? Any ideas?
Lara.
I have the same wave count except that I think micro 3 is not at the high, but at 1087.48, the peak just before the high. I have micro 4 as an expanded flat with this count. In this scenario, micro 5 will be quite long, longer than micro 3.
This count works for both the main and the alternate.
Except that does not work, because the fourth wave within an ending diagonal may only be a zigzag, it may not be an expanded flat.
It would make the diagonal trend lines look better, but it’s not valid.
Gold is at the trend line support – 1077.
Alternative hourly wave count may be in the cards here.
Gold has traded to 1087 and testing the lower trend line at 1081.
Lara: “Micro wave 3 must break above resistance at the upper edge of the orange channel copied over from the daily chart. Micro wave 4 may find support at that trend line.”
invalidation is 1069.57.
MTSLD
Along your thought here is another call for start buying miners.
http://goldtadise.com/?p=356266
Thanks for the update, Lara. Any chance you can update GDX sometime soon? The last update I see is from October 9th. Curious if Minor wave 4 up just started? Not sure how likely that idea is since your gold wave count still shows more downward movement for gold after a brief upward correction against the primary trend. Thanks for the constant attention to detail.
I put some GDX charts up in comments on 13th in the Gold analysis.
I’ll get to a proper update of GDX this weekend.
Thanks, Lara. I missed the update in the comments section.
I have been reading every day, just not much to post since I am flat. (been active on the stock indexes lately)
I’ve been contemplating my next steps with Gold, only one gold trade in the last few weeks. At this point, given how close we are to the end of this move down, I am not planning to trade the next leg down, except maybe a small position. My focus is going to be on getting ready to buy gold/miners as we near the bottom or come out of the bottom (I am not expecting to time it perfectly, so I will probably be making several physical/miner purchases).
It’s Thanksgiving in the US next week, so I wish you all a Happy Thanksgiving!
Ben
Gold bottom could be a few weeks or months.
Lara said 2 weeks ago 19 weeks plus or minus 3.
However would be different is alternate daily manifests to 977.53 lowest.
Ron Rosen market timing letter on Gold/silver/Dow- Running flat.
http://www.321gold.com/editorials/rosen/rosen111915.pdf
Ron forecasting gold at $924.
As I understand it, Ron used a conventional TA measured move to get that $924 forecast and he made that measurement from the lowest point of the triangle. However, if the measurement is taken from where price breaks out of the triangle, the target would be around 1000 and more in line with the target for Lara’s main alternate.
I think I’ve seen his wave count for the running flat before.
The C wave he expects is not only truncated, but enormously so, and does not even get back into wave A price territory (yet – Silver does, but Gold has not done that yet)
The B wave of that possible running flat is 3.55 times the length of the A wave.
That idea has such a ridiculously low probability… it looks so wrong…. when there are other more reasonable wave counts possible that avoid the problems in that running flat.
I would not be using that wave count at all.