
Upwards movement was expected.
Yesterday’s second hourly Elliott wave count looked at the possibility that upwards movement may be very choppy and overlapping. This is the correct Elliott wave count.
Summary: The target for more upwards movement is at 1,101 to 1,103. Upwards movement is incomplete and extremely likely to make at least a slight new high above 1,098.25. Upwards movement may continue for a further two days and is expected to be choppy and overlapping.
New updates to this analysis are in bold.
To see weekly charts and the difference between the two wave counts go here.
MAIN ELLIOTT WAVE COUNT
Click chart to enlarge.
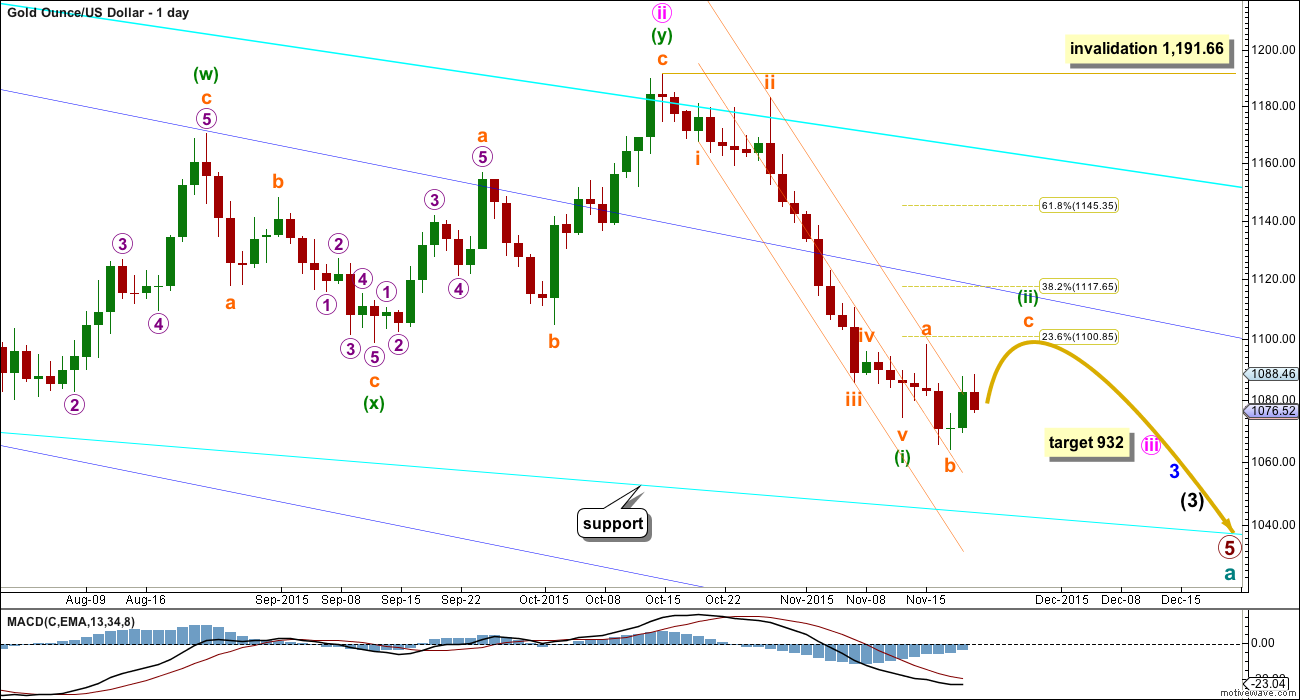
Gold has been in a bear market since September 2011. There has not yet been confirmation of a change from bear to bull, and so at this stage any bull wave count would be trying to pick a low which is not advised. Price remains below the 200 day moving average and below the blue trend line (copied over from the weekly chart). The bear market should be expected to be intact until we have technical confirmation of a big trend change.
The final line of resistance (cyan line copied over from weekly charts) is only overshot and not so far properly breached. While this line is not breached the bear wave count will remain possible. Simple is best, and the simplest method to confirm a trend change is a trend line.
Minute wave ii is a complete double zigzag and deep at 0.75 the length of minute wave i. It has breached the dark blue base channel drawn about minor waves 1 and 2, one degree higher. When a lower degree second wave correction does this it reduces the probability of the wave count but does not invalidate it. Base channels most often work to show where following corrections find support or resistance, but not always.
Draw a channel about this downwards movement using Elliott’s first technique: draw the first trend line from the end of minuette wave (i) to minuette wave (iii), then place a parallel copy on the high of minuette wave (ii).
Minuette wave (ii) should show up on the daily chart and may last a total Fibonacci five or eight days. It may be longer lasting, but at this early stage a quicker end should be expected. The middle of a big third wave is still approaching which may force corrections to be more brief and shallow than otherwise.
Minuette wave (ii) should first breach the orange channel containing minuette wave (i). If it ends at resistance at the dark blue line, it may reach only up to the 0.382 Fibonacci ratio of minuette wave (i) at 1,118. Final resistance would be at the final bear market trend line.
This may resolve RSI being oversold.
Using FXCM data there is a morning doji star at the last low. This supports the idea of some more upwards movement from here.
Again, today I have two hourly wave counts. The main wave count is very strongly favoured. The alternate is presented as a ‘what if?’ to consider all possibilities. I would judge it to have an extremely low probability, but it is technically possible.
MAIN HOURLY WAVE COUNT
Click chart to enlarge.
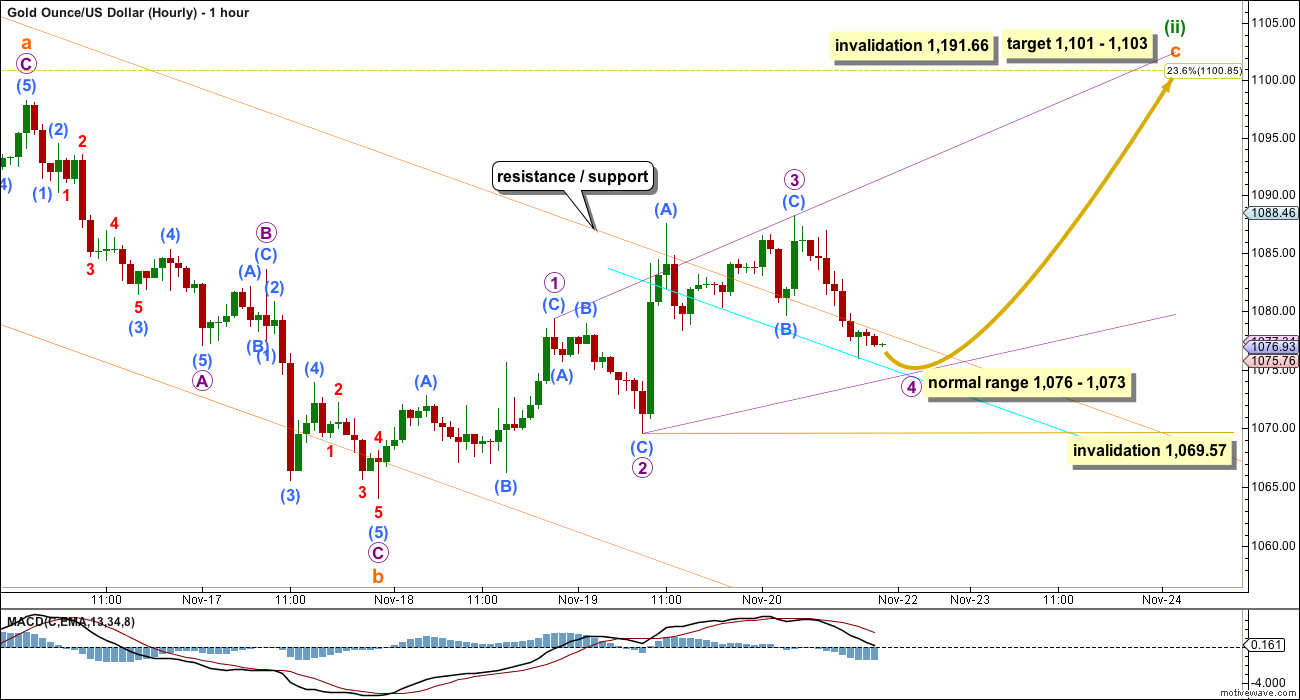
There are technically still several structural possibilities for minuette wave (ii): it may be an expanded flat correction as labelled or it may be a combination. A combination looks to be unlikely though because normally their X waves are not this deep. This looks like a typical expanded flat.
Subminuette wave b is now 1.43 times the length of subminuette wave a. This is longer than the normal length of up to 1.38, but well within the allowable convention of 2 times the length of A.
Subminuette wave c is highly likely to move at least slightly above the end of subminuette wave a at 1,098.25 to avoid a truncation and a very rare running flat.
At 1,103 subminuette wave c would reach 1.618 the length of subminuette wave a. This is close to the 0.236 Fibonacci ratio at 1,101 giving a $2 target zone.
At this stage, there are two zigzags moving upwards. Subminuette wave c looks to be very likely unfolding as an ending expanding diagonal.
Micro wave 2 is 0.64 the length of micro wave 1 within the expanding diagonal. This is just short of the normal range of 0.66 to 0.81.
Micro wave 3 is longer than micro wave 1, and so far micro wave 4 is longer than micro wave 2. The diagonal is expanding. Micro wave 5 must be longer than micro wave 3, so it must be longer than 18.65.
Micro wave 4 looks likely to be very close to completion at this stage. The normal range would be 1,076 – 1,073 where it would be between 0.81 to 0.66 the length of micro wave 3.
Micro wave 4 may not move beyond the end of micro wave 2 below 1,069.57.
When micro wave 4 is complete, then a big zigzag upwards for micro wave 5 may take its time. If it lasts a further two days, then minuette wave (ii) may total a Fibonacci eight days.
The upper edge of the orange channel, which is copied over from the daily chart, is not perfectly showing where price is finding support and resistance. Create a parallel copy and place it as shown. This parallel copy may be a more accurate guide to support for the end of micro wave 4.
ALTERNATE HOURLY WAVE COUNT
Click chart to enlarge.
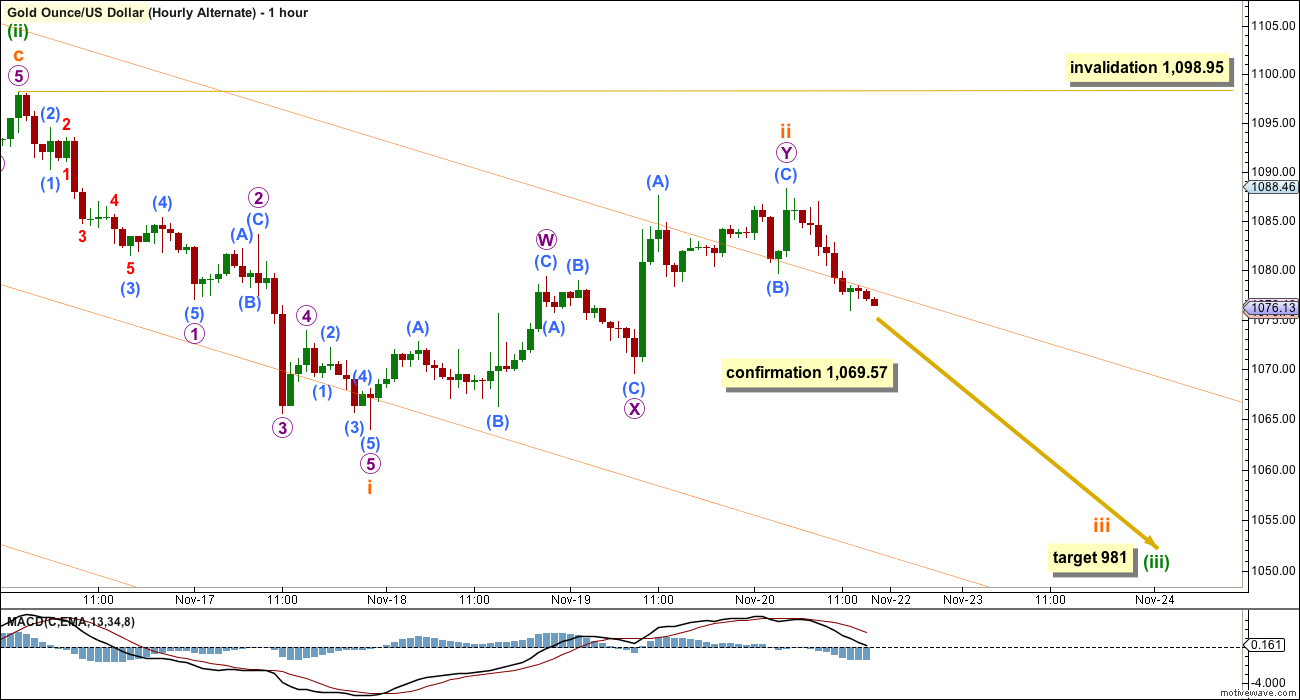
What if minuette wave (ii) was over as a brief shallow zigzag? This is technically possible, but extremely unlikely for the following reasons:
1. Minuette wave (ii) would not contain any green candlesticks on the daily chart.
2. Minuette wave (ii) would not have breached the channel which contains minuette wave (i).
3. Subminuette wave ii, one degree lower, has breached the channel containing minuette wave (i).
4. Subminuette wave ii is deep and time consuming in comparison to subminuette wave i.
If in the next trading day we see a new low below 1,069.57, then this wave count should be seriously considered. It would then be likely that a third wave down has begun a little earlier than expected.
ALTERNATE ELLIOTT WAVE COUNT
Click chart to enlarge.
I am aware that this is the wave count which EWI and Danerics have. The implications are important, so I will follow this wave count daily for members here too.
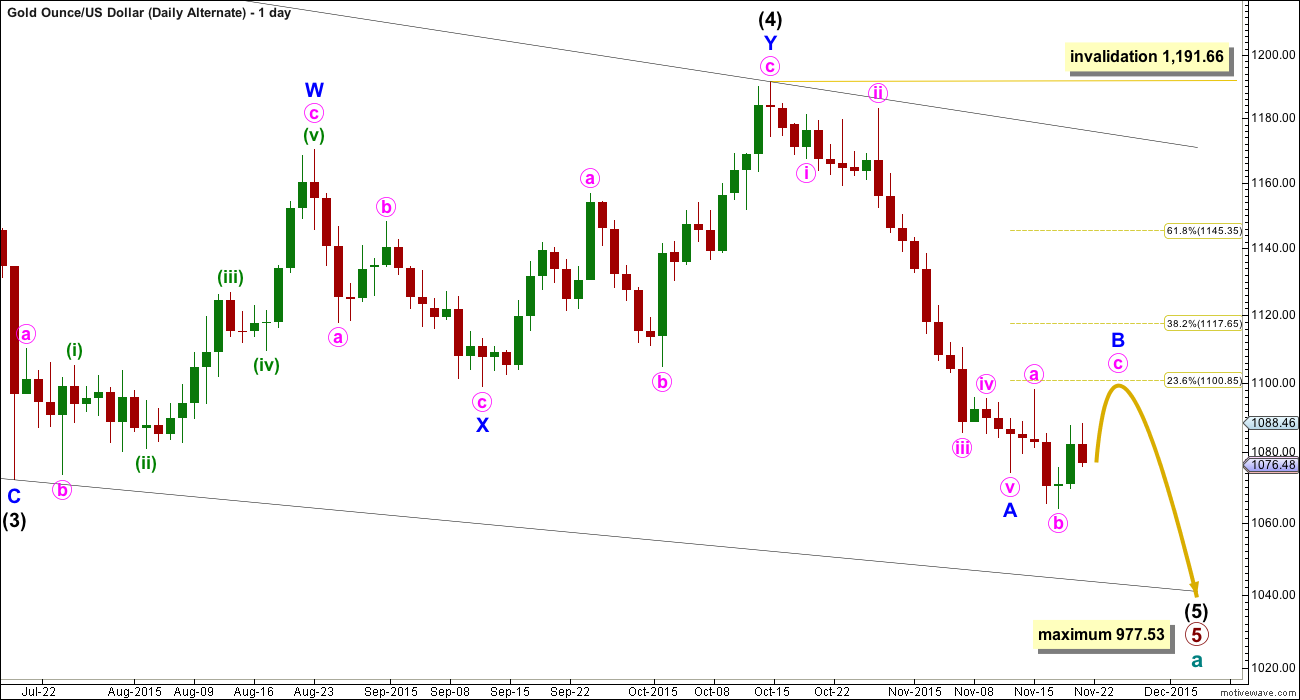
Everything is the same up to the end of the triangle for primary wave 4. Thereafter, primary wave 5 is seen as an ending contracting diagonal.
Within the ending contracting diagonal, it is not possible to see intermediate wave (2) as a zigzag and meet all Elliott wave rules. To see an explanation of why see this video at 10:25.
The same problem exists for the ending diagonal of primary wave 5 itself. Intermediate wave (3) is longer than intermediate wave (1) which would suggest an expanding diagonal, but intermediate wave (4) is shorter than intermediate wave (2) and the trend lines converge which suggests a contracting diagonal.
From “Elliott Wave Principle” by Frost and Prechter, 10th edition, page 88: “In the contracting variety, wave 3 is always shorter than wave 1, wave 4 is always shorter than wave 2, and wave 5 is always shorter than wave 3. In the expanding variety, wave 3 is always longer than wave 1, wave 4 is always longer than wave 2, and wave 5 is always longer than wave 3.”
This structure violates the rules for both a contracting and expanding variety. If the rules in Frost and Prechter are accepted, then this is an invalid wave count.
It may be that the rules need to be rewritten to add “sometimes a third wave may be the longest within a contracting or expanding diagonal”. But I have never seen Robert Prechter publish such a rule, I do not know that it exists.
I cannot reconcile this wave count from EWI with the rules in Frost and Prechter.
If an ending contracting diagonal is unfolding, then the (1) – (3) trend line may be overshot signalling the end of intermediate wave (5). If price behaves thus and turns around and moves strongly higher, then this wave count must be accepted and the rules for diagonals will need to be rewritten.
I will continue to follow this possibility as price moves lower.
Intermediate wave (5) should be shorter than intermediate wave (1). At 977.53 intermediate wave (5) would reach equality in length with intermediate wave (1). A new low below this point would take this possible diagonal structure too far from the rules. At that stage, it really should be finally discarded.
All sub waves within ending diagonals must subdivide as zigzags. Within the zigzag of intermediate wave (5), minor wave B should unfold over several days. At this stage, there is no divergence between this idea and the main Elliott wave count.
Minor wave B may not move beyond the start of minor wave A above 1,191.66.
I am uncomfortable with publishing this wave count and I only do so because it has been published by Elliott Wave International. I am not comfortable with publishing any wave count which violates the rules in Frost and Prechter. However, when looking at primary wave 5 on the weekly chart it does look like a diagonal is unfolding.
Short to mid term there is no divergence in expected direction between this wave count and the main wave count.
TECHNICAL ANALYSIS
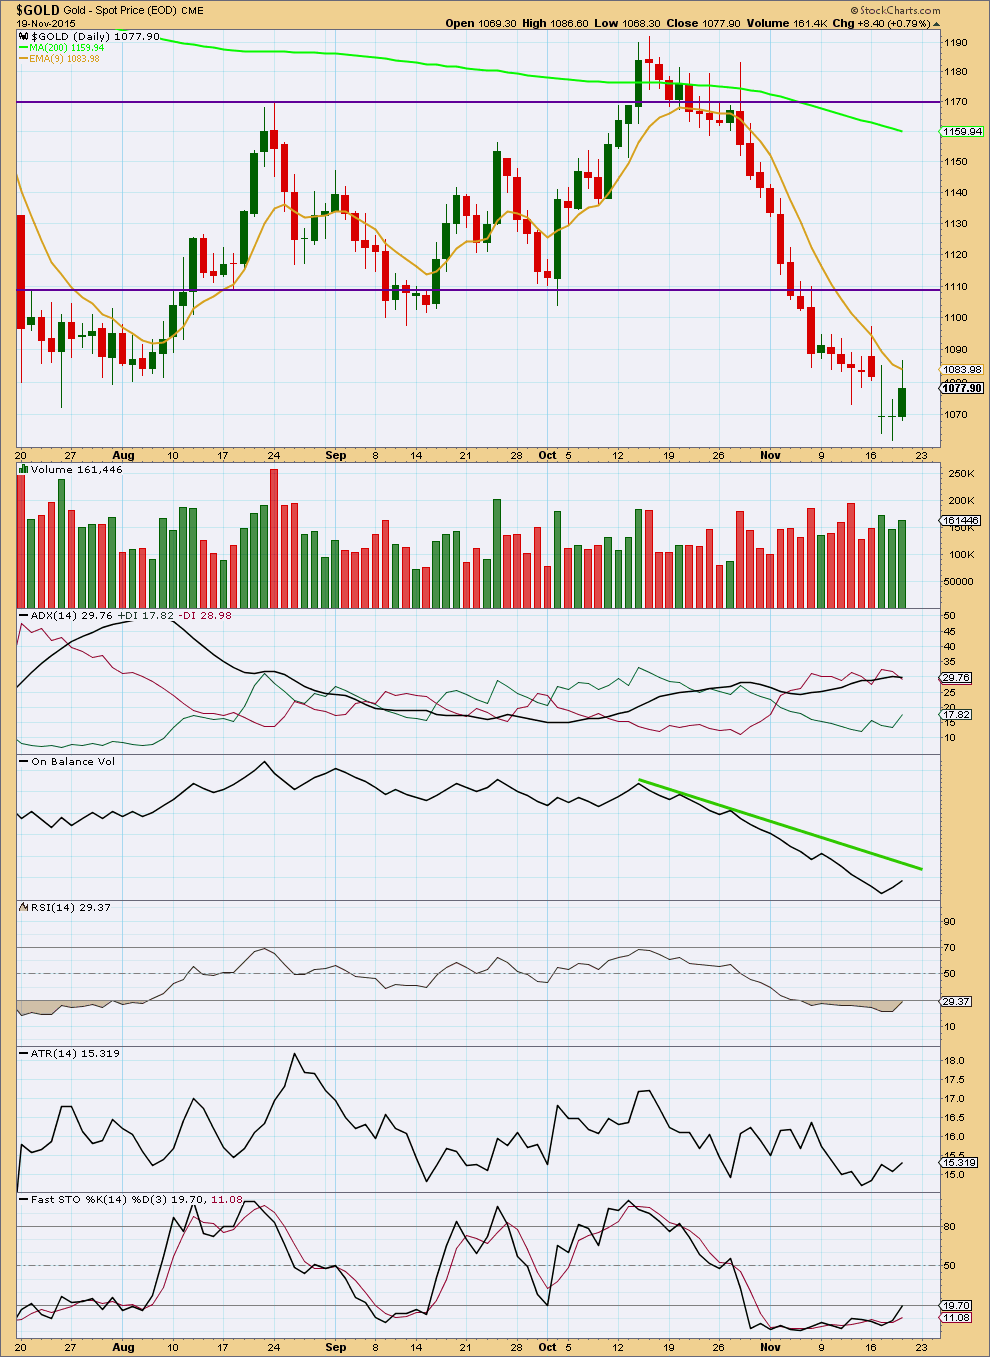
Click chart to enlarge. Chart courtesy of StockCharts.com.
Note: Again, this analysis is published early while NY is still in session. Regular technical analysis will be updated later Saturday evening NY time when StockCharts data is available and finalised.
Daily: Upwards movement may be finding some resistance at the 9 day EMA. An increase in volume today supports the rise in price, indicating the likelihood of more upwards movement is reasonable.
Upwards movement may end when On Balance Volume comes up to touch its green trend line.
ADX still indicates a downwards trend is in place. Today ATR is rising which indicates also that the market is trending.
RSI is has almost retuned from oversold. At least one more upwards day, maybe a few more, may resolve RSI being oversold.
This analysis is published about 04:54 p.m. EST.
IMHO: Monday H 1076.50 / L 1065…. The likely scenario for today: the lower end of Monday range gets taken out for 105x….. A short term rally may occur, unlikely to get past 1073-74 at this stage….
Come on Gold just drop $200 by the weekend to $868 to end primary wave 5 so we don’t have to put up with your indecisive seesaw choppiness for the rest of our lives.
It’s become so confusing that the miners are going up while you’re going down, so sad.
Please give us a final bottoming in the next week so we can make profits going up instead of shorting and so we can look forward to at least a year of buy cheap miners and hold as gold moves in a clear up trend to the $1,400 area before the next major bearish correction.
lol
Be careful what you wish for Richard.
When cycle a is complete we have a cycle degree b wave. All possible corrective structures will be on the table.
B waves are the bane of my life.
This will be the first idea to consider. C is still an ending diagonal, but only micro 1 is complete. Micro 2 is almost complete. More choppy overlapping upwards movement for a few days.
When NY is closed and I have data for the session I’ll finish up the analysis.
The problem now becomes what if this is a combination?
The first structure would have been a zigzag. Which means the second structure is now unfolding and should be a flat or triangle. A flat is much more likely.
If the second structure is a flat then within it micro B may move beyond the start of A.
This means we may see a new low below 1,064.02 and then a bounce for a few days up to 1,098 or thereabouts.
This chart will be a second idea to consider today.
Although the invalidation point on the hourly chart has been breached I am not convinced. This downwards movement just does not look like the start of a third wave. Its too choppy and overlapping, momentum is increasing but not strong enough yet.
I would want to see a new low below 1,064.02 to invalidate any remaining idea that we’re going to see a bounce from here.
The main hourly wave count could yet still see an ending diagonal unfolding upwards for wave C. Only the first wave zigzag would be complete, this downwards movement could be a second wave correction. It may not move below the start of the first wave at 1,064.02.
If we get a new low below 1,064.02 it is impossible to see wave C continuing. The correction would have to be over.
It certainly is difficult to get bullish on gold when everyday we get a new low.
Miners are struggling to hang on in spite of gold weakening.
Gold now at 1069.59 which is $5 below the close 1,174.90 and GDX is still at the same price now as the close $13.40.
Somehow the market keeps thinking the miners have bottomed and get back into GDX.
The only thing Gold price has failed to do as yet is break below multi-year low 1063-62…. Upside would likely remain contained under 5dma/10dma… Is there reason enough to be bullish?
Gold is very oversold. Do we bounce here? Chart by SiliconValleyTrader
I watching a dollar can go above 100.275 ? or we fail and gold start rally
saw this posted on Stocktwits too. Good going sharing here for everyone. I believe in MACD crosses!
Some arguments for a gold bounce and a theory on the emergency Fed meeting.
http://www.safehaven.com/article/39634/pm-sector-big-green-light-and-low-risk-entry-setup
Last Friday’s COT data indicated bullish for gold. On Oct 16 and 23 COT data was declared bearish. What followed is evidence.
Commercial shorts have been dropped to level where some bounce maybe expected with side way movement compared to Aug 8 low and Commercial shorts.
Thank you for sharing! Nice chart.
Ditto Lara’s comment! Really puts the COT in perspective to price movement for us traders.
Trend of Gold _ 23-11-2015
Gold extends losses on US rate hike view, stronger dollar – Nov 23 2015 12:37AM
http://www.thehindubusinessline.com/markets/gold/gold-extends-losses-on-us-rate-hike-view-stronger-dollar/article7908132.ece?utm_source=RSS_Feed&utm_medium=RSS&utm_campaign=RSS_Syndication
Gold went below the invalidation point of 1,069.57 to 1067.56 at 9:31 pm Sunday, thus the hourly alternate is in play. If in the next trading day we see a new low below 1,069.57, then this wave count should be seriously considered. It would then be likely that a third wave down has begun a little earlier than expected. The target for subminuette wave iii is $981.
It did. But this price behaviour is not convincing.
If we see a new low below 1,064.02 then we must expect more downwards movement, and an increase in momentum.
IMHO a break below 1064 is required to set the cat amongst the pigeons to see Gold price lower; on the upside unlikely to see Gold price past 1078-79 (subject to sustain above 1072-73) with 1085 on the outside… Likely sideways drift for today… Lets see how this pans out….
Lara, regarding the
recent invalidation (1069.57),
do you concur with Dreamer
on his/her perspective
and the 1064.02 price point?
My take is that the drop may not be over yet. There could be one final drop to below today’s low before turning upwards. So, if the drop goes below 1064.xx (depending on the data feed) then the msin hourly count should be invalidated. The hourly alternate would be in play.
My reasoning is that the high at 1088.18 which Lara considered as micro 3 could actually be only micro 1. In this case, we will be on track to reach the expected 1101-1103 or slightly higher.
If the slternate hourly is correct, we would not go higher than 1088.18. So, the next bounce up would clarify matters.
Hi Alan, the only possible problem with your idea is that the drop from Lara’s micro 3 is a clear 5 waves on the 5 minute. Doesn’t that negate a possible micro 2?
Alan you are right.
“If we get a new low below 1,064.02 it is impossible to see wave C continuing. The correction would have to be over.” – Lara 1:34 pm today.
Thanks for responding quickly. Your new EW info kept me from doing anything stupid!
Yes.
Even though the main hourly count was invalidated with a new low below 1,069.57, it’s still possible that the correction is not over. It may have morphed into a combination. As long as we stay above the low on the 17th of 1,064.02, we may move up to the 1,100 level before the move down continues.
On second thought, if the y wave in the chart above turns out to be an expanded flat, then it is still possible for gold to make another new low below 1,064.02 before moving up to around 1,100. Things are never simple or easy.
I read this weekend about a hypothesis that went something like this – Yuan is about to be accepted into the SDR on 11/30, so US is trying to drive the dollar higher to make sure the USD has more shares in the SDR.
This may coincide well with a nice strong push down in gold and oil over the next couple of weeks.
Lara I read your FTSE report: “So far I have not been able to find other bull alternatives which fit.”
Considering the current markets since 2003 have been “All One Market”. they all go up and down to gather.
If FTSE is going down in wave iii, SPX and othesr should follow suite??????
Yes. It should. I’m not expecting new all time highs for FTSE, S&P, DJI, DJT or Nasdaq.
I expect for all they’re currently finishing up a bear market rally.
Thursday November 26 NYSE closed US Thanksgiving and Nov 27 Friday closes at 1 pm
https://www.nyse.com/markets/hours-calendars#holidays
** Each market will close early at 1:00 p.m. on Friday, November 27, 2015
Updated COT analysis. Someone asked me to include dates from when Gold bottomed, so I did that. And I used some fancy red pen to draw the number of COT weeks between blue line peaks and gold bottoms and back up to blue line peaks again. The last 4 drops in gold were 10, 11, 7, and 8 COT weeks from blue line peak to gold low. We are currently at 4 COT weeks (plus the last 3 days). Therefore, I am waiting a few more weeks before I start accumulating. With a few weeks left to drop lower, I would be cautious about trading this corrective wave to the long side. Like Lara frequently says – expect any surprises to be to the downside.
Yes your observation align with Lara’s wave count. few days of counter trend rally and sharply gold going down. I will be monitoring COT data in next several weeks. Current data is too positive for gold.
Any one know what will be effect on Gold!!!
A surprise meeting of the gang of “FOMC”.
——————————————————————————————
It is anticipated that the closed meeting of the Board of Governors of the Federal Reserve System at 11:30 AM on Monday, November 23, 2015, will be held under expedited procedures, as set forth in section 26lb.7 of the Board’s Rules Regarding Public Observation of Meetings, at the Board’s offices at 20th Street and C Streets, N.W., Washington, D.C. The following items of official Board business are tentatively scheduled to be considered at that meeting…………..
http://www.federalreserve.gov/aboutthefed/boardmeetings/20151123advexp.htm
Of course I don’t know what will be the effect on gold, but I do have some thoughts that can be taken as background information.
Money supply and money velocity depend in part on how motivated banks are to make loans. That motivation in turn depends, in part, on the interest rate they can get on those loans minus the interest rate they pay on the money. In recent months, the Fed has been talking about raising market interest rates and that would increase the incentive for banks making loans. However, the Fed has had trouble getting suitable economic conditions so they can raise rates without causing other problems, and recent economic data suggest economic conditions may not be suitable enough by the December meeting.
Another way the Fed can stimulate bank lending is to lower the interest rate the Fed pays banks for funds the banks have on deposit with the Fed. I think that rate is 1/4%. If the Fed were to drop that rate to 0%, it could be a game-changer.
According to Lara grand super cycle corrective wave iv to last at least 55 years from 2011. That is beyond any ones life time unless you are born yesterday.
We can look forward to cycle wave a and b.
Disclaimer: unless Central bankers have different idea to change drastically current monetary policy!!!!!
Below is weekly chart of gold from 2008 with Lara’s cycle wave projection.
A cautious tale in the dangers of shorting…
http://money.cnn.com/2015/11/20/investing/trader-gofundme-drug-kalobios-shkreli/index.html
COT gold : Extremely bullish this week.
From Oct 23 when gold was at 1164 to day gold at 1077 commercial shorts have drop more than 100,000 contracts and net short is low at 21488 down from 175,000.
11/17 Commercial shorts 294,588, Spec long: 165,084; Gold close:1077 (-21488) Net Shorts +24465
11/13 Commercial shorts 316,069, Spec long: 167,232; Gold close:1082 (-36992) Net Shorts +69,352
11/06 Commercial shorts 352,992, Spec long: 190,149; Gold close:1089 (-36012) Net Shorts +123,381
10/30 Commercial shorts 389,003, Spec long: 225,777; Gold close:1141 (-9641) Net Shorts +171,480
10/23 Commercial shorts 398,644, Spec long: 233,132; Gold close:1164 (+42,854) Net Shorts +174952
Yes, Gold COT definitely supports the bounce that Lara expects and then there’s plenty of room for the Commercials to add to shorts for the coming drop.
Moreover, the correction may take more time to unfold than many realize.
Yes. Its looking like thats the case.