
Upwards movement was expected but did not happen.
Price moved lower to invalidate the hourly Elliott wave count.
Summary: A new high above 1,088.22 would provide confidence that this correction is not over. The target remains at 1,101 – 1,103 as most likely. A new low below 1,040 would finally confirm the correction is over and the downwards trend has resumed. The middle of a strong third wave down may be approaching. Again, expect any surprises to be to the downside.
New updates to this analysis are in bold.
To see weekly charts and the difference between the two wave counts go here.
MAIN ELLIOTT WAVE COUNT

Click chart to enlarge.
Gold has been in a bear market since September 2011. There has not yet been confirmation of a change from bear to bull, and so at this stage any bull wave count would be trying to pick a low which is not advised. Price remains below the 200 day moving average and below the blue trend line (copied over from the weekly chart). The bear market should be expected to be intact until we have technical confirmation of a big trend change.
The final line of resistance (cyan line copied over from weekly charts) is only overshot and not so far properly breached. While this line is not breached the bear wave count will remain possible. Simple is best, and the simplest method to confirm a trend change is a trend line.
Minute wave ii is a complete double zigzag and deep at 0.75 the length of minute wave i. It has breached the dark blue base channel drawn about minor waves 1 and 2, one degree higher. When a lower degree second wave correction does this it reduces the probability of the wave count but does not invalidate it. Base channels most often work to show where following corrections find support or resistance, but not always.
Draw a channel about this downwards movement using Elliott’s first technique: draw the first trend line from the end of minuette wave (i) to minuette wave (iii), then place a parallel copy on the high of minuette wave (ii).
Minuette wave (ii) should show up on the daily chart and may last a total Fibonacci five or eight days. It may be longer lasting, but at this early stage a quicker end should be expected. The middle of a big third wave is still approaching which may force corrections to be more brief and shallow than otherwise.
Minuette wave (ii) should first breach the orange channel containing minuette wave (i). If it ends at resistance at the dark blue line, it may reach only up to the 0.382 Fibonacci ratio of minuette wave (i) at 1,118. Final resistance would be at the final bear market trend line.
This may resolve RSI being oversold.
Using FXCM data there is a morning doji star at the last low. This supports the idea of some more upwards movement from here.
Today I have three hourly wave counts which are presented in order of probability. All possibilities are considered.
FIRST HOURLY WAVE COUNT
Click chart to enlarge.
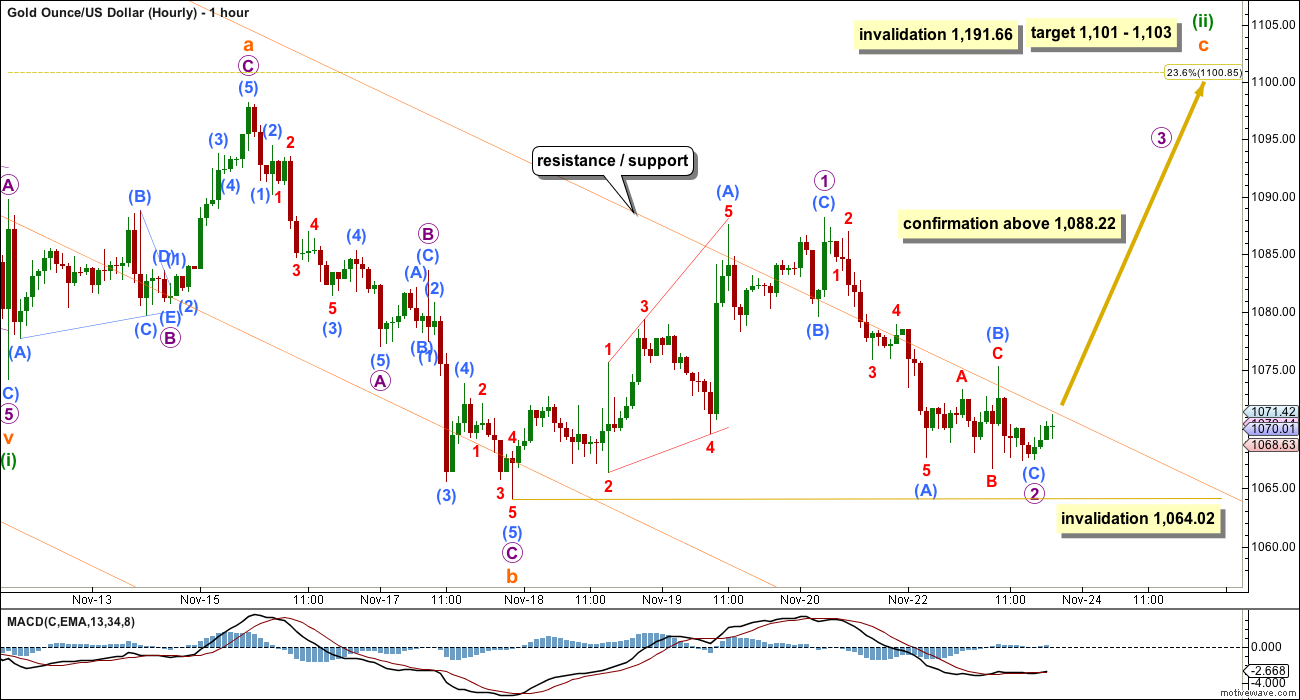
There are technically still several structural possibilities for minuette wave (ii): it may be an expanded flat correction as labelled or it may be a combination. A combination looks to be unlikely though because normally their X waves are not this deep. This looks like a typical expanded flat.
Subminuette wave b is now 1.43 times the length of subminuette wave a. This is longer than the normal length of up to 1.38, but well within the allowable convention of 2 times the length of A.
Subminuette wave c is highly likely to move at least slightly above the end of subminuette wave a at 1,098.25 to avoid a truncation and a very rare running flat.
At 1,103 subminuette wave c would reach 1.618 the length of subminuette wave a. This is close to the 0.236 Fibonacci ratio at 1,101 giving a $2 target zone.
If subminuette wave c is still unfolding as an ending diagonal, then micro wave 1 within it may be a long complete single zigzag. It may also be a double zigzag; double and triple zigzags may take the place of single zigzags.
Micro wave 2 would be most likely complete now. It may not move beyond the start of micro wave 1 below 1,064.02.
The diagonal may be contracting and manage to end above 1,098.25.
SECOND HOURLY WAVE COUNT
Click chart to enlarge.
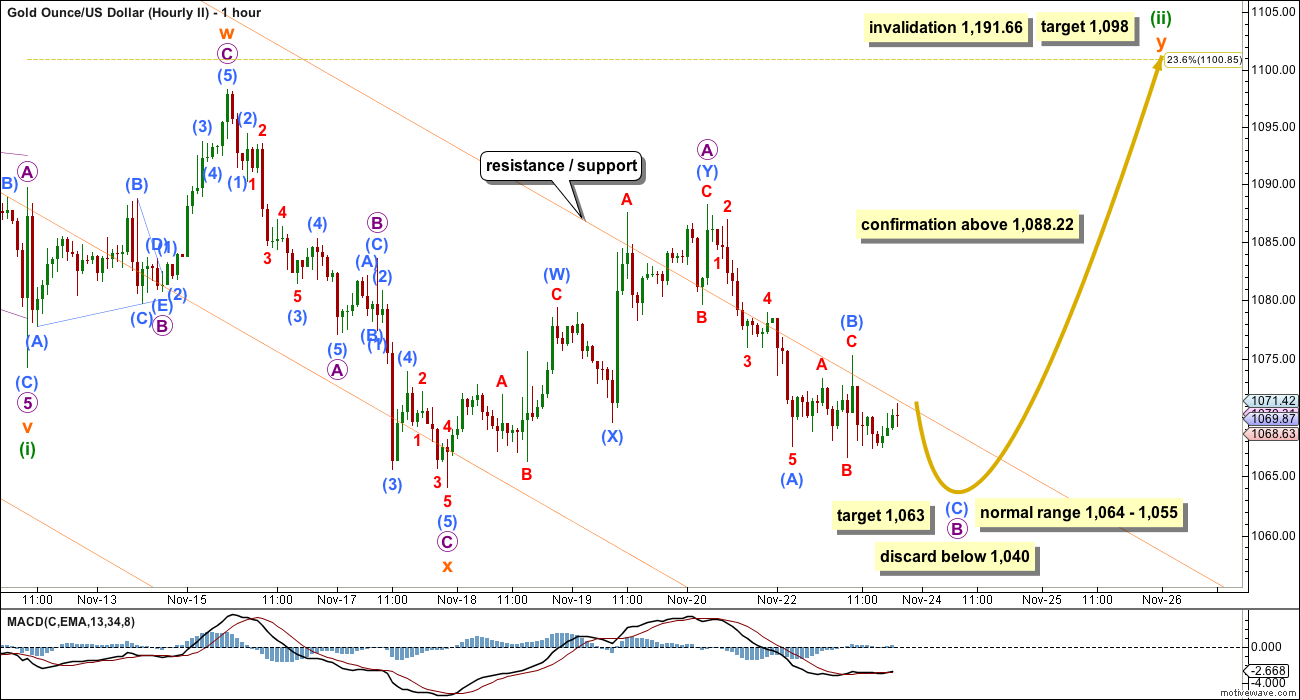
Minuette wave (ii) may also be unfolding as a combination. X waves within combinations are not normally this deep, and only for this reason would this wave count be slightly less likely than the first hourly wave count.
The first structure in the combination was a zigzag labelled subminuette wave w.
The double is joined by a complete three, a zigzag in the opposite direction labelled subminuette wave x.
Subminuette wave y would most likely be a flat correction and least likely a triangle. Within the flat correction, micro wave B must retrace a minimum 90% length of micro wave A at 1,066.44. It has not managed to do this yet, so some more downwards movement would be required for this wave count.
Micro wave B may move beyond the start of micro wave A as in an expanded flat. The common length for B waves within flat corrections is between 1 to 1.38 times the length of the A wave. This gives a range to expect micro wave B to end within at 1,064 – 1,055.
When micro wave B is 2 times the length of micro wave A at 1,040 the probability that a flat correction is unfolding would be very low and this wave count should be discarded.
A new high above 1,088.22 would invalidate the third wave count and provide confidence in this and the first wave count.
THIRD HOURLY WAVE COUNT
Click chart to enlarge.
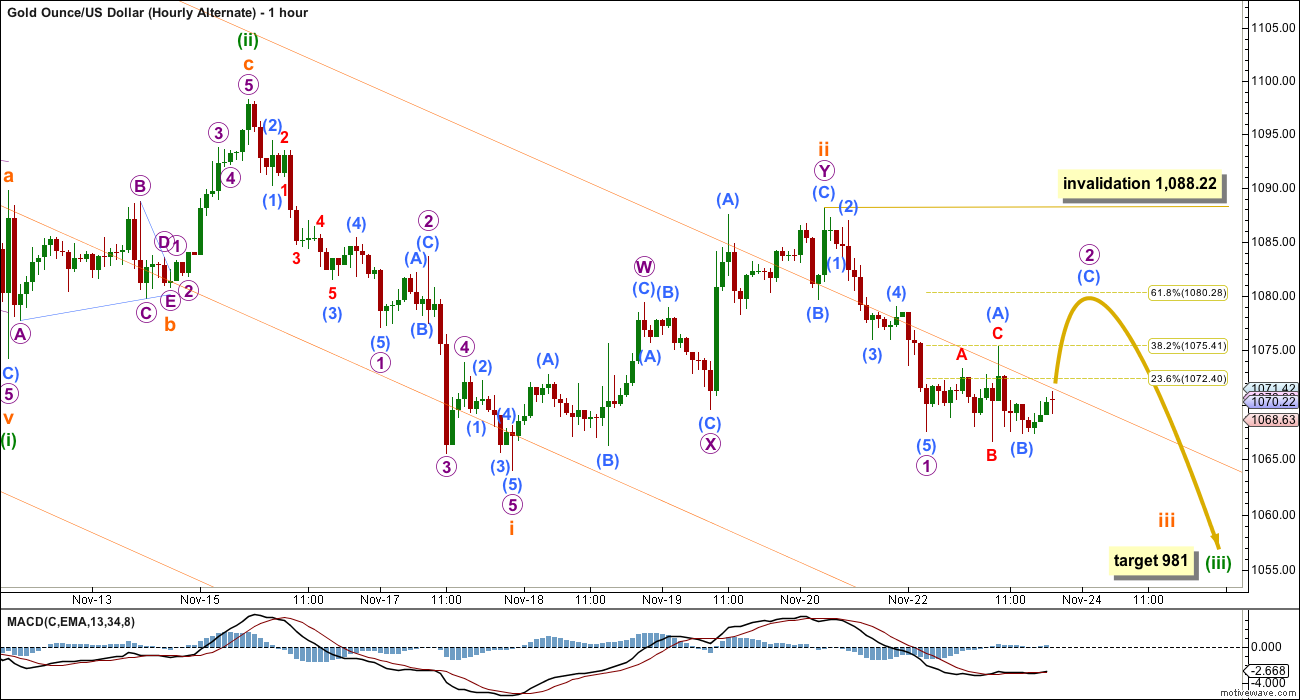
What if minuette wave (ii) was over as a brief shallow zigzag? This is technically possible, but it is extremely unlikely for the following reasons:
1. Minuette wave (ii) would not contain any green candlesticks on the daily chart.
2. Minuette wave (ii) would not have breached the channel which contains minuette wave (i).
3. Subminuette wave ii, one degree lower, has breached the channel containing minuette wave (i).
4. Subminuette wave ii is deep and time consuming in comparison to subminuette wave i.
Although we have seen a new low below 1,069.57, downwards movement is choppy and overlapping and momentum is not strongly picking up. This does not look like a typical third wave. A new low below 1,040 would force the second wave count to be discarded. At that stage, this third wave count would be the only wave count left. At that stage, I would have confidence in the target.
At 981 minuette wave (iii) would reach equality in length with minuette wave (i).
ALTERNATE ELLIOTT WAVE COUNT
Click chart to enlarge.
I am aware that this is the wave count which EWI and Danerics have. The implications are important, so I will follow this wave count daily for members here too.
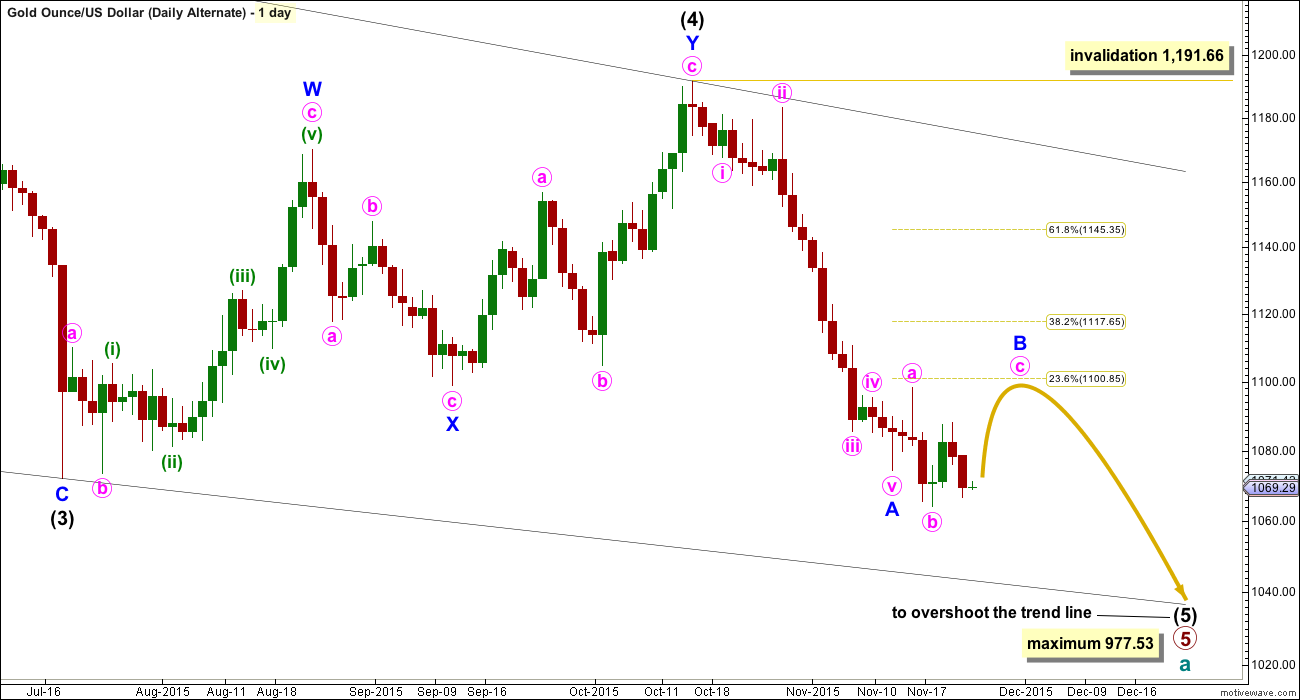
Everything is the same up to the end of the triangle for primary wave 4. Thereafter, primary wave 5 is seen as an ending contracting diagonal.
Within the ending contracting diagonal, it is not possible to see intermediate wave (2) as a zigzag and meet all Elliott wave rules. To see an explanation of why see this video at 10:25.
The same problem exists for the ending diagonal of primary wave 5 itself. Intermediate wave (3) is longer than intermediate wave (1) which would suggest an expanding diagonal, but intermediate wave (4) is shorter than intermediate wave (2) and the trend lines converge which suggests a contracting diagonal.
From “Elliott Wave Principle” by Frost and Prechter, 10th edition, page 88: “In the contracting variety, wave 3 is always shorter than wave 1, wave 4 is always shorter than wave 2, and wave 5 is always shorter than wave 3. In the expanding variety, wave 3 is always longer than wave 1, wave 4 is always longer than wave 2, and wave 5 is always longer than wave 3.”
This structure violates the rules for both a contracting and expanding variety. If the rules in Frost and Prechter are accepted, then this is an invalid wave count.
It may be that the rules need to be rewritten to add “sometimes a third wave may be the longest within a contracting or expanding diagonal”. But I have never seen Robert Prechter publish such a rule, I do not know that it exists.
I cannot reconcile this wave count from EWI with the rules in Frost and Prechter.
If an ending contracting diagonal is unfolding, then the (1) – (3) trend line may be overshot signalling the end of intermediate wave (5). If price behaves thus and turns around and moves strongly higher, then this wave count must be accepted and the rules for diagonals will need to be rewritten.
I will continue to follow this possibility as price moves lower.
Intermediate wave (5) should be shorter than intermediate wave (1). At 977.53 intermediate wave (5) would reach equality in length with intermediate wave (1). A new low below this point would take this possible diagonal structure too far from the rules. At that stage, it really should be finally discarded.
All sub waves within ending diagonals must subdivide as zigzags. Within the zigzag of intermediate wave (5), minor wave B should unfold over several days. At this stage, there is no divergence between this idea and the main Elliott wave count.
Minor wave B may not move beyond the start of minor wave A above 1,191.66.
I am uncomfortable with publishing this wave count and I only do so because it has been published by Elliott Wave International. I am not comfortable with publishing any wave count which violates the rules in Frost and Prechter. However, when looking at primary wave 5 on the weekly chart it does look like a diagonal is unfolding.
Short to mid term there is no divergence in expected direction between this wave count and the main wave count.
TECHNICAL ANALYSIS
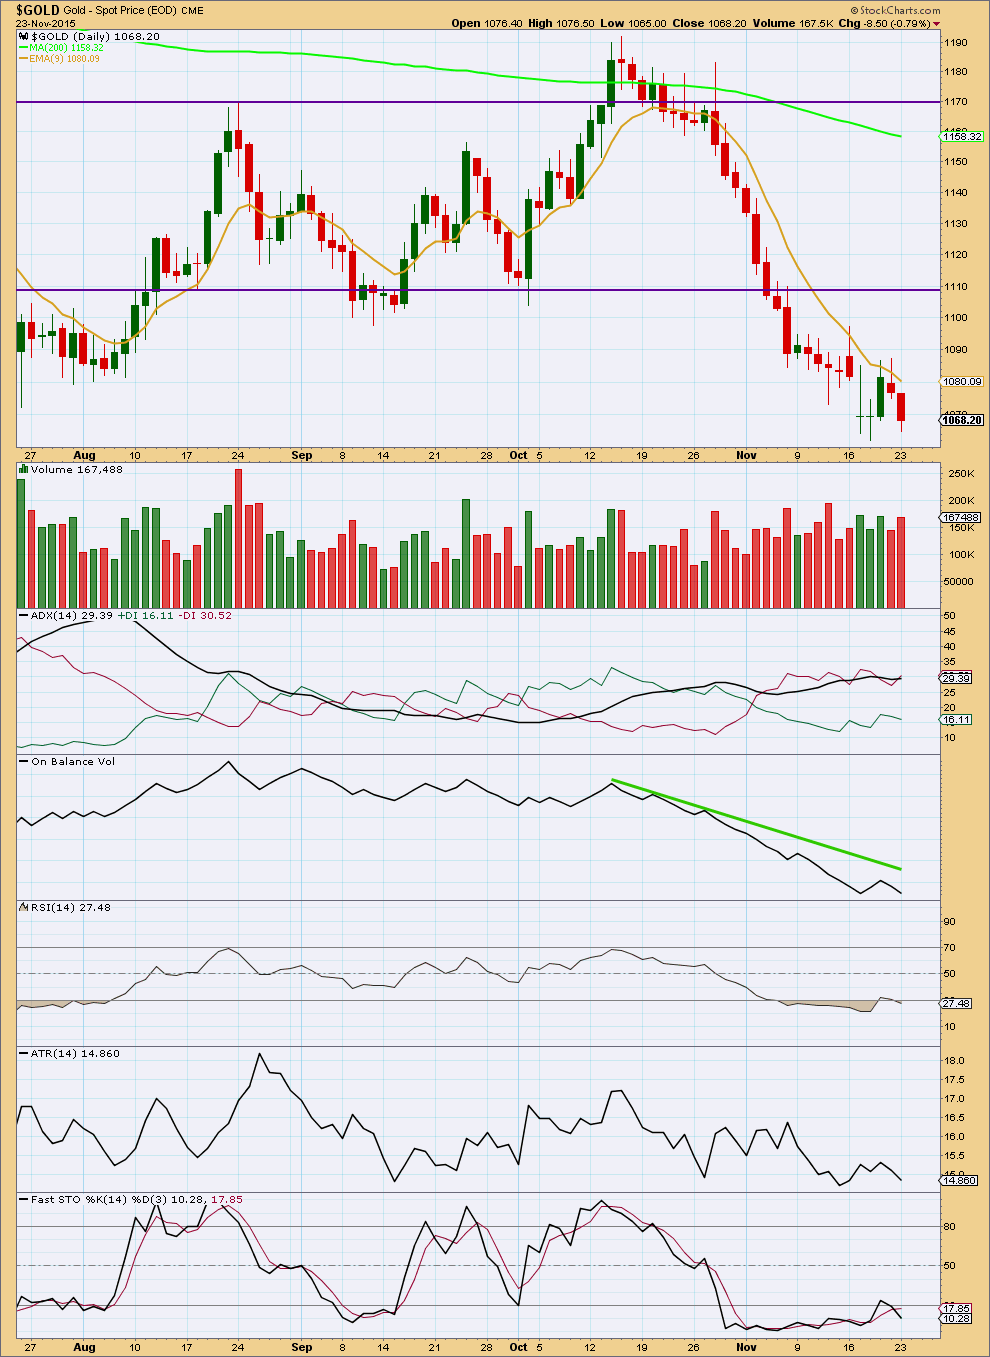
Click chart to enlarge. Chart courtesy of StockCharts.com.
Daily: Downwards movement comes with an increase in volume. The fall in price is supported by volume. ADX indicates the downwards trend is still in place. Expect any surprises to be to the downside.
On Balance Volume remains very bearish.
RSI is again oversold. Some upwards movement may again be expected to resolve this before price continues to fall.
ATR is declining indicating a correction may be currently unfolding within the downwards trend.
This analysis is published about 08:18 p.m. EST.
I’m stoked to be able to tell members today that I’ve just found out I passed my level III CMT exam.
No more exams!
I’ll begin the final process of obtaining CMT. You’ll have not just a geek, but a qualified geek working for you 🙂
Qualified geek bring it on! CONGRATULATIONS!!!!
Lara, congratulations and heartiest facilitations on your academic achiement! I am priviledged to be a subsriber here to your fantastic detailed daily analysis. Quite the very best there is. Thank you.
Congratulations, that is an impressive accomplishment
Thank you everyone.
It’s a big exam. 4 hours. I think the pass mark is about 70%.
I have an unblemished exam record, never failed one. I think I’ll quite while I’m ahead. No more exams for me! I’ve told Cesar to stop me if I sign up for anything else that needs exams LOL
Congratulations and thank you!
That’s fabulous!! Nice work!
Way to go, Lara!!!
Hi Lara. Heartiest congratulations on your great achievement. It has been, and still is, my pleasure to learn from you.
Congrats Lara! Now you can relax and enjoy your upcoming vacation. Geeks rule!
Looks to me we are following first hourly chart since gold did not make any new lows after Lara’s post. Agree/disagree? Looks like micro 3 has begun….
Yes, that looks correct.
If we see a new high above 1,088.22 the second hourly chart will be invalid, because B didn’t move lower and did not manage to reach 90% of A. So Y can’t be a flat.
Then we’ll have only one hourly wave count and expect more upwards movement.
Gold from 1934 – support line. Make your conclusion.
Lara : Note 55 months from top is coming in April 2016. (Comment on the chart.)
Nice trend line.
There’s a channel on my historic Grand Super Cycle chart here that would see support about that price area, around 980 or so I think.
About the same point on your chart.
That’s a good place for cycle wave a to end and cycle wave b to begin.
Gold starting a move up. Those not familiar with EW will say it’s because of this:
https://www.rt.com/news/323215-warplane-crash-syria-turkey/
Look at pmbull daily and see that for 4 years gold dropped down to the year end then bounced up 1 to 2 1/2 months. I’d like for that to happen again.
Any comments on that happening again the next few months?
This article confirms your observation that the month of December has been bearish during the last 3-4 years since the bear market began. During the gold bull market, some months of December were bullish and some bearish. I think it’s likely that December will be bearish again this year.
http://www.gold-eagle.com/article/nugget-gold-or-lump-coal-holiday-season