
Slow sideways movement was expected.
I have a new hourly Elliott wave count today which fits recent movement perfectly.
Summary: A triangle is most likely completing for a B wave. When it is done price should move strongly higher for a short sharp C wave to end above 1,098.25 to avoid a truncation. This would end the correction, which may end now in a further three or four trading days.
New updates to this analysis are in bold.
To see weekly charts and the difference between the two wave counts go here.
MAIN ELLIOTT WAVE COUNT
Click chart to enlarge.
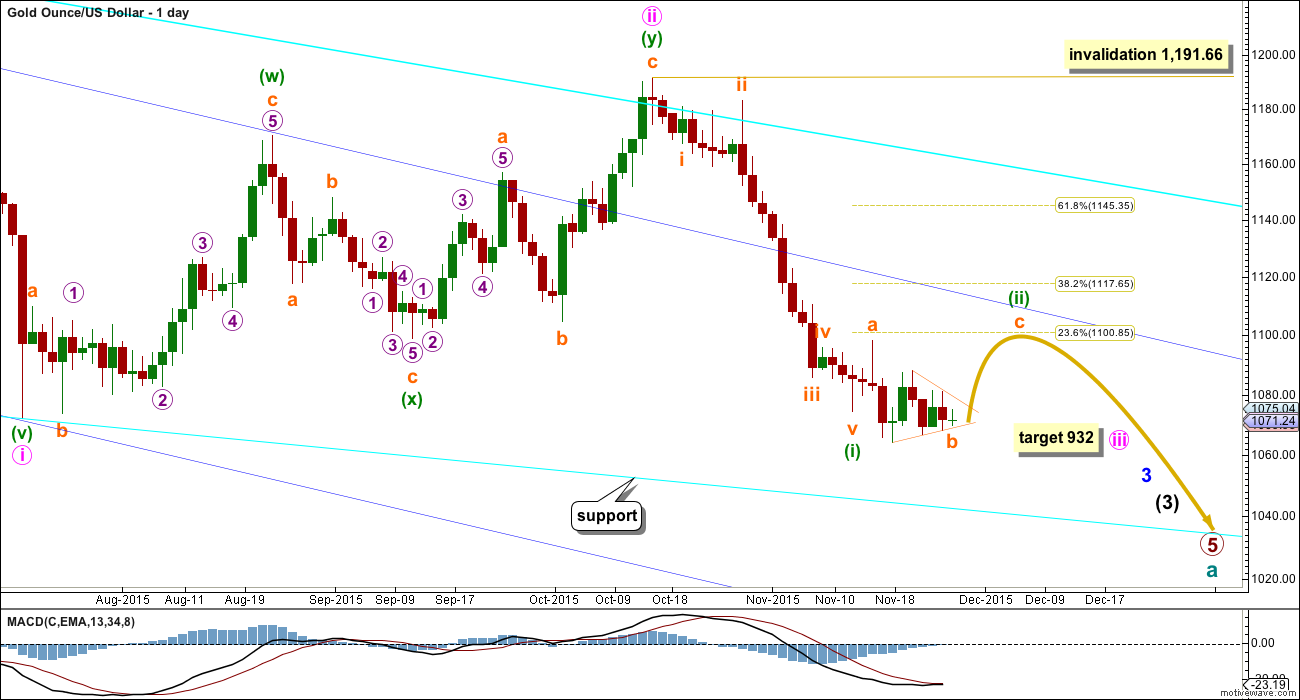
Gold has been in a bear market since September 2011. There has not yet been confirmation of a change from bear to bull, and so at this stage any bull wave count would be trying to pick a low which is not advised. Price remains below the 200 day moving average and below the blue trend line (copied over from the weekly chart). The bear market should be expected to be intact until we have technical confirmation of a big trend change.
The final line of resistance (cyan line copied over from weekly charts) is only overshot and not so far properly breached. While this line is not breached the bear wave count will remain possible. Simple is best, and the simplest method to confirm a trend change is a trend line.
Minute wave ii is a complete double zigzag and deep at 0.75 the length of minute wave i. It has breached the dark blue base channel drawn about minor waves 1 and 2, one degree higher. When a lower degree second wave correction does this it reduces the probability of the wave count but does not invalidate it. Base channels most often work to show where following corrections find support or resistance, but not always.
At 932 minute wave iii would reach 1.618 the length of minute wave i.
Draw a channel about this downwards movement using Elliott’s first technique: draw the first trend line from the end of minuette wave (i) to minuette wave (iii), then place a parallel copy on the high of minuette wave (ii).
Minuette wave (ii) is showing up on the daily chart and so far has lasted eight days. It may now complete in a total Fibonacci thirteen days, so a further three days may complete it, give or take one day either side of this expectation.
This may resolve RSI being oversold.
Using FXCM data there is a morning doji star at the last low. This supports the idea of some more upwards movement from here.
Today I have again two hourly charts which both expect a triangle is currently completing. The main hourly wave count has a much higher probability than the alternate.
MAIN HOURLY WAVE COUNT
Click chart to enlarge.
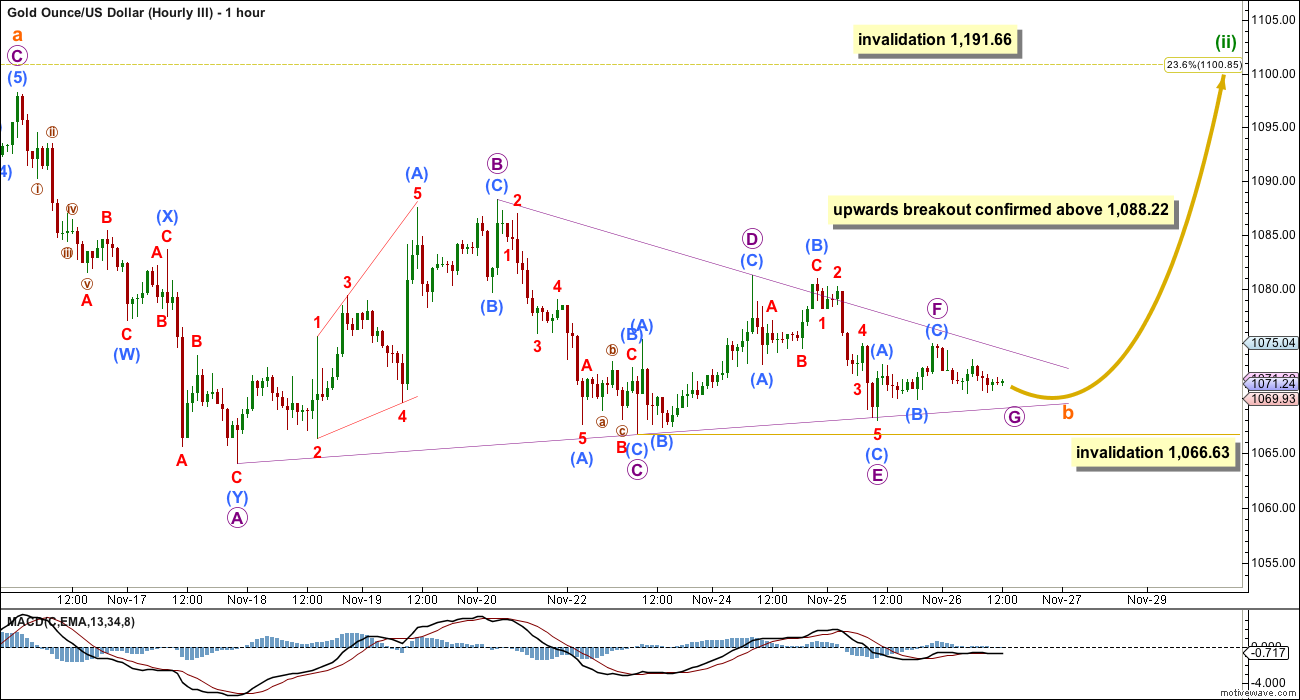
Sideways movement over the last few days subdivides perfectly as a triangle. This may be subminuette wave b completing.
The triangle may be a nine wave triangle. MACD is fluctuating about zero and flattening off as the triangle matures. This supports the wave count.
Gold has completed a nine wave triangle relatively recently. In May 2014, at the daily chart level, a big nine wave triangle completed and all subdivisions were perfect with one of the nine sub waves as a double zigzag.
One of the sub waves of this triangle is a double zigzag. All other sub waves must be threes.
If micro wave E moves any further, it may not move beyond the end of micro wave C below 1,066.63.
At its end subminuette wave b will still be over 90% the length of subminuette wave a meeting the minimum requirement for a B wave within a flat correction. It will be over 105% the length of subminuette wave a, if it ends at 1,073.02 or below, which would mean minuette wave (ii) would be an expanded flat correction.
An expanded flat correction normally has a C wave which ends reasonably beyond the end of the A wave, and is most often 1.618 or 2.618 the length of the A wave. This would see subminuette wave c most likely 38.88 or 62.91 in length, with 38.88 more likely.
When the end of submineutte wave b is known, then a target for subminuette wave c may be calculated. It is extremely likely to end above the end of subminuette wave a at 1.098.25 to avoid a truncation and a very rare running flat.
Minuette wave (ii) may not move beyond the end of minuette wave (i) above 1,191.66.
A new high above 1,081.26 would be early indication that the triangle is most likely complete and breaking out upwards. If this price point is passed by movement which is clearly upwards (not choppy and hesitating) and an increase in momentum, then confidence may be had that price is breaking out upwards.
The alternate below would be invalidated finally above 1,088.22. At that stage, full confidence may be had that price is breaking out of the triangle upwards.
ALTERNATE HOURLY WAVE COUNT
Click chart to enlarge.
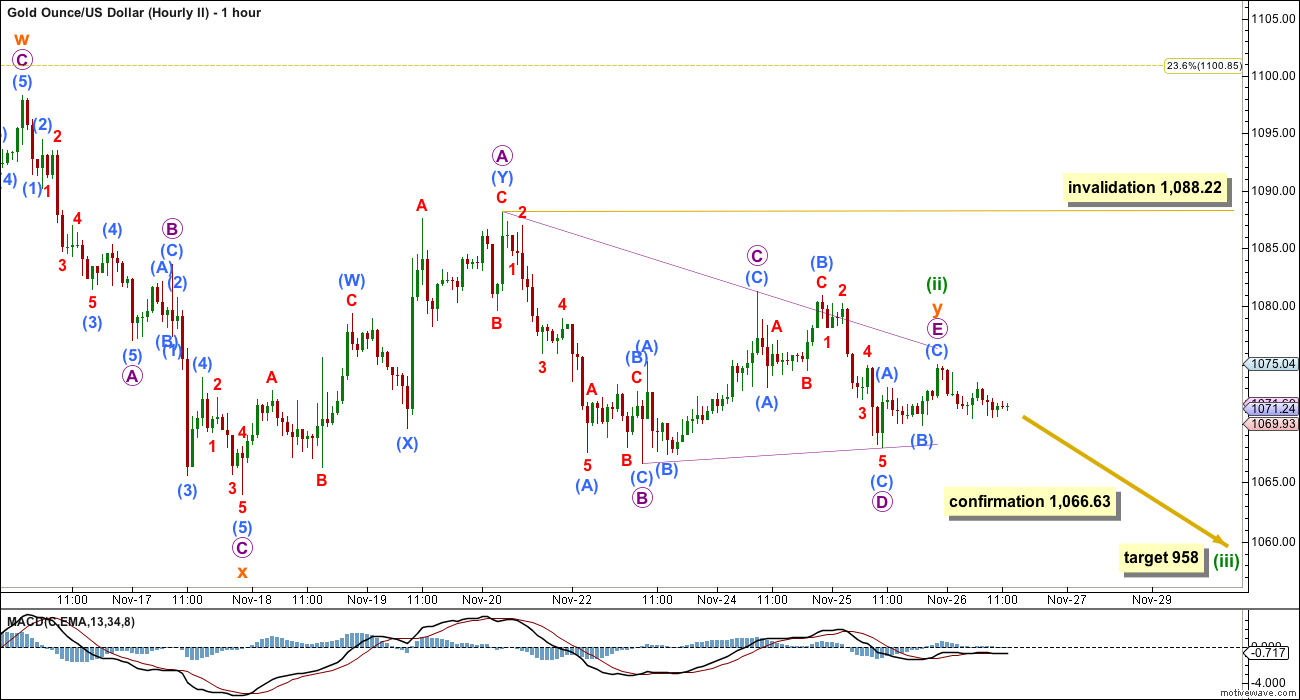
It is still possible that minuette wave (ii) is unfolding as a double combination.
The first structure in the double (off to the left of this chart now) was a zigzag labelled subminuette wave w.
The double is joined by a three in the opposite direction, a zigzag labelled subminuette wave x.
The second structure in the double now looks like it may be unfolding as a triangle which must be complete. At its end, minuette wave (ii) has barely effected a retracement of minuette wave (i). Minuette wave (i) ended at the low of 1,074.22 and minuette wave (ii) ends at the high of 1,074.99. Minuette wave (ii) has retraced only 0.65 the length of minuette wave (i). This idea has an exceptionally low probability because of this very slight retracement.
This alternate today is presented because it seems fairly obvious that a triangle is either completing or has already recently completed. It is important to consider all possibilities when triangles unfold; they are tricky structures. A new low below 1,066.63 would indicate that the triangle is complete and the breakout is downwards.
At 958 minuette wave (iii) would reach equality in length with minuette wave (i).
Within this triangle, micro wave C may not move beyond the end of micro wave C above 1,088.22. I am using this invalidation point, not the end of micro wave C at 1,081.26, because of the small overshoot of the A-C trend line. Triangles normally adhere well to their trend lines. Sometimes they may have small overshoots; most often they do not. It is possible that micro wave C is not over as labelled and is continuing further which may resolve the small overshoots.
ALTERNATE ELLIOTT WAVE COUNT
Click chart to enlarge.
I am aware that this is the wave count which EWI and Danerics have. The implications are important, so I will follow this wave count daily for members here too.
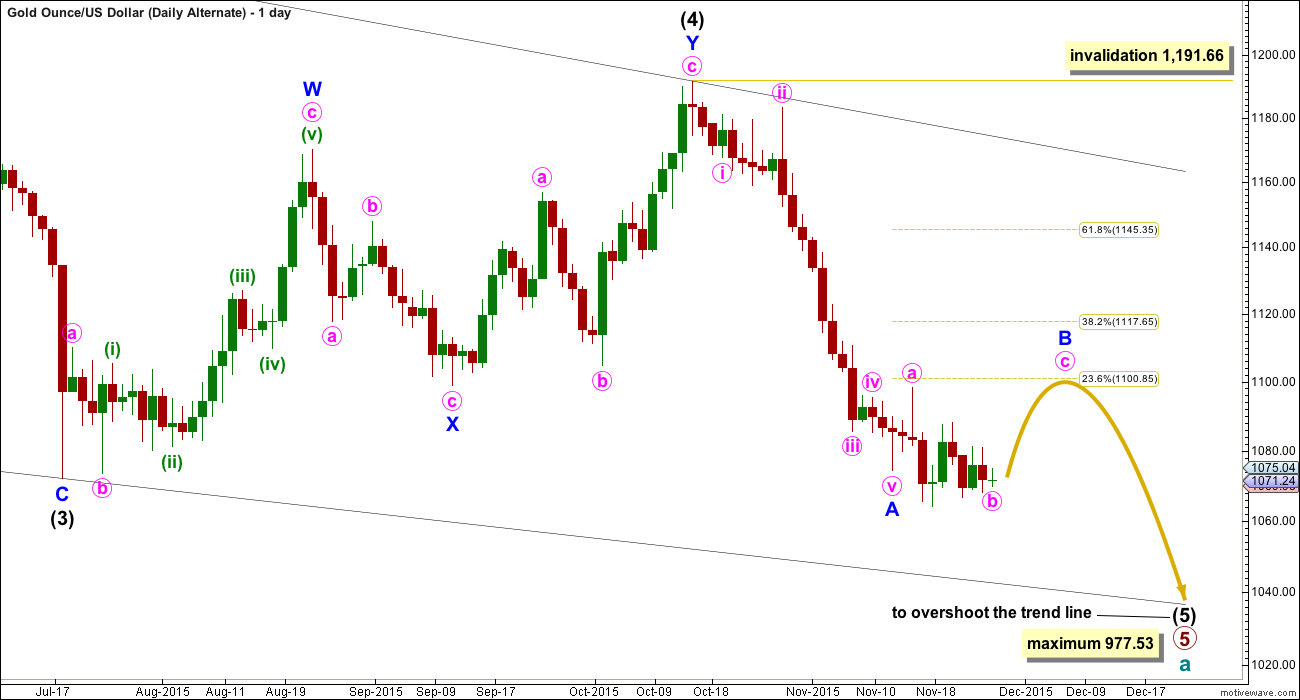
Everything is the same up to the end of the triangle for primary wave 4. Thereafter, primary wave 5 is seen as an ending contracting diagonal.
Within the ending contracting diagonal, it is not possible to see intermediate wave (2) as a zigzag and meet all Elliott wave rules. To see an explanation of why see this video at 10:25.
The same problem exists for the ending diagonal of primary wave 5 itself. Intermediate wave (3) is longer than intermediate wave (1) which would suggest an expanding diagonal, but intermediate wave (4) is shorter than intermediate wave (2) and the trend lines converge which suggests a contracting diagonal.
From “Elliott Wave Principle” by Frost and Prechter, 10th edition, page 88: “In the contracting variety, wave 3 is always shorter than wave 1, wave 4 is always shorter than wave 2, and wave 5 is always shorter than wave 3. In the expanding variety, wave 3 is always longer than wave 1, wave 4 is always longer than wave 2, and wave 5 is always longer than wave 3.”
This structure violates the rules for both a contracting and expanding variety. If the rules in Frost and Prechter are accepted, then this is an invalid wave count.
It may be that the rules need to be rewritten to add “sometimes a third wave may be the longest within a contracting or expanding diagonal”. But I have never seen Robert Prechter publish such a rule, I do not know that it exists.
I cannot reconcile this wave count from EWI with the rules in Frost and Prechter.
If an ending contracting diagonal is unfolding, then the (1) – (3) trend line may be overshot signalling the end of intermediate wave (5). If price behaves thus and turns around and moves strongly higher, then this wave count must be accepted and the rules for diagonals will need to be rewritten.
I will continue to follow this possibility as price moves lower.
Intermediate wave (5) should be shorter than intermediate wave (1). At 977.53 intermediate wave (5) would reach equality in length with intermediate wave (1). A new low below this point would take this possible diagonal structure too far from the rules. At that stage, it really should be finally discarded.
All sub waves within ending diagonals must subdivide as zigzags. Within the zigzag of intermediate wave (5), minor wave B should unfold over several days. At this stage, there is no divergence between this idea and the main Elliott wave count.
Minor wave B may not move beyond the start of minor wave A above 1,191.66.
I am uncomfortable with publishing this wave count and I only do so because it has been published by Elliott Wave International. I am not comfortable with publishing any wave count which violates the rules in Frost and Prechter. However, when looking at primary wave 5 on the weekly chart it does look like a diagonal is unfolding.
Short to mid term there is no divergence in expected direction between this wave count and the main wave count.
TECHNICAL ANALYSIS
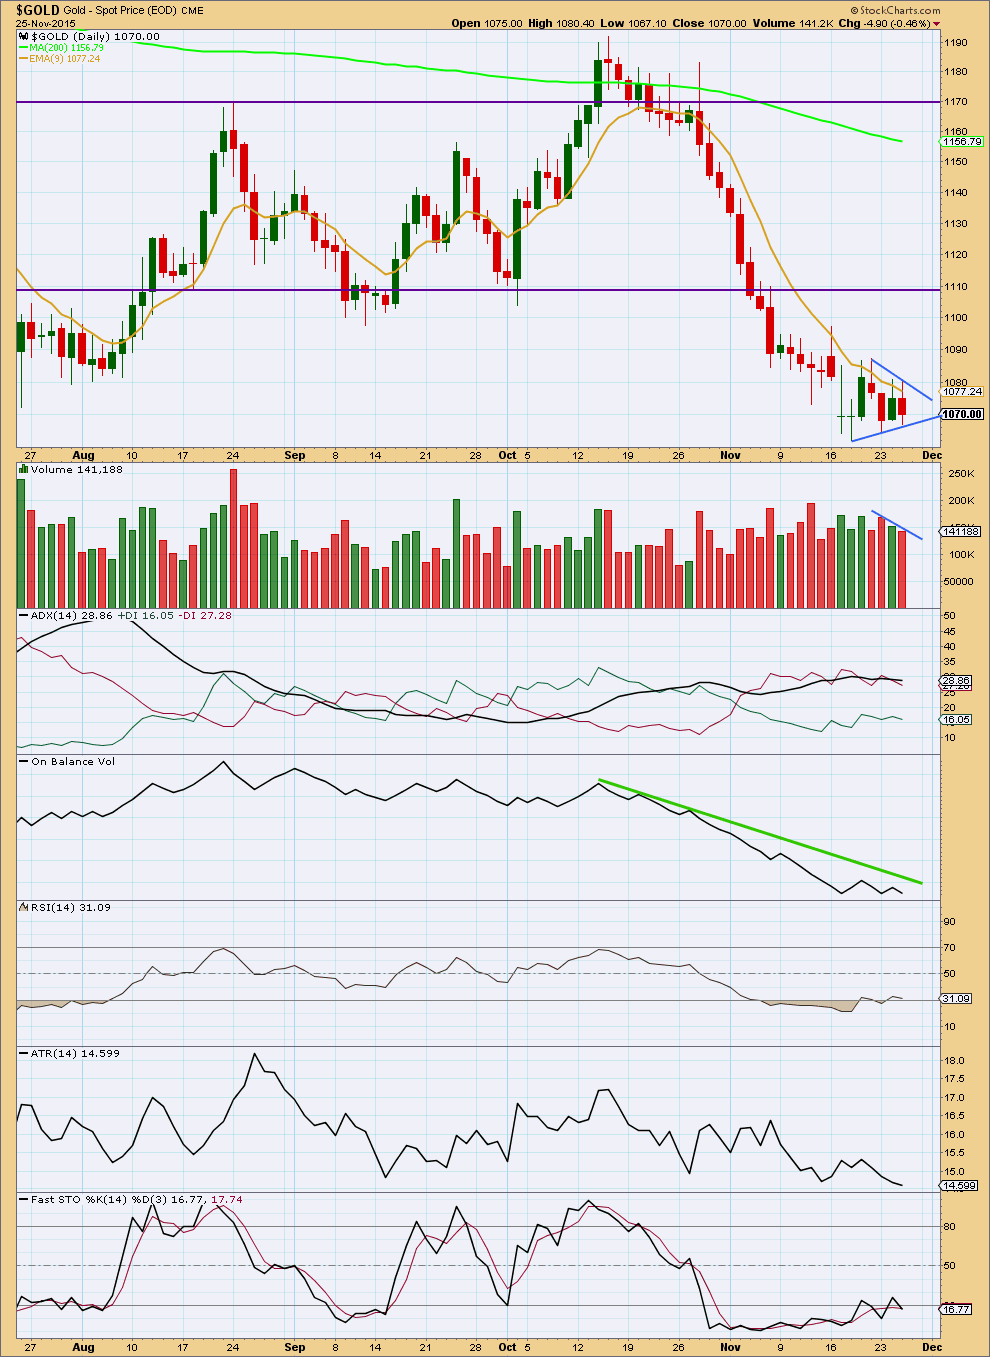
Click chart to enlarge. Chart courtesy of StockCharts.com.
Note: StockCharts data is NY session only and NY is closed for Thanksgiving today. This technical analysis will be updated next when a new daily candlestick is complete for StockCharts data.
Daily: A small triangle is forming. These are fairly reliable continuation patterns. This one is accompanied by declining volume which supports the pattern.
ADX is flattening off indicating no clear trend at this stage. ATR agrees as it is declining.
On Balance Volume remains below its green trend line and may find resistance again there, if we see an upwards day.
A breakout of the triangle would be indicated with a strong movement above or below the small blue trend lines. It should come on a day with an increase in volume for a breakout to be confirmed.
This correction is slowly resolving RSI being oversold.
This analysis is published about 04:59 p.m. EST.
Due to a U.S. federal holiday, COT data will be released on Monday or Tuesday.
FXCM has shut down their data feed while I was working.
I now have blank screens where candlesticks should be 🙁
The analysis will be published when I can again connect to FXCM data.
I’ll have a new wave count as per Dreamers chart below.
The triangle may have been a fourth wave and this downwards breakout is a fifth wave.
Fifth waves out of triangles can be surprisingly short and brief. Looking at the structure on the hourly chart for this fifth wave it cannot be complete, and so at least a little more downwards movement should unfold to complete it.
Five will = one at 1,049.78. So that should be the target for this wave to end.
Will this be your primary or alternate?
I think it should be the primary.
Ok, thanks.
The alternate is confirmed. The breakout is downwards, the correction is over.
I’ll be looking for alternates again today. But so far all TA points to a downwards breakout.
Still waiting for gold to drop more. Maybe another week or two before I am ready to buy.
11/27 Kitco Survey
“bullish sentiment reigned among market professionals, with some calling for the metal to bounce in the week ahead”
http://www.kitco.com/news/2015-11-27/Wall-St-Main-St-Drinking-The-Same-Kool-Aid-Expecting-Gold-Prices-To-Rise-Next-Week.html
Lara..
Is ther any change in crude EW counts…does the correction ended or its still pending..??
No change. Oil still needs to move higher to reach the minimum 45.65. It hasn’t done that yet. Its unfolding exactly as expected; minute wave iv upwards needs to look like a clear three wave structure, the last two red daily candlesticks are minuette (b) of a zigzag upwards.
Lara, can the alternate daily be in play(albeit with Frost & Prechter changes) with minute b completing lower?
I’ll be looking at that.
It works for both daily wave counts.
Quiet here today. People gone Black Friday shopping?
Nope.
That would require expendable $$.
Maybe later 🙂
Yes make a pot of gold profits by year end then go Boxing day and New Years sales shopping.
Gold Falls to Lowest Since 2010 as Rising Dollar Curbs Demand
November 26, 2015 — 8:10 PM EST Updated on November 27, 2015 — 10:49 AM EST
http://www.bloomberg.com/news/articles/2015-11-27/gold-heads-for-sixth-weekly-decline-as-fed-rate-decision-looms
Lara’s invalidation of the correction is below 1,066.63.
ALTERNATE HOURLY WAVE COUNT has been confirmed, main hourly invalidated.
A new low below 1,066.63 would indicate that the triangle is complete and the breakout is downwards. At 958 minuette wave (iii) would reach equality in length with minuette wave (i).
Gold at 1055 and going lower .
It will be interesting to see what COT data will be today at the close???
Gold may create a bullish divergence on RSI.MACD etc.????
The bottom may be in for now and the wave 2 correction may be starting. Let’s see..
I don’t quite like the look of the alternate hourly. The second wave has been too shallow. If it is correct, then it portends a very sharp third wave drop because the gravity of the upcoming third wave is so strong that the second wave moved upwards so insignificantly.
I’m toying with an expanded flat for minuette 2 with the B wave ending below 1060 before a larger C wave corrects upwards. In my wave count, we will have a final drop towards sub-1060. Time will see if this is correct.
I also don’t think that we go down hard from here. Your idea of an expanded flat or the idea I posted below are possibilities. The increasingly bullish COT, positive RSI divergence with price, and pending MACD cross still seem to foretell a bigger upwards correction. $USD may be forming a bearish wedge leading to a pullback that would allow gold to rise.
See my comments below. I agree with both Dreamer and Tham that there just isn’t enough torque to push gold down hard at this time. As you note correctly, COT, MACD and RSI all favor eventual upward movement.
I agree. I don’t like the look of it. I’ll be looking at alternates that see this downwards move part of wave B within an expanded flat.
I think that still looks better.
It is confirmed that wave count hourly ii is confirmed.
Gold trading at 1064.
Lara: “A new low below 1,066.63 would indicate that the triangle is complete and the breakout is downwards”
And if gold gets back in the triangle than a new wave count is needed possibilly???
Lara, any chance that we have been in a 4th wave correction and we just need a short wave 5 down before starting a wave 2 correction?
This is the direction that I am leaning. Triangles mainly come up in 4th waves and are followed by short 5th waves. I don’t expect too much more downward movement now, because the oversold condition still remains. A plunge seems like a low probability after this drawn out drop. 1040s may be the extreme end of a drop, because it is the next line of support. The coming 2nd wave may be stronger now and last a few months.
The one real factor to watch here is, and has been, the dollar, which is very close to breaking out to multiyear highs but hasn’t done so yet. Interestingly gold has broken down slightly already, but hasn’t plunged because the dollar is still holding.
Good thoughts. I favor this move down ending in the 1,050’s.
Haven’t looked at this concept in detail, (been straying away from e-wave the last while). But it goes with my views on momentum.
Yes, every chance. I’ll check the subdivisions, but this downwards move does look like a fifth wave after a fourth wave triangle.
Lara, any other short term bullish counts?
Once again, gold is not cooperating with the main count expecting a move up. The triangle broke to the downside and came close to invalidation. It is currently backtesting the triangle and may move down from here. If we stay above 1,064.02, then maybe the short term bull still has a chance…
Lara’s invalidation of the correction is below 1,066.63.
“A new low below 1,066.63 would indicate that the triangle is complete and the breakout is downwards.”
…. I really don’t see how Gold price can get back above 1078-79 with 1086-89 on the outside (subject to break above 1073-74)… an upturn in MacdMA suggests a short term rally, will remain to be seen how far up that can take Gold price…..
This post has been on this comment section before. many new comers may like the read.
Pedor’s Long term EW count is close to Lara’s Historical count.
Gold is in corrective wave after 2011 peak an entire boom from 1970 to 2011.
“At this time, the potential for a correction of the entire credit boom, precious metals included, going back to the 1970s is not appreciated by most market analysts.”
http://goldtadise.com/?p=351923
Looks like wave G might be over now or very soon at around 1069.
Could be a good time for a counter trend trade with a tight stop around 1066.
Nice, I like your new main wave count, looks more reasonable to me. Seems like gold needs a little bit of a pushup (a breather) in order to continue down.