
Last analysis expected a third wave down was most likely underway.
Further downwards movement fits the Elliott wave count perfectly so far.
Summary: A third wave down is most likely still underway. It may unfold as a zigzag as it may be a third wave within a leading diagonal. Within the third wave, the B wave may have turned up with a green candlestick for the 16th of November. The B wave may end tomorrow when the triangle trend lines cross over. Thereafter, downwards movement may resume. This third wave down must move below the end of the first wave at 42.60.
New updates to this analysis are in bold.
MONTHLY ELLIOTT WAVE COUNT
Click chart to enlarge.
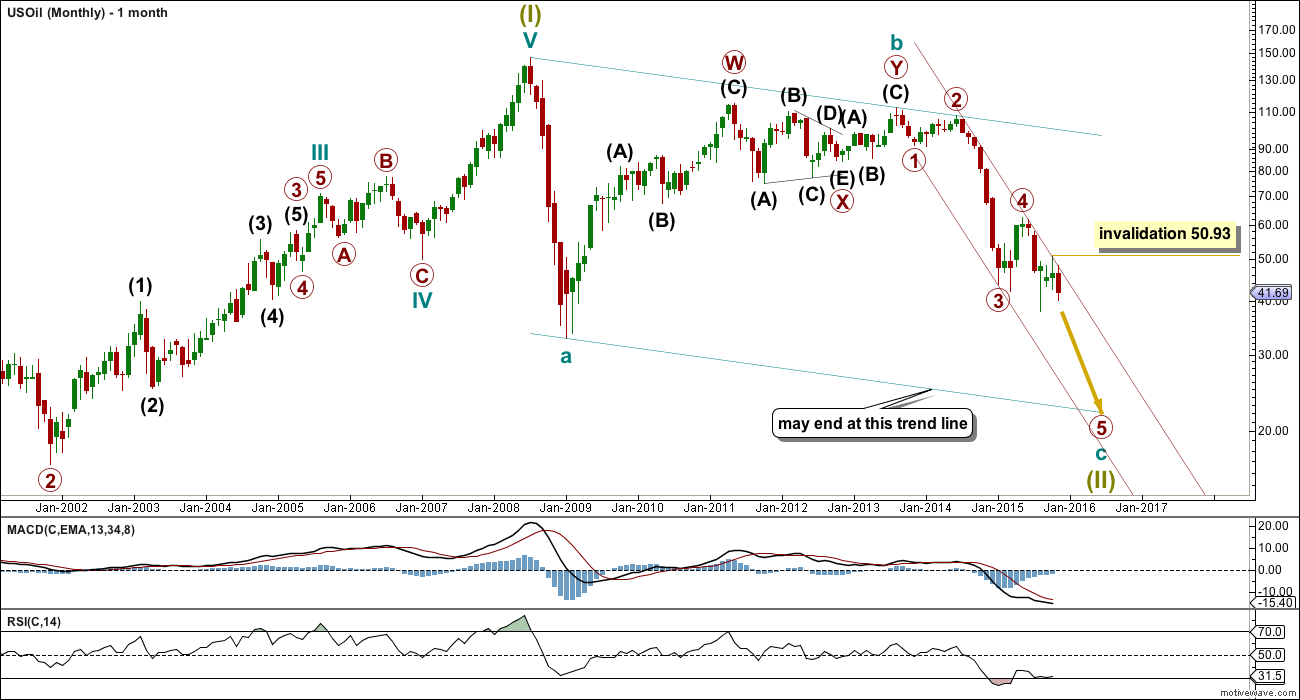
US Oil has been in a bear market since August 2013. While price remains below the upper edge of the maroon channel drawn here and below the 200 day simple moving average it must be accepted that the bear market most likely remains intact. I will not publish a bull wave count while this is the case and while there is no technical confirmation of a trend change from bear to bull.
The structure of cycle wave c is incomplete.
This wave count sees US Oil as within a big super cycle wave (II) zigzag. Cycle wave c is highly likely to move at least slightly below the end of cycle wave a at 32.70 to avoid a truncation. Cycle wave c may end when price touches the lower edge of the big teal channel about this zigzag.
It is just possible that cycle wave c could be complete at the last low of 37.75. However, that would see cycle wave c truncated by 5.05, which is a large truncation. I would consider this possibility only if it is confirmed with a clear breach of the maroon channel on the monthly chart.
Within cycle wave c, primary wave 5 is expected to be extended which is common for commodities.
Within primary wave 5, no second wave correction may move beyond its start above 62.58.
Draw a channel about this unfolding impulse downwards. Draw the first trend line from the highs labelled primary waves 2 and 4 then place a parallel copy on the end of primary wave 3. Next push up the upper trend line slightly to contain all of primary waves 3 and 4. Copy this channel over to the daily chart. The upper edge should provide resistance.
MAIN DAILY ELLIOTT WAVE COUNT
Click chart to enlarge.
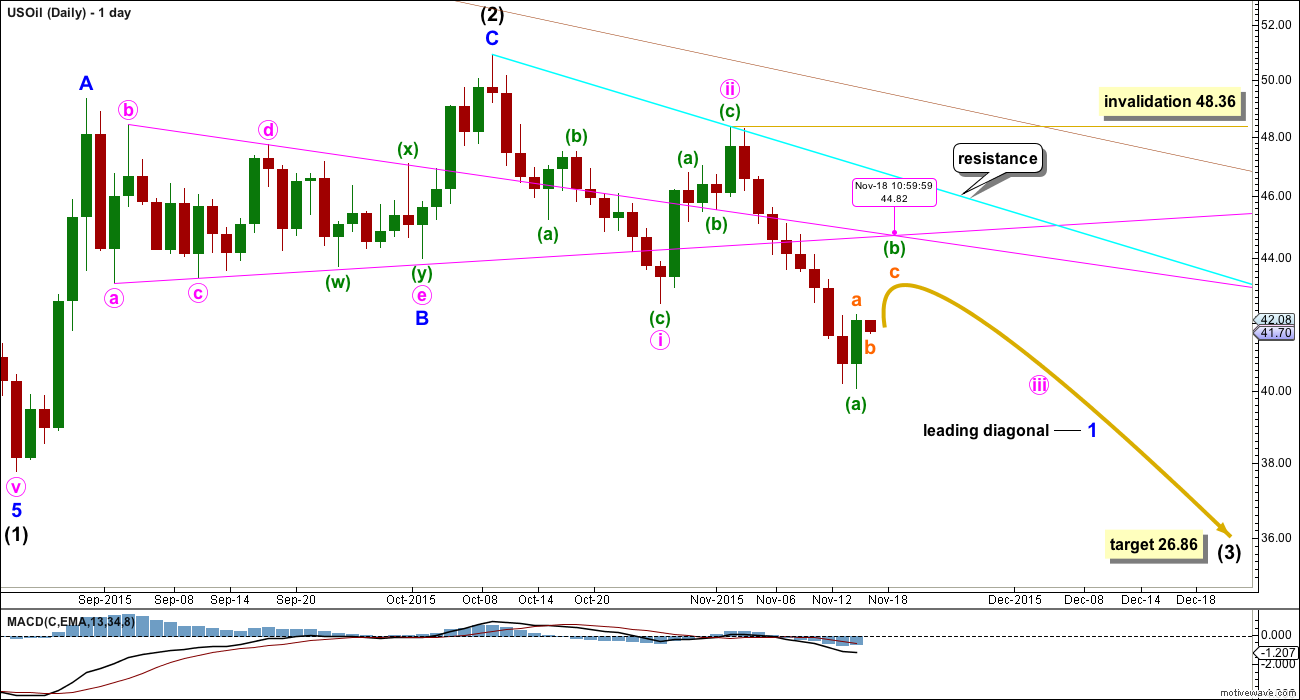
Intermediate wave (3) must subdivide as an impulse.
Within intermediate wave (3), minor wave 1 may be beginning as a leading diagonal. The most common type is contracting.
This is the main wave count because of the channel (maroon, copied over from the monthly chart). While price is reasonably close to the upper edge it looks most likely that intermediate wave (2) is over. Were intermediate wave (2) to continue further, it may have to breach the channel in order to complete.
The first, third and fifth waves are most commonly zigzags within a leading diagonal, but sometimes they may also be impulses. This is why minute wave i is labelled as a zigzag.
Minute wave ii is a competed zigzag. The normal depth for a second wave within a diagonal is between 0.66 to 0.81 the first wave. This second wave is within normal range at 0.69.
Minute wave i lasted 12 days, one short of a Fibonacci 13. Minute wave ii lasted a Fibonacci five days. Minute wave iii may last a Fibonacci eight or thirteen days in total. So far it has lasted four days and is beginning its fifth.
Actionary waves of diagonals do not normally exhibit Fibonacci ratios to each other. The only way to calculate a target with any reasonable probability for minute wave iii to end would be to use the ratio of the A and C waves within it (it is most likely to be a zigzag). This cannot be done until its A and B waves are complete.
Minute wave iii must move beyond the end of minute wave i below 42.60. Minute wave iii is most likely to be a zigzag, so on the way down a small bounce upwards for minuette wave (b) within it should be expected to show up on the daily chart. With price finding support at a horizontal trend line (shown on the technical analysis chart below), minuette wave (b) may begin here. It may not move beyond the start of minuette wave (a) above 48.36.
At 26.86 intermediate wave (3) would reach equality in length with intermediate wave (1).
Intermediate wave (1) lasted 53 days, two short of a Fibonacci 55. Intermediate wave (2) lasted a Fibonacci 34 days. If intermediate wave (3) is equal in duration as well as length to intermediate wave (1), then it may continue now for a further 29 days to last a total Fibonacci 55. Give or take up to two days either side of this expectation would be reasonable.
ALTERNATE DAILY ELLIOTT WAVE COUNT
Click chart to enlarge.
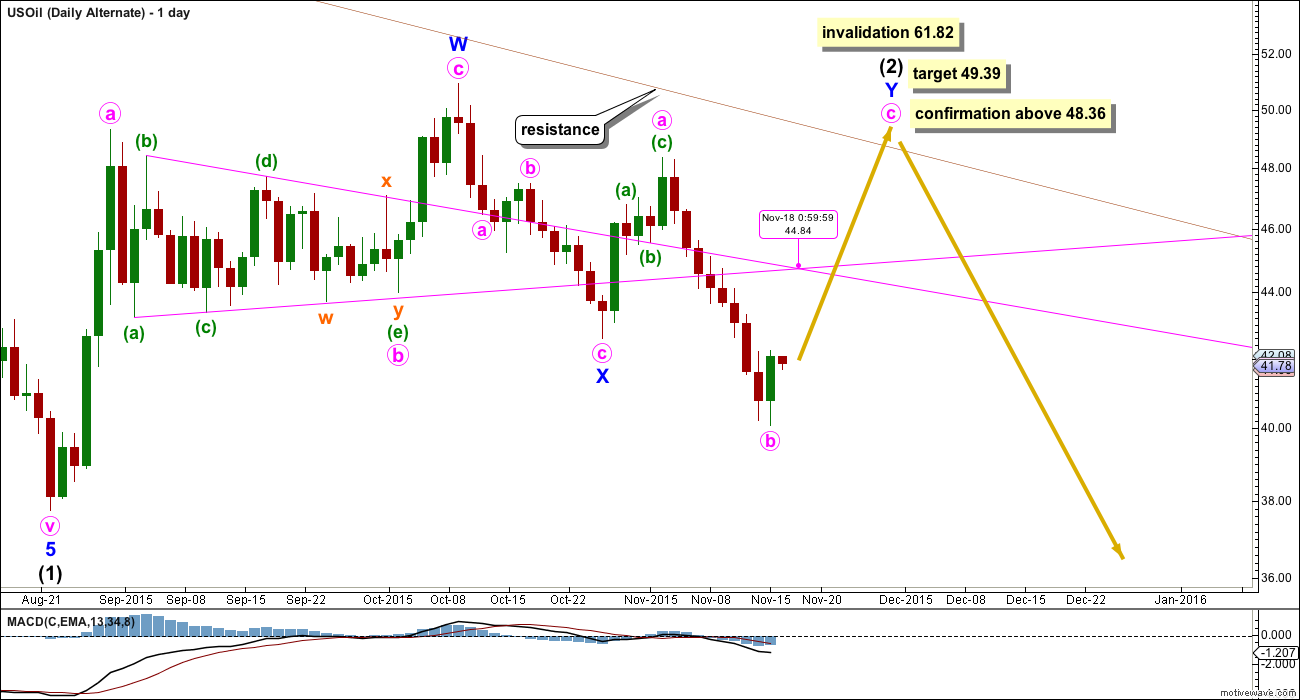
It is also possible that intermediate wave (2) is continuing. The only reason for making this an alternate is if it does continue, then it will possibly breach the upper edge of the maroon channel. That would not have the right look at the monthly chart level. I would expect the upper edge of that channel to provide strong resistance while Oil remains in a bear market.
If intermediate wave (2) does continue, then the most likely structure to remain within the channel would be a double combination. The first structure labelled minor wave W was a zigzag, so the second structure labelled minor wave Y should be a flat correction. Within it minute wave a must subdivide as a three wave structure.
Minute wave b must be a three wave structure and may move beyond the start of minute wave a. Minute wave b may now be over at 1.44 times the length of minute wave a. This is a little longer than the maximum common length of 1.38, and less than the maximum convention of 2. At 49.39 minute wave c would reach 1.618 the length of minute wave a.
A new high above 48.36 would invalidate the main wave count and confirm this alternate.
Minor wave W lasted a Fibonacci 34 days and minor wave X lasted 12 days (one short of a Fibonacci 13). Minor wave Y may last either a total Fibonacci 21 or 34 days (give or take up to two either side of each number for a reasonable expectation).
TECHNICAL ANALYSIS
DAILY CHART
Click chart to enlarge. Chart courtesy of StockCharts.com.
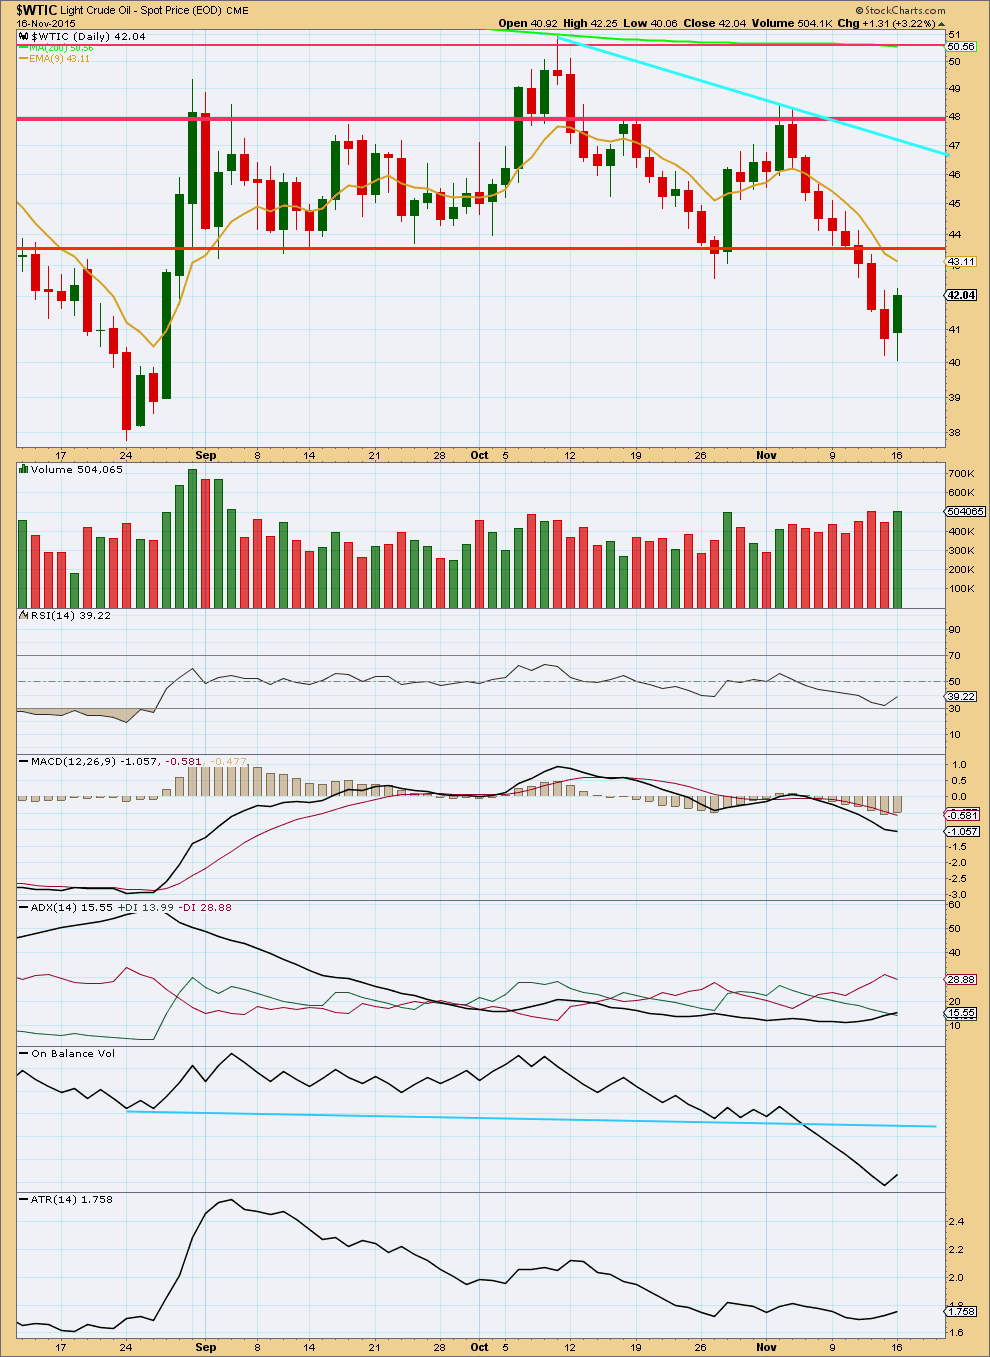
The downwards breakout which was last week strongly indicated by On Balance Volume has occurred. The first day below the lower red horizontal trend line had some rise in volume confirming a downwards breakout.
Price may now be expected to find strong resistance at the lower horizontal trend line for a throwback.
ADX now indicates a downwards trend is in place. ATR agrees as it is turning upwards.
A downwards trend should be expected at this stage. Trend lines should be used to show where upwards corrections may find resistance along the way down. The first horizontal line is most likely. Price may find resistance at the 9 day EMA first though. The cyan line would be the final line of resistance.
This analysis is published about 01:45 a.m. EST.
Lara: I am watching US oil battle around the 9ema price point for last 45min at 42.42. Wow.
And we’ve seen a trend change on 18th November, when the triangle trend lines crossed over.
Minute iii is complete. I’ll be expecting seven more days of choppy overlapping upwards movement from today, 20th November, for minute iv.
It must overlap back into minute i price territory. It can’t move above the end of minute ii at 48.36.
Thanks Lara. “It must overlap back into minute i price territory. It can’t move above the end of minute ii at 48.36.”
This chartists call backtesting. the break out. Price may get back to 43 or 45.
But as I see it in 15 min chart oil is about to make right shoulder around 42 to 42.10 with head already formed at yesterday’s high at 42.70.
Lara, your main daily wave count wave three is incomplete.
Like literally… It’s missing about 6 candles?
? the last candle is for Nov 16th… the day this was published?
What John is trying to say is that the main wave count shows up till Nov 9 while the alternate shows up to Nov 16. But it doesn’t matter now that minute 3 has ended.
Lara:How high will the wave b go to?????
It may be done already with that one green candlestick of 16th November.
Lara,
For your Main count, it looks like minute wave iii is incomplete and furthur downward movement expected. Minute wave iii will be longer in length than minute wave i if price breaks below 40.
Are you expecting a leading expanding diagonal for minor wave 1?
Or could minute wave iii have ended on Nov 16th just slightly above 40?
I expect minute iii is actually incomplete and will most likely be longer than minute i. Which means the diagonal should be expanding.
Lara thanks for the US oil report.
“ADX now indicates a downwards trend is in place. ATR agrees as it is turning upwards.”
Last time oil trended ADX was a good guide when it began and ended.
However ATR was not consistent.
Hoping to short on next turn down.
Hi Lara, wouldn’t it be unusual for the Oil to have a big drop in december?
I kind of hesitate to see a scenario where we have a big drop in oil the rest of the year, in a 3er of a 3er wave kind of scenario.
What do you think?
Thanks
Not unusual at all. December 2014 saw a drop of 16.32.