
Upwards movement was expected for the week, which is what happened overall.
Summary: Upwards movement is unfolding exactly as expected, as a zigzag. Short term the wave count does not expect a new low below 39.89. Green daily candlesticks are expected for this week to a target at 47.28, which may be reached at the end of this week or early next week.
New updates to this analysis are in bold.
MONTHLY ELLIOTT WAVE COUNT
Click chart to enlarge.
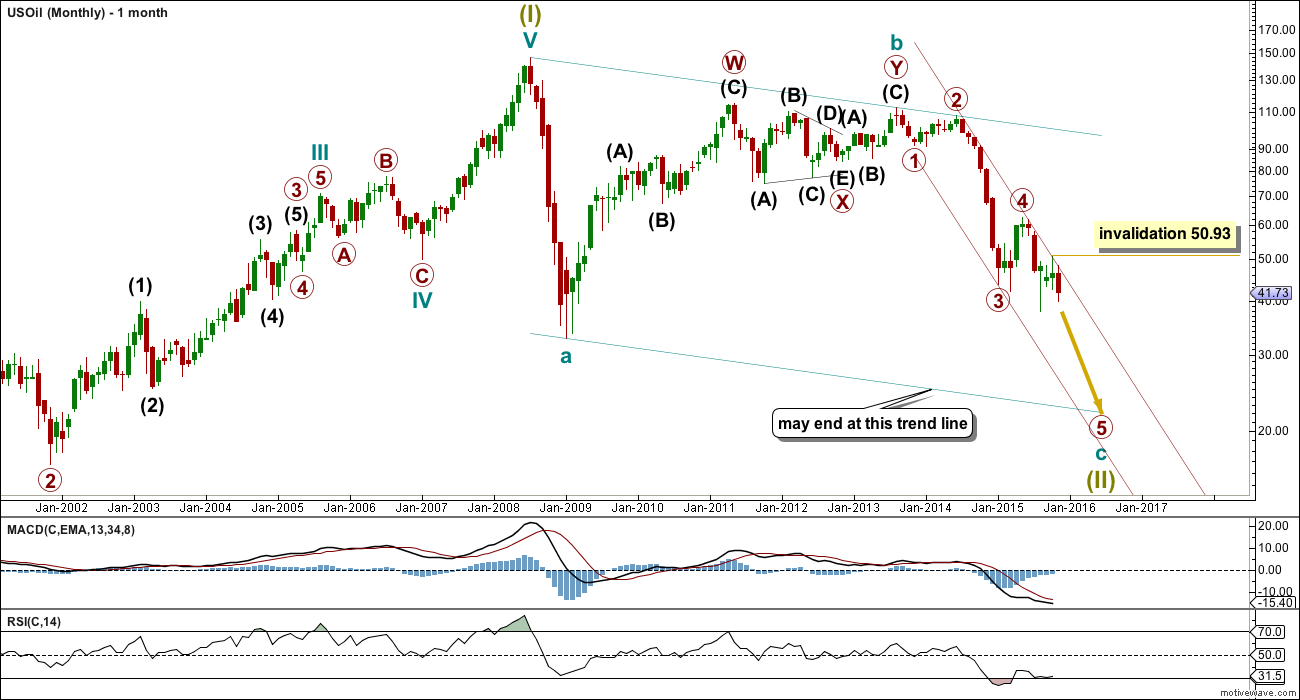
US Oil has been in a bear market since August 2013. While price remains below the upper edge of the maroon channel drawn here and below the 200 day simple moving average it must be accepted that the bear market most likely remains intact. I will not publish a bull wave count while this is the case and while there is no technical confirmation of a trend change from bear to bull.
The structure of cycle wave c is incomplete.
This wave count sees US Oil as within a big super cycle wave (II) zigzag. Cycle wave c is highly likely to move at least slightly below the end of cycle wave a at 32.70 to avoid a truncation. Cycle wave c may end when price touches the lower edge of the big teal channel about this zigzag.
It is just possible that cycle wave c could be complete at the last low of 37.75. However, that would see cycle wave c truncated by 5.05, which is a large truncation. I would consider this possibility only if it is confirmed with a clear breach of the maroon channel on the monthly chart.
Within cycle wave c, primary wave 5 is expected to be extended which is common for commodities.
Within primary wave 5, no second wave correction may move beyond its start above 62.58.
Draw a channel about this unfolding impulse downwards. Draw the first trend line from the highs labelled primary waves 2 and 4 then place a parallel copy on the end of primary wave 3. Next push up the upper trend line slightly to contain all of primary waves 3 and 4. Copy this channel over to the daily chart. The upper edge should provide resistance.
MAIN DAILY ELLIOTT WAVE COUNT
Click chart to enlarge.
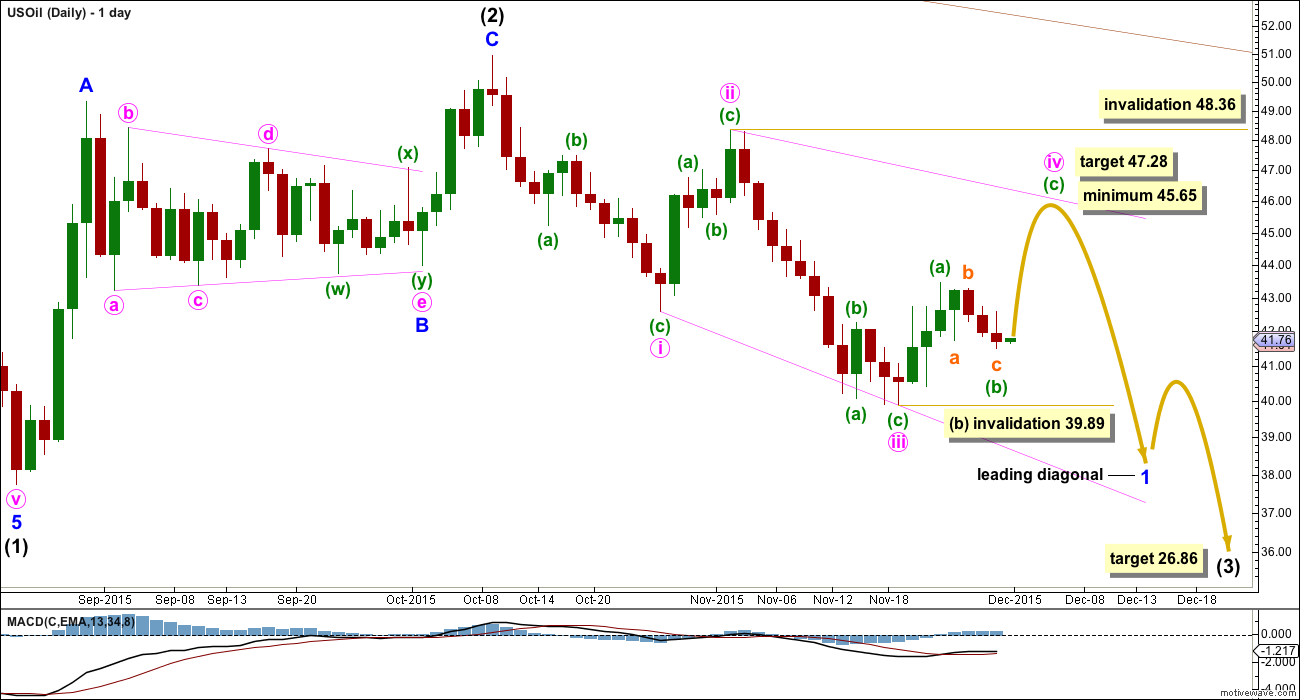
Intermediate wave (3) must subdivide as an impulse.
Within intermediate wave (3), minor wave 1 may be beginning as a leading diagonal. Minute wave iii is longer than minute wave i, so the diagonal would be expanding.
This is the main wave count because of the channel (maroon, copied over from the monthly chart). While price is reasonably close to the upper edge it looks most likely that intermediate wave (2) is over. Were intermediate wave (2) to continue further, it may have to breach the channel in order to complete.
The first, third and fifth waves are most commonly zigzags within a leading diagonal, but sometimes they may also be impulses. This is why minute waves i and iii are labelled as zigzags.
Minute wave i lasted 12 days, one short of a Fibonacci 13. Minute wave ii lasted a Fibonacci 5 days. Minute wave iii lasted 12 days, equal in duration to minute wave i and one short of a Fibonacci 13. So far minute wave iv has lasted seven days and is not very close to completion. At this stage, the expectation may be for it to continue a further six days to total a Fibonacci 13.
Minute wave iv should be longer than minute wave ii because the diagonal is expanding. The minimum for minute wave iv is 45.65. The diagonal trend lines must diverge.
Minute wave iv must overlap back into minute wave i price territory above 42.60. It may not move beyond the end of minute wave ii above 48.36.
Minute wave iv must subdivide as a zigzag. So far within it minuette waves (a) and (b) look to be complete. If minuette wave (b) moves any lower, it may not move below the start of minuette wave (a) below 39.89.
At 47.28 minuette wave (c) would reach 1.618 the length of minuette wave (a).
When minute wave iv is a completed zigzag upwards and has met the minimum requirement at 45.65, then a final zigzag downwards should be expected to unfold. Leading diagonals may not have truncated fifth waves, so the next wave down must make a new low below 39.89.
At 26.86 intermediate wave (3) would reach equality in length with intermediate wave (1).
Intermediate wave (1) lasted 53 days, two short of a Fibonacci 55. Intermediate wave (2) lasted a Fibonacci 34 days. If intermediate wave (3) is equal in duration as well as length to intermediate wave (1), then it may continue now for a further 19 days to last a total Fibonacci 55. Give or take up to two days either side of this expectation would be reasonable. If it does not manage to complete in a further 19 days (which is beginning to look unlikely), then the next Fibonacci number in the sequence may be expected, a Fibonacci 89 days in total.
ALTERNATE DAILY ELLIOTT WAVE COUNT
Click chart to enlarge.
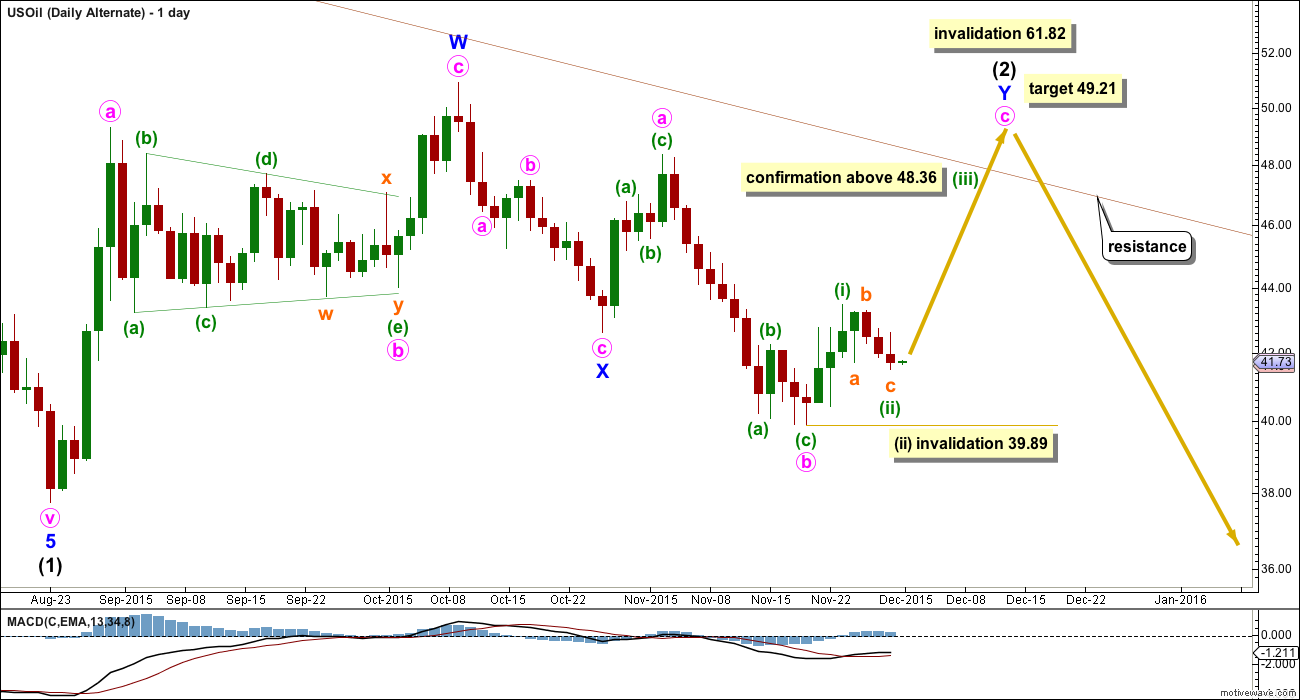
It is also possible that intermediate wave (2) is continuing. The only reason for making this an alternate is if it does continue, then it will possibly breach the upper edge of the maroon channel. That would not have the right look at the monthly chart level. I would expect the upper edge of that channel to provide strong resistance while Oil remains in a bear market.
If intermediate wave (2) does continue, then the most likely structure to remain within the channel would be a double combination. The first structure labelled minor wave W was a zigzag, so the second structure labelled minor wave Y should be a flat correction. Within it minute wave a must subdivide as a three wave structure.
Minute wave b is over and is now 1.47 times the length of minute wave a. At 49.21 minute wave c would reach 1.618 the length of minute wave a.
A new high above 48.36 would invalidate the main wave count and confirm this alternate.
Minor wave W lasted a Fibonacci 34 days and minor wave X lasted 12 days (one short of a Fibonacci 13). Minor wave Y may last a total Fibonacci 34 days (give or take up to two either for a reasonable expectation).
There is no divergence between this alternate and the main wave count in the short term. Upwards movement is expected and the invalidation point is the same. Minuette wave (ii) may not move below the start of minuette wave (i) at 39.89.
TECHNICAL ANALYSIS
DAILY CHART
Click chart to enlarge. Chart courtesy of StockCharts.com.
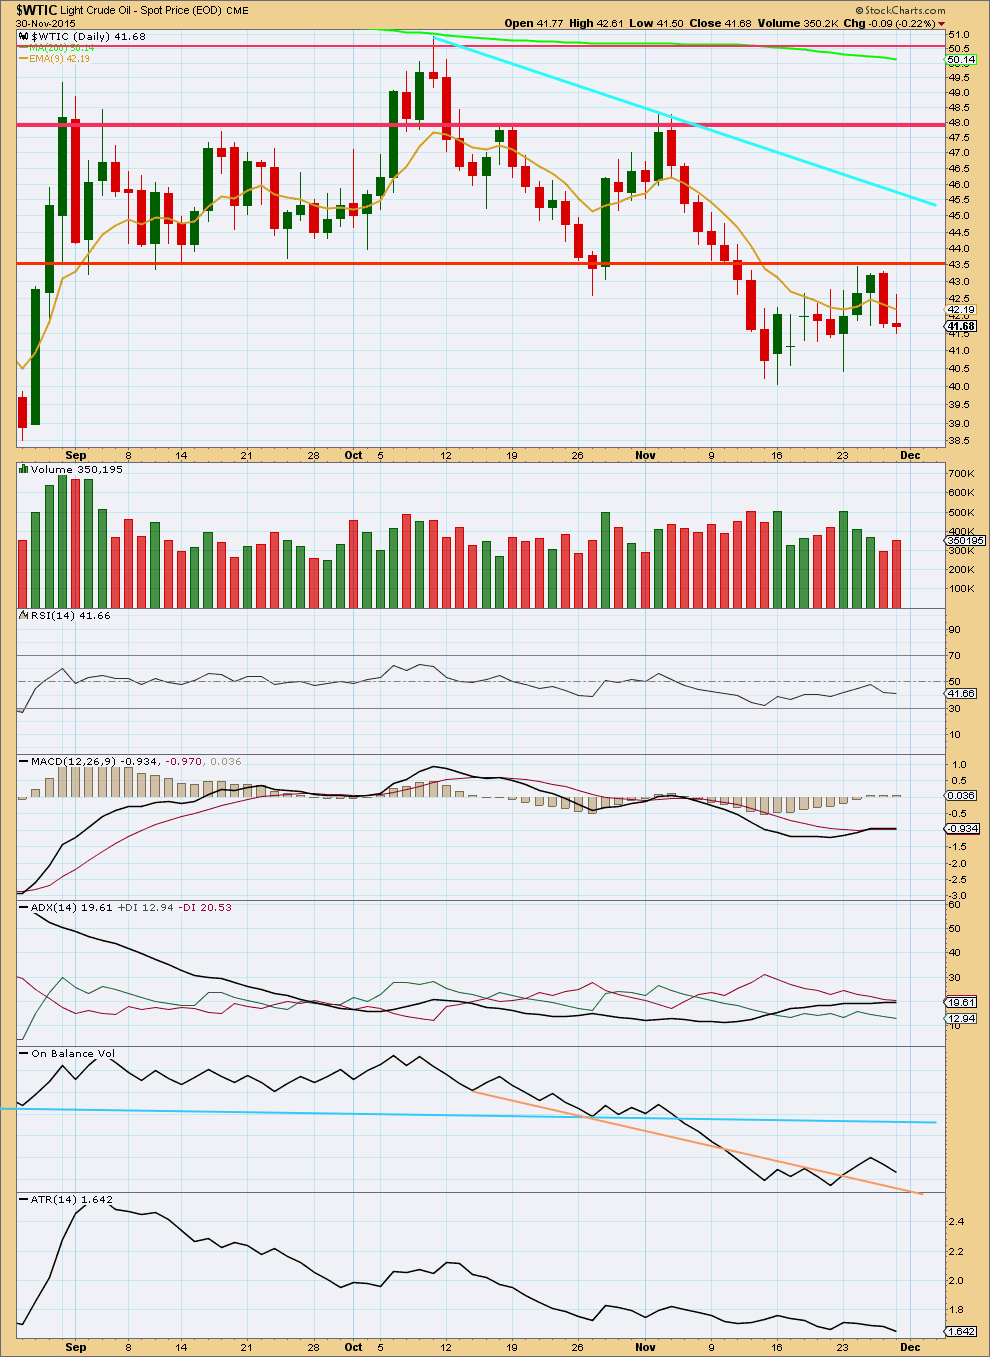
Overall, for the last five days, price is moving sideways and volume is declining. This volume profile is typical of a correction and not a trend. During upwards movement volume declined and during downwards movement volume increased. The fall in price over the last two days has some support from volume while the prior rise in price for three days in a row was not supported by volume. This supports the idea that a downwards trend remains intact and sideways movement may be a correction against the trend. This supports the Elliott wave count.
ADX still indicates a downwards trend is in place. But ATR is low and flat. This is more normal for a consolidation and not a trend. After a period of ATR declining, ATR should be expected to again show an increase as the market begins to trend again.
On Balance Volume has breached the peach trend line and may now find support there. The next line of resistance for OBV is the blue trend line. This line has been tested more often, is longer held and more shallow, and is more technically significant. It should offer strong resistance. It may assist to show where and when price finishes upwards movement this week.
In the next instance, any further upwards movement from price should find resistance at the lower red horizontal trend line. If that line is breached, then the next line of resistance is the cyan sloping line and after that the next red horizontal line. At this stage, the lower red line is providing strong resistance.
This analysis is published about 08:16 p.m. EST.
Dec 3rd short oil re-entry plan worked well.
Waiting for Lara’s report today!!!
Thanks Lara!!!!!
OPEC decision is futile, Saudi strategy is ‘doomed to failure’
Dec 4, 2015 5:46 p.m. ET
Oil to test $30 ‘sooner rather than later’: professor
http://www.marketwatch.com/story/opec-decision-is-futile-saudi-strategy-doomed-to-failure-2015-12-04
Thanks for update Lara!!!
Re-entry plan today to short US oil. Now that strong EW dictates downward move plan to buyback SCO/DWTI when oil is near 41 at back test of BO or near 9ema 41.69.
Note ADC has started trending Red D1 is pointing up as well as the black ADX is up.
And this is the alternate.
It expects more and stronger downwards movement.
None of the wave count expect any slight higher price…??…so is it a time to join the trend
With the invalidation I now have two ideas at the daily chart level.
Intermediate wave (2) must be over. So there are only two possible structures for the start of intermediate wave (3). It can start with an impulse or a leading diagonal.
The two wave counts look at those two structures. The main is only very slightly preferred because it has a slightly neater fit.
Here is the main. It expects at least a little more downwards movement to finish the zigzag of minute iii.
Leading diagonals have first, third and fifth waves which most often subdivide as zigzags.
38.33… moved lower
Is the main and alternative scenario already invalidated? Oil is breaking to new lows. Are we going to $35 in the short run?
Thanks
Lara: ” If minuette wave (b) moves any lower, it may not move below the start of minuette wave (a) below 39.89.”
Invalidation is below 39.89. It is close though!!!
I got stopped out in wild gyration yesterday. I am hoping Lara’s count is correct and oil will get back to 45-47 in wave c up to complete wave iv. !!!
Looks like we need a new wave count…
Oil breakout from consolidation. Wave iv was completed at BT.
I do not see Oil to have green or white candle now.
It is below 9ema and trending lower now.
It may be a challenge for oil to break support here once the bounce is complete. Support looks pretty significant. Gold may hit significant support at around the same time. Should be interesting…
http://blog.kimblechartingsolutions.com/2015/11/crude-oil-market-as-oversold-as-1999-lows/
Great, Oil is expected to move up all week.
Which in my opinion helps gold move up, thankfully.