
MONTHLY ELLIOTT WAVE COUNT
Click chart to enlarge.
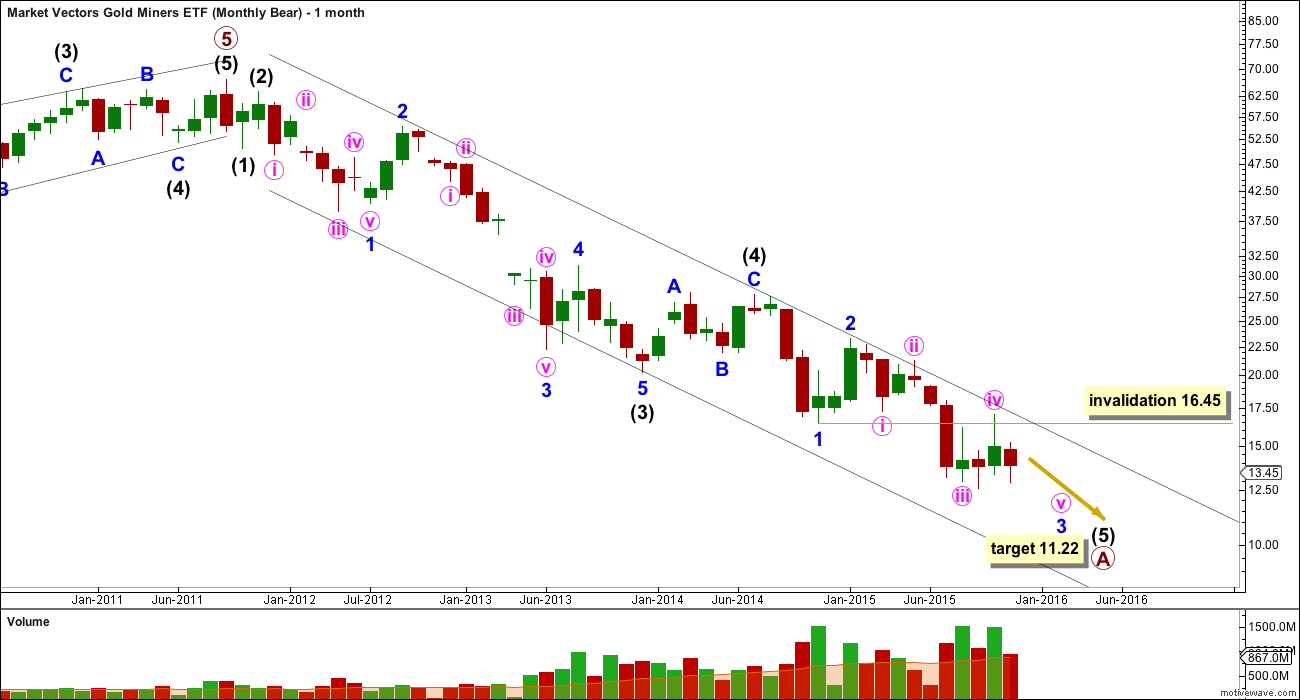
The bull wave counts for Gold have been invalidated, so I will not follow them for GDX. I will let Gold lead GDX.
GDX has been in a bear market since September 2011. While price remains below the upper edge of the channel drawn here there has been no technical confirmation of a trend change from bear to bull. The bear market should be expected to remain intact until there is confirmation it is not.
At 11.22 intermediate wave (5) would reach equality in length with intermediate wave (1).
Intermediate wave (5) must subdivide as a five wave structure, either an impulse or an ending diagonal. At this stage, it will not fit as an ending diagonal, so the more common impulse should be expected to complete.
Minor wave 4 may not move into minor wave 1 price territory above 16.45 within the impulse of intermediate wave (5).
DAILY ELLIOTT WAVE COUNT
Click chart to enlarge.
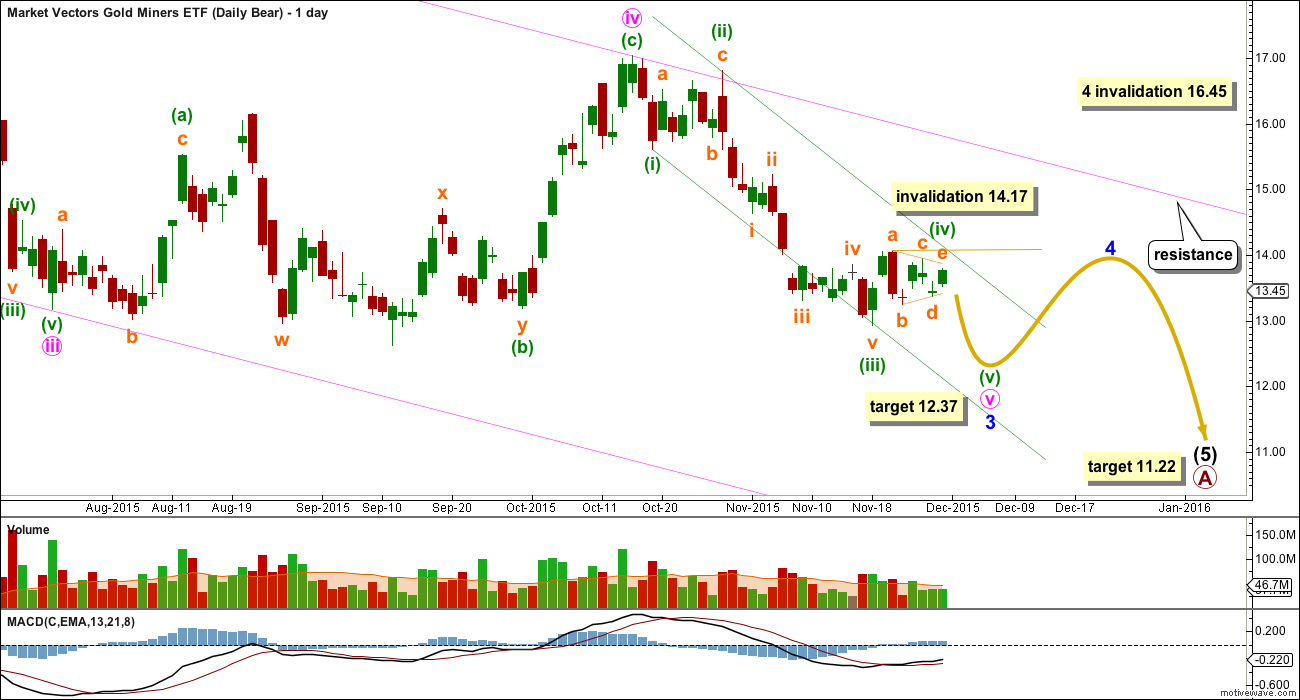
Within intermediate wave (5), minor wave 3 is close to an end.
At 12.37 minuette wave (v) would reach equality in length with minuette wave (i).
Minuette wave (iv) at this stage looks like it may be a completed regular contracting triangle. If the triangle is invalided by movement above 14.07, then this fourth wave may be morphing into a combination. At that stage, the alternate below should be used.
Minute wave v fits nicely within an Elliott channel at this stage. If price remains within the channel and moves lower, then minuette wave v may be complete. Thereafter, a breach of the channel would confirm that minuette wave v is over, so minor wave 3 should be over.
ALTERNATE ELLIOTT WAVE COUNT
Click chart to enlarge.
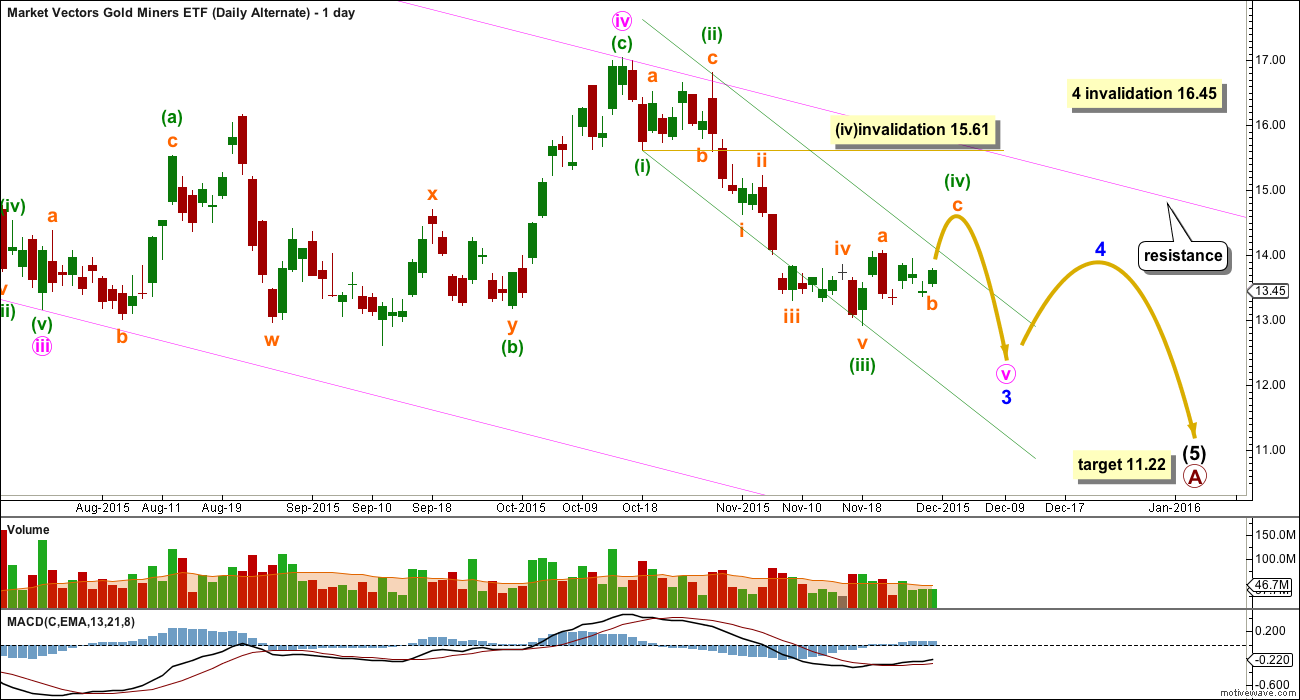
It is also possible that the triangle is subminuette wave b within a zigzag for minuette wave (iv).
This would see minuette wave (iv) move higher for a couple to a few days. It may not move into minuette wave (i) price territory above 15.61.
This idea must have a lower probability because it would see minuette wave (iv) breach the Elliott channel and there would be less alternation between minuette waves (ii) and (iv).
TECHNICAL ANALYSIS
Click chart to enlarge.
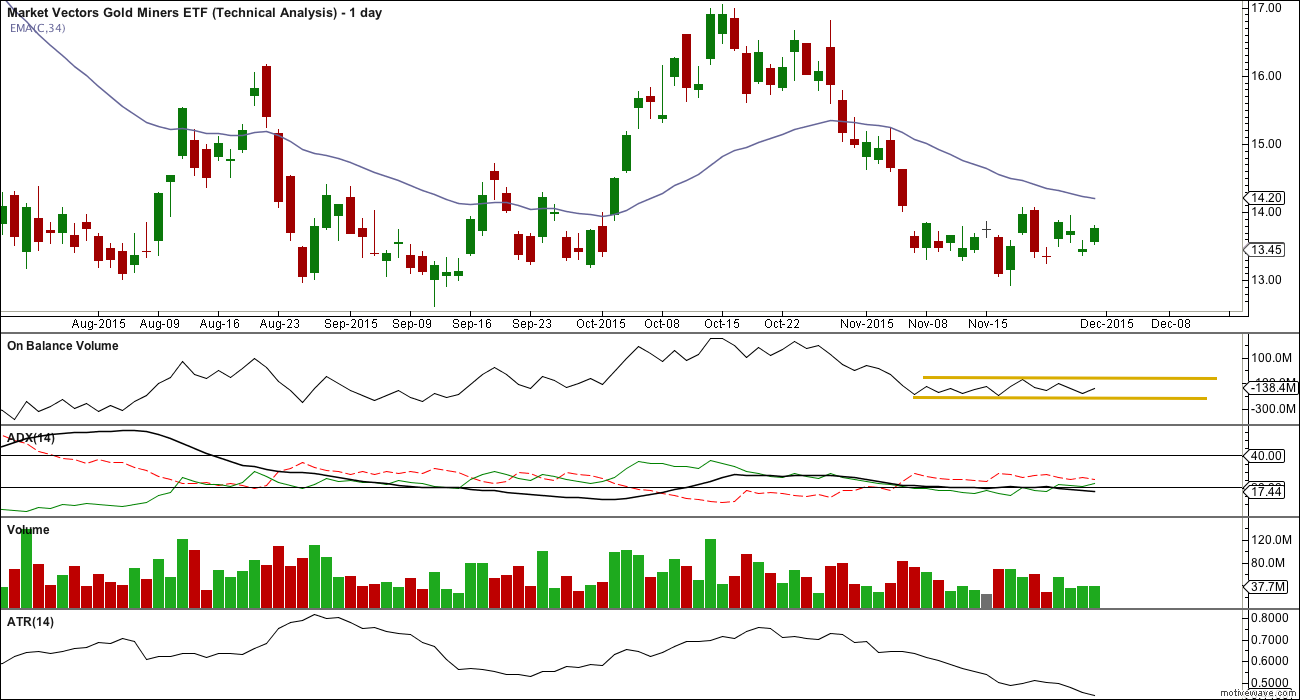
ADX indicates there is no clear trend. ATR agrees as it is declining.
On Balance Volume sits between two parallel trend lines. A break out of this range by OBV may precede price direction.
As price moves sideways volume declines. There is no support for upwards days. Overall, the volume profile for recent movement looks more bearish than bullish.
Hi Lara..
Always appreciate the additional GDX analysis.
Is there a reason why this Dec 1 analysis did not have Dec 1 price candle?
Today’s price and volume action sort of shuts down the main count thesis………making the alternate the only viable option at the moment.
It also brings into play the bottoming diamond breakout up calculation which projects an 81% move to 14.50-14.75 according to Bulkowski. This pattern is especially evident on an hourly GDX chart to which I understand you don’t have access.
Reference:……http://thepatternsite.com/diamondb.html
This 14.50 target also supports your c/(iv) target area in your alternate count.
Chart is courtesy of http://www.freestockcharts.com
*****
However….I have found from experience in trading the miners since the 80’s (but not scientific testing) that GDX, more often than not, leads gold at turning points….
You say instead that you will let gold lead GDX…I am open to new learning but prone to favouring rigourous testing of ideas…can you point me to any published work that has documented which leads what?
What I mean by I will let Gold lead GDX is I will let my EW analysis of Gold lead my GDX EW analysis. Not that I think Gold leads GDX.
The data I used was what was available today from Yahoo Finance. I import the data into Motive Wave.
So the alternate is viable and the triangle was invalidated. That’s okay. I suspected it would be due to Gold moving strongly higher.
Nice chart and target. We might get a back test before moving up to the target.
When would you wake up????
Gold Miners/GDX are in a bear market since 2008 and making huge A-B-C in the case of GDX and many other miners is expanded flat and this is wave C impulse which will finish the bear market not wave A.
You have not read the comments policy.
This comment is unnecessarily rude. You are blacklisted.
If you insist on a different wave count then a chart or link to a chart would be appropriate. A nasty tone is not.