
Downwards movement on lighter volume fits the profile of a continuing correction for Gold.
Summary: This correction may still be unfolding as either a single or double flat. The structure is incomplete. It may end in two more days, if it totals a Fibonacci thirteen.
New updates to this analysis are in bold.
Notice: I have changed my data feed. Previously I had used FXCM Gold spot data. Now I have subscribed to BarChart and will receive data from COMEX for Gold spot (cash) prices. This data should be more reliable. BarChart receives it directly from the exchange.
To see weekly charts and the difference between the two wave counts go here.
MAIN ELLIOTT WAVE COUNT
Click chart to enlarge.
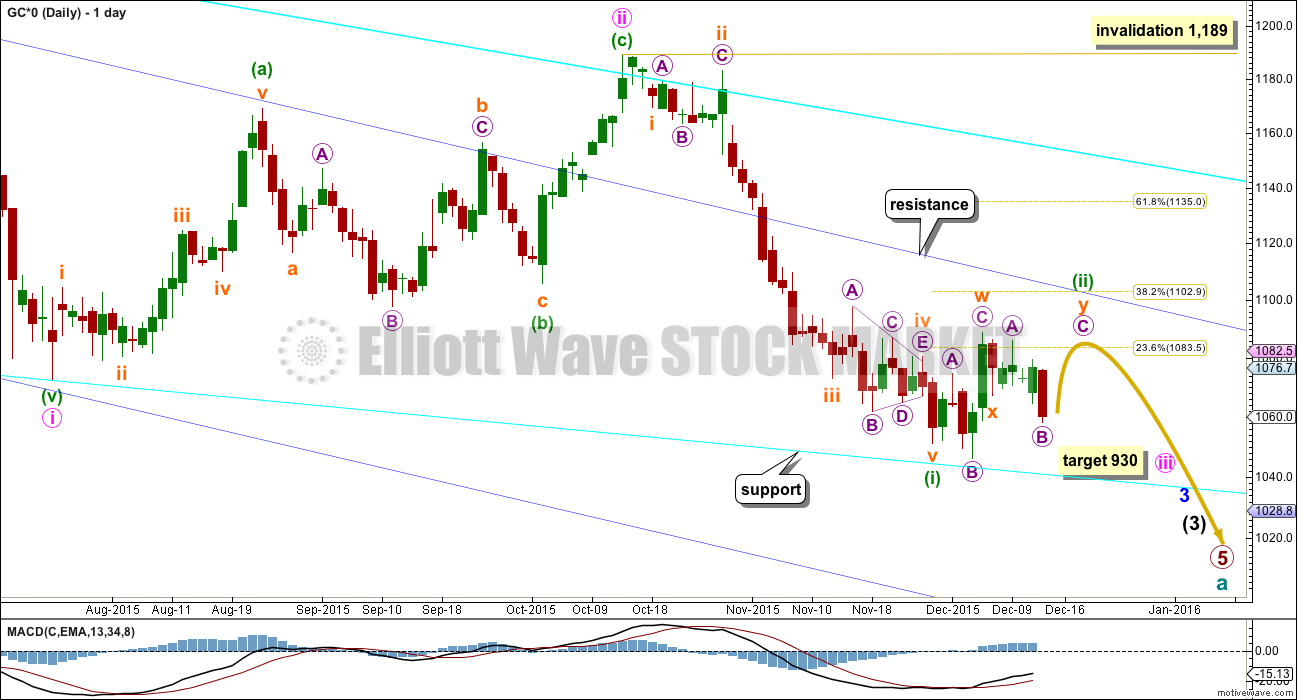
Gold has been in a bear market since September 2011. There has not yet been confirmation of a change from bear to bull, and so at this stage any bull wave count would be trying to pick a low which is not advised. Price remains below the 200 day moving average and below the cyan trend line (copied over from the weekly chart). The bear market should be expected to be intact until we have technical confirmation of a big trend change.
The final line of resistance (cyan line copied over from weekly charts) is only overshot and not so far properly breached. While this line is not breached the bear wave count will remain possible. Simple is best, and the simplest method to confirm a trend change is a trend line.
Minute wave ii is a complete double zigzag and deep at 0.75 the length of minute wave i. It has breached the dark blue base channel drawn about minor waves 1 and 2, one degree higher. When a lower degree second wave correction does this it reduces the probability of the wave count but does not invalidate it. Base channels most often work to show where following corrections find support or resistance, but not always.
At 930 minute wave iii would reach 1.618 the length of minute wave i.
Minuette wave (i) is complete.
Minuette wave (ii) may find resistance at the upper dark blue trend line. This may see it end about the 0.382 Fibonacci ratio of minuette wave (i) at 1,103.
Minuette wave (ii) has lasted eleven days so far. If it continues now for a further two, it may total a Fibonacci thirteen.
I have three hourly wave counts again today presented in order of probability. The third is very unlikely.
A note about the new data from COMEX: The end of minuette wave i has moved to the price low on 24th July. This changes the structure of minuette wave ii. This wave count now has a better fit, minuette wave ii fits perfectly as a single zigzag. The end of minute wave ii is changed to 1,189.
MAIN HOURLY WAVE COUNT
Click chart to enlarge.
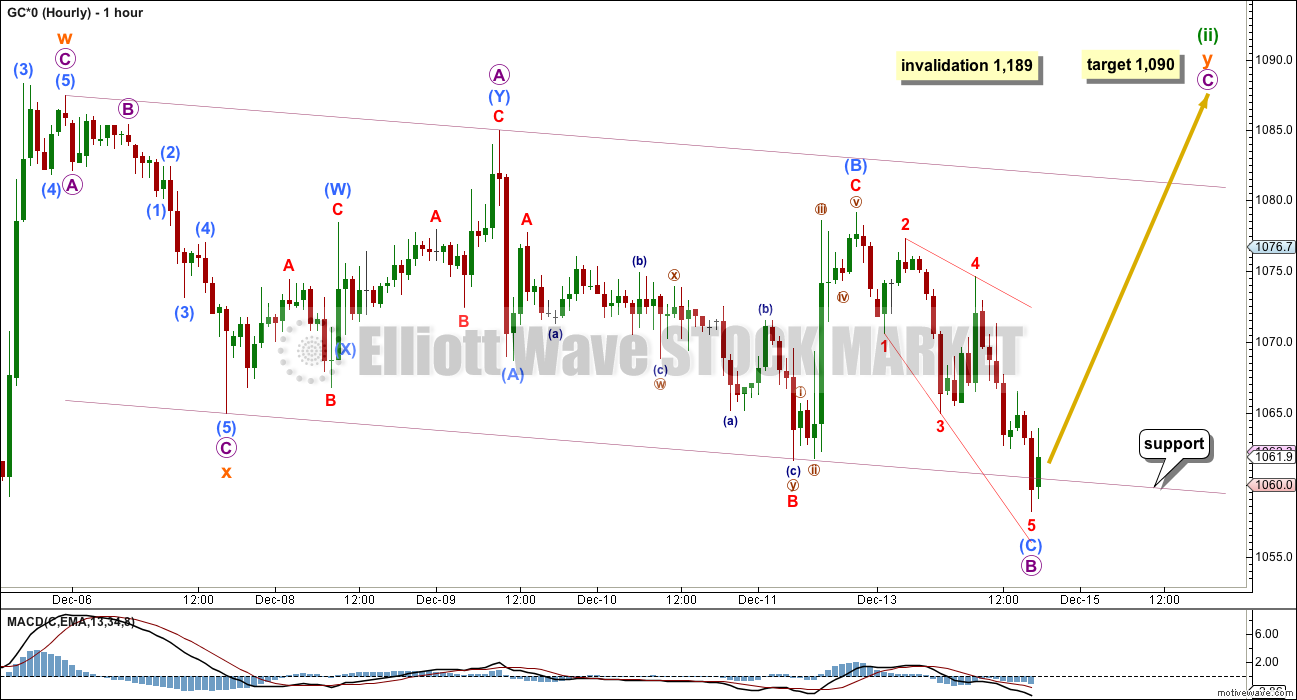
This main wave count still looks at minuette wave (ii) as an incomplete double flat correction, but today subminuette wave x is seen as over sooner.
This has better proportion between subminuette waves w and y, and the subdivisions within subminuette wave y have a better fit. This may now see the correction over in just one or two days, with two more likely.
Within the second flat of subminuette wave y, micro wave B is a 1.345 length of micro wave A, within the normal range of 1 to 1.38.
At 1,090 micro wave C would reach 1.618 the length of micro wave A.
FIRST ALTERNATE HOURLY WAVE COUNT
Click chart to enlarge.
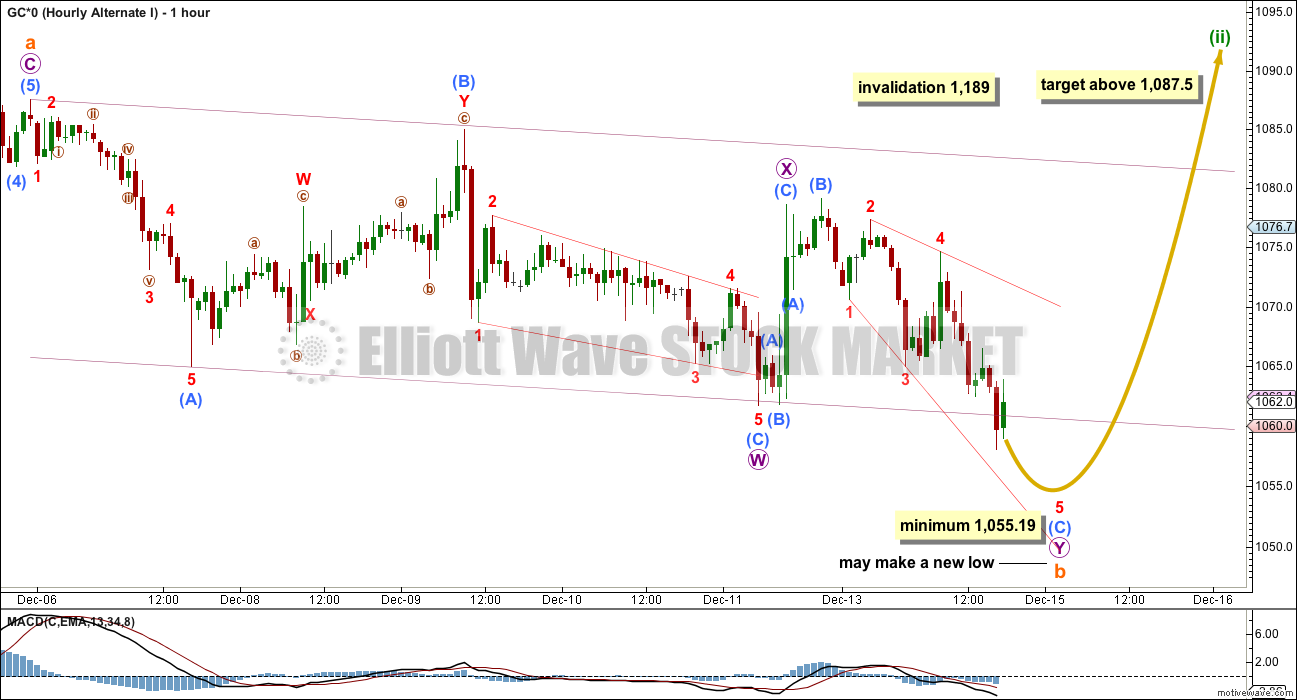
This first alternate wave count again looks at the possibility that minuette wave (ii) may still be a single flat correction.
Subminuette wave a is itself an expanded flat within the flat correction. Subminuette wave b must retrace a minimum 0.9 length of subminuette wave a at 1,055.19.
When subminuette wave b is complete, then the type of flat would be known and a target for subminuette wave c may be calculated. Subminuette wave c would be likely to end at least slightly above subminuette wave a at 1,087.5 to avoid a truncation.
Subminuette wave b may make a new low below the start (and the price extreme) of subminuette wave a. There is no lower invalidation point for this wave count for this reason.
This second idea may need more time to complete this structure. It may continue for a further ten days, so that minuette wave (ii) lasts a Fibonacci twenty one days in total.
SECOND ALTERNATE HOURLY WAVE COUNT
Click chart to enlarge.
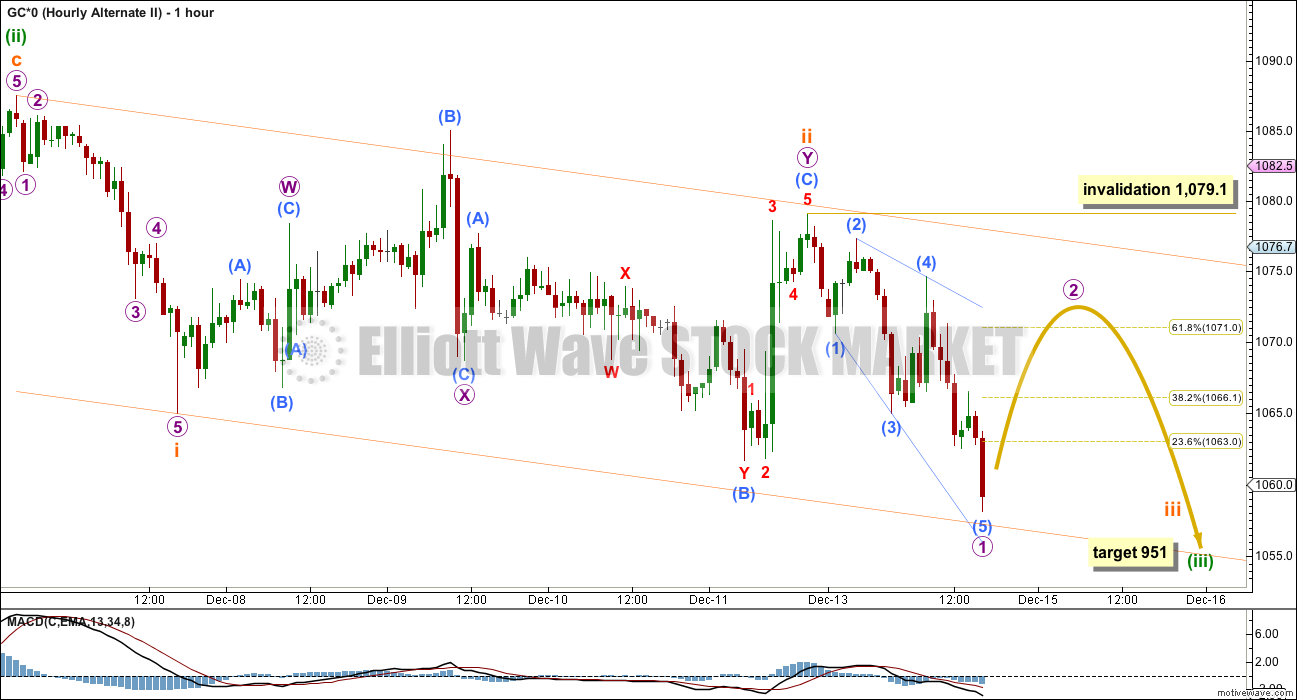
This second alternate wave count is least likely. It looks at minuette wave (ii) as a complete expanded flat.
This would be a very quick and shallow second wave correction, but the possibility must be considered.
If the main wave count is correct (as opposed to the alternate daily wave count below), then there should be a strong downwards pull from the middle of a big third wave at this stage. Surprises to the downside may turn up.
For this wave count a third wave down is expected. The following correction for a fourth wave may not move back into first wave price territory. The structure of downwards movement should indicate which of the two alternate wave counts is correct.
With subminuette wave ii now possibly a time consuming and deep double combination, the probability of this idea has further decreased. It is presented to consider all possibilities, as a what if.
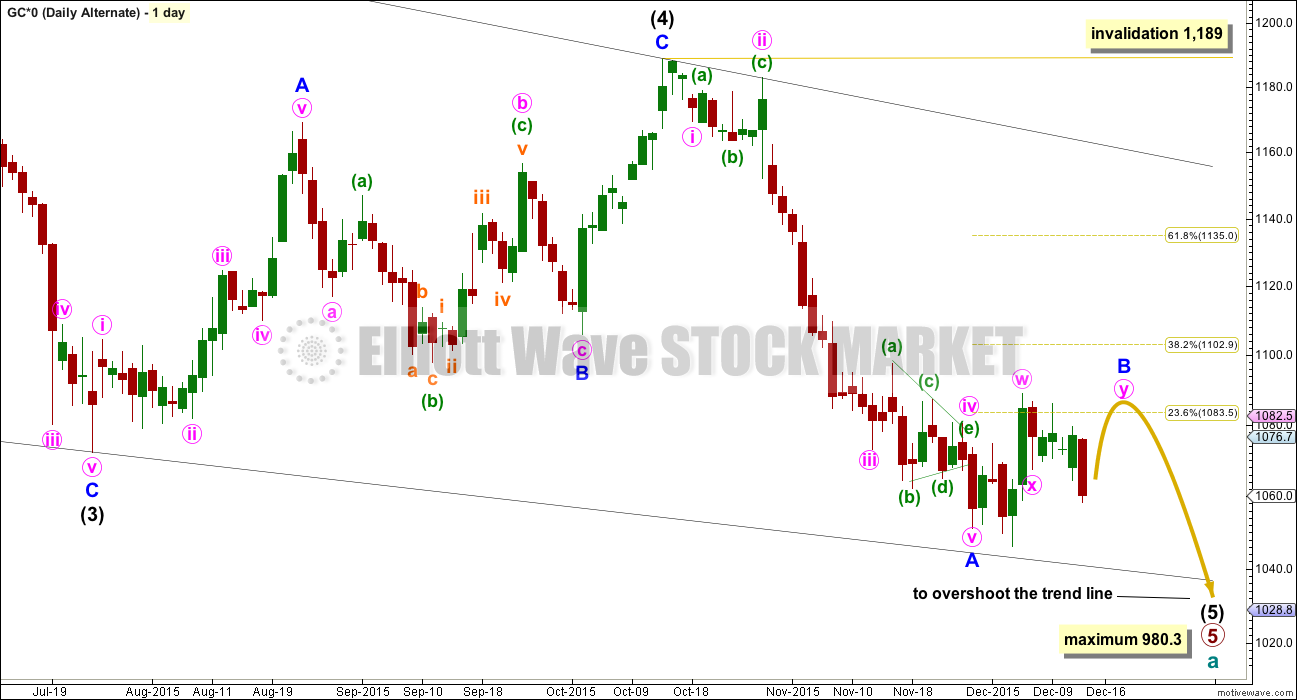
ALTERNATE ELLIOTT WAVE COUNT
Click chart to enlarge.
I am aware that this is the wave count which EWI and Danerics have. The implications are important, so I will follow this wave count daily for members here too.
Everything is the same up to the end of the triangle for primary wave 4. Thereafter, primary wave 5 is seen as an ending contracting diagonal.
Within the ending contracting diagonal, it is not possible to see intermediate wave (2) as a zigzag and meet all Elliott wave rules. To see an explanation of why see this video at 10:25.
The same problem exists for the ending diagonal of primary wave 5 itself. Intermediate wave (3) is longer than intermediate wave (1) which would suggest an expanding diagonal, but intermediate wave (4) is shorter than intermediate wave (2) and the trend lines converge which suggests a contracting diagonal.
From “Elliott Wave Principle” by Frost and Prechter, 10th edition, page 88: “In the contracting variety, wave 3 is always shorter than wave 1, wave 4 is always shorter than wave 2, and wave 5 is always shorter than wave 3. In the expanding variety, wave 3 is always longer than wave 1, wave 4 is always longer than wave 2, and wave 5 is always longer than wave 3.”
This structure violates the rules for both a contracting and expanding variety. If the rules in Frost and Prechter are accepted, then this is an invalid wave count.
It may be that the rules need to be rewritten to add “sometimes a third wave may be the longest within a contracting or expanding diagonal”. But I have never seen Robert Prechter publish such a rule, I do not know that it exists.
I cannot reconcile this wave count from EWI with the rules in Frost and Prechter.
If an ending contracting diagonal is unfolding, then the (1) – (3) trend line may be overshot signalling the end of intermediate wave (5). If price behaves thus and turns around and moves strongly higher, then this wave count must be accepted and the rules for diagonals will need to be rewritten.
I will continue to follow this possibility as price moves lower.
Intermediate wave (5) should be shorter than intermediate wave (1). At 977.53 intermediate wave (5) would reach equality in length with intermediate wave (1). A new low below this point would take this possible diagonal structure too far from the rules. At that stage, it really should be finally discarded.
All sub waves within ending diagonals must subdivide as zigzags. Within the zigzag of intermediate wave (5), minor wave B should unfold over several days. At this stage, there is no divergence between this idea and the main Elliott wave count.
Minor wave B may not move beyond the start of minor wave A above 1,191.66.
I am uncomfortable with publishing this wave count and I only do so because it has been published by Elliott Wave International. I am not comfortable with publishing any wave count which violates the rules in Frost and Prechter. However, when looking at primary wave 5 on the weekly chart it does look like a diagonal is unfolding.
Short to mid term there is no divergence in expected direction between this wave count and the main wave count.
TECHNICAL ANALYSIS
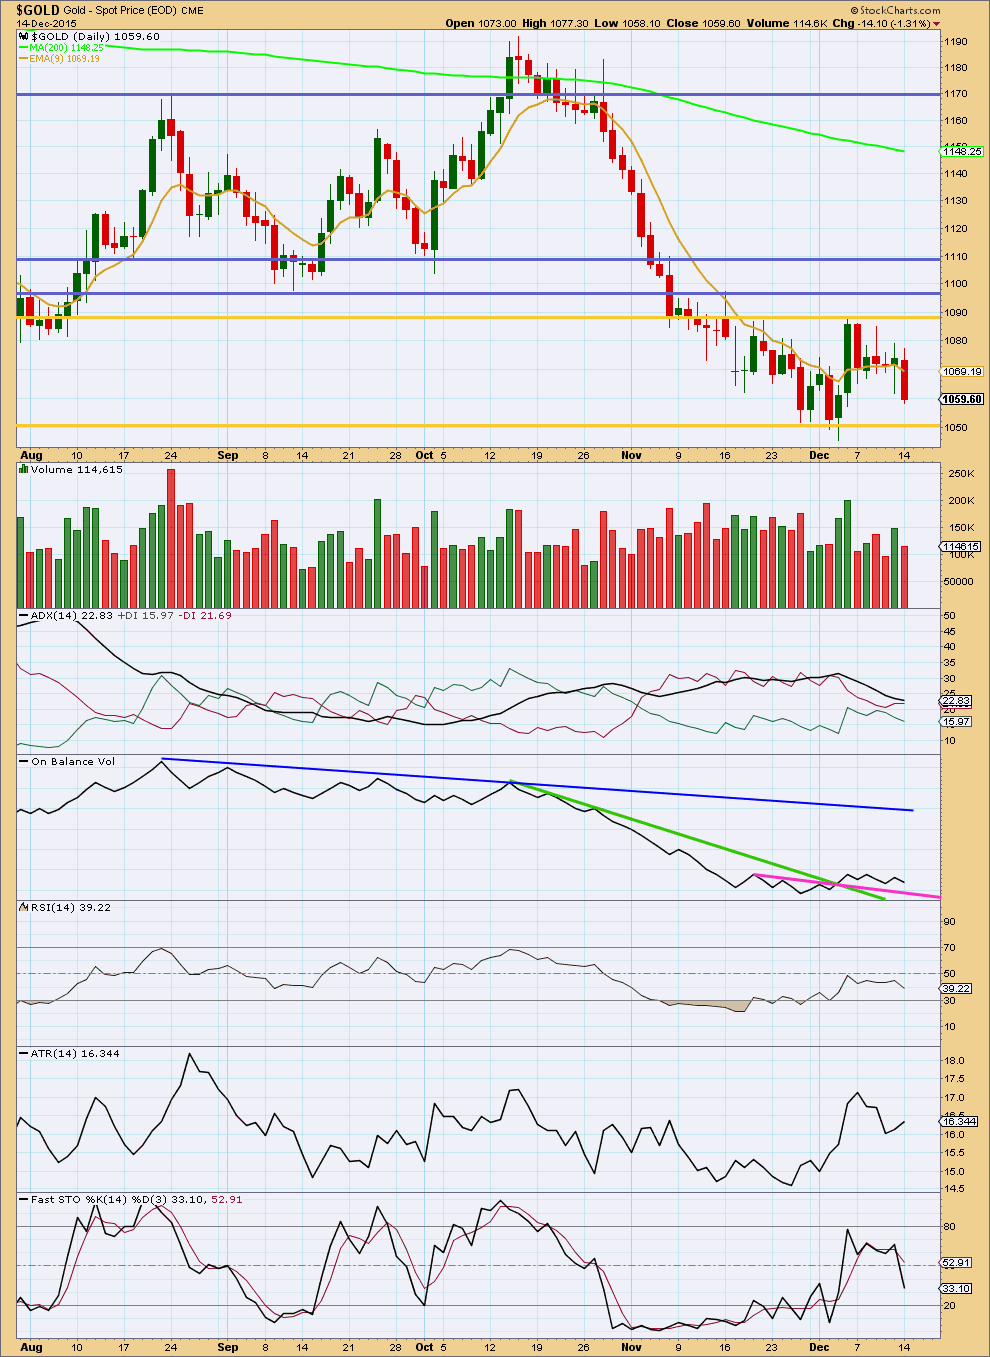
Click chart to enlarge. Chart courtesy of StockCharts.com.
Daily: Volume was lighter than the prior upwards days although price moved strongly lower. It is upwards days which have strongest volume during this correction, which indicates an upwards breakout is more likely than downwards. This does not support the Elliott wave count which expects a strong downwards breakout.
ADX is still declining indicating the market is not trending. Overall, ATR mostly agrees with the exception of the last two days.
On Balance Volume is bullish while it remains above the short pink trend line.
Stochastics is not proving perfectly useful for this consolidation. Stochastics did not quite reach overbought although price reached resistance on 4th December, but that was where the upwards swing ended and a downwards swing began. A range bound trading approach may now expect more downwards movement to end when price finds support at the lower gold trend line and Stochastics reaches oversold.
A break either above or below the horizontal gold trend lines on a day with an increase in volume is required to indicate a breakout and the end of this consolidation.
This analysis is published about 07:06 p.m. EST.
I didn’t provide a comment before the close on what price is up to because…. it’s really not up to much is it.
Tiny sideways move in a small range.
Today’s analysis will be pretty much exactly the same as yesterday. The only difference for the main hourly wave count is now micro B should be over and I can calculate a target for micro C. It will be 1,090
Jdst breakout and backtest?
Waiting for tsi to cross for entry!
I could use this BarChart data for my regular technical analysis of Gold. It has volume data, it’s coming directly from the exchange so it should be reliable.
I’ve noticed an odd thing over the last two days though, and this may be an issue with my connection via Motive Wave to the data feed BarChart is providing me. The daily candlestick disappears… and then appears later differently. And then even later on it is resolved and goes back to how it originally appeared.
The hourly data isn’t changing.
But with this problem I think I’ll hang onto StockCharts. Two different data sets of this market may be better than one.
Also, if I do my regular TA on Motive Wave it squashes price so much when I add my five indicators, it is no longer clear what direction price is moving in. That’s not good. Chart attached to show what I mean.
So I’ll keep using StockCharts for my regular TA
It’s been really helpful when you give us your thoughts and post a chart before the close, so delaying the analysis due to stockcharts data for the TA chart is OK.
I know. I’ll keep providing a comment and sometimes a chart before the close.
And then publish analysis later.
I know members want a little guidance to adjust positions before the close.
Gold is having a Breakout Now at $1,067 high of the day at 12:31 pm
I believe that 10:59 am low 1059.77 was bottom since the open and move up now as just held at Lara’s support line main hourly. It also is above lows this morning and yesterday.
Gold is not giving a clear move…its stuck in a price band…i think either this correction will exhaust here or it will b a large one…
Its actually making a bear flag on daily charts…making this correction more scary
I think it is going according to plan. It does take time and corrects part way down on the way up as per EW counts. The lows held from the last two days.
Want to see some fireworks…its boring.. 🙂
It already started see my comment above and patience has virtues.
Corrections take time.
Good news – now that Lara has switched to Barchart.com for her data feed, we can now accurately verify intraday price points as we follow along with the wave count(s). No more guessing if a price point was hit or not.
Lara this is great news. Wonderful!
“Now I have subscribed to BarChart and will receive data from COMEX for Gold spot (cash) prices. This data should be more reliable. BarChart receives it directly from the exchange.”
Why is this a great news????
Her reports will be more timely and complete and accurate as had to wait for stockcharts before and them and the last company not alwyas accurate.
I’ll still be using StockCharts most likely and so will wait for that volume data.
The difference is the accuracy in the data. Coming directly from COMEX it cannot be argued that it’s wrong.