Sideways movement to complete a small green doji fits the expectation of a continuing correction.
Summary: This correction may still be unfolding as either a single or double flat. The structure is incomplete. It may end in one more day, if it totals a Fibonacci thirteen. The target for the main hourly wave count for an upwards day to end this correction is 1,090.
New updates to this analysis are in bold.
To see weekly charts and the difference between the two wave counts go here.
MAIN ELLIOTT WAVE COUNT
Gold has been in a bear market since September 2011. There has not yet been confirmation of a change from bear to bull, and so at this stage any bull wave count would be trying to pick a low which is not advised. Price remains below the 200 day moving average and below the cyan trend line (copied over from the weekly chart). The bear market should be expected to be intact until we have technical confirmation of a big trend change.
The final line of resistance (cyan line copied over from weekly charts) is only overshot and not so far properly breached. While this line is not breached the bear wave count will remain possible. Simple is best, and the simplest method to confirm a trend change is a trend line.
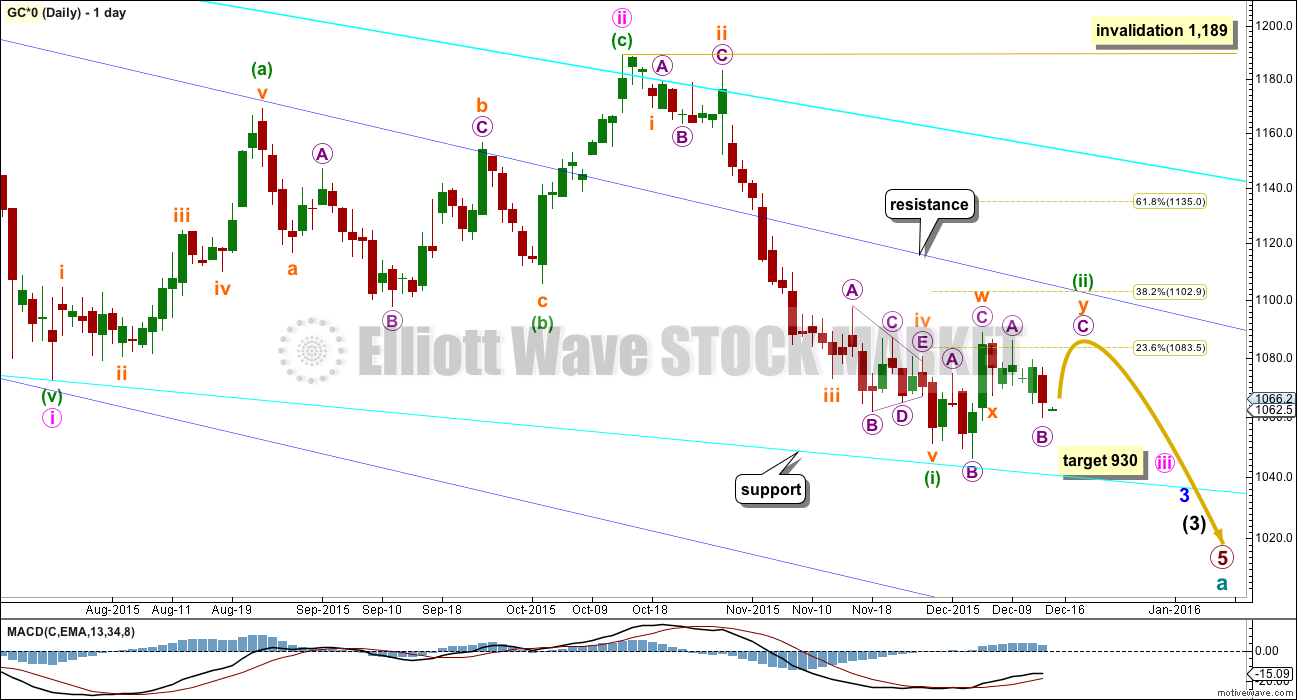
Minute wave ii is a complete double zigzag and deep at 0.75 the length of minute wave i. It has breached the dark blue base channel drawn about minor waves 1 and 2, one degree higher. When a lower degree second wave correction does this it reduces the probability of the wave count but does not invalidate it. Base channels most often work to show where following corrections find support or resistance, but not always.
At 930 minute wave iii would reach 1.618 the length of minute wave i.
Minuette wave (i) is complete.
Minuette wave (ii) may find resistance at the upper dark blue trend line. This may see it end about the 0.382 Fibonacci ratio of minuette wave (i) at 1,103.
Minuette wave (ii) has lasted twelve days so far. If it continues now for one more day, it may total a Fibonacci thirteen.
I have three hourly wave counts again today presented in order of probability. The third is very unlikely.
MAIN HOURLY WAVE COUNT
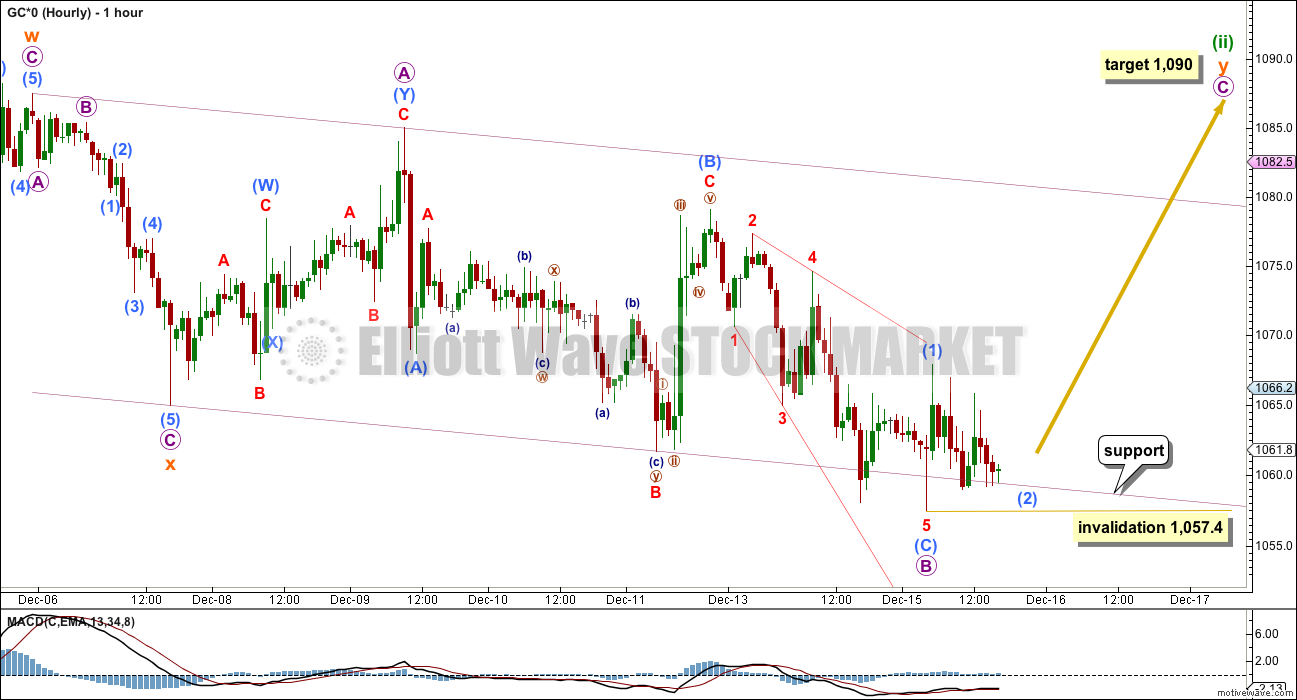
This main wave count still looks at minuette wave (ii) as an incomplete double flat correction.
Within the second flat of subminuette wave y, micro wave B is now exactly 1.38 the length of micro wave A (within the normal range of 1 to 1.38). The ending expanding diagonal of submicro wave (C) now fits perfectly and meets all Elliott wave rules for an ending expanding diagonal.
At 1,090 micro wave C would reach 1.618 the length of micro wave A.
Submicro wave (2) may not move beyond the start of submicro wave (1) below 1,057.4 within micro wave C.
Micro wave C may be able to complete in one day, if minuette wave (ii) is to end in a Fibonacci thirteen days total.
FIRST ALTERNATE HOURLY WAVE COUNT
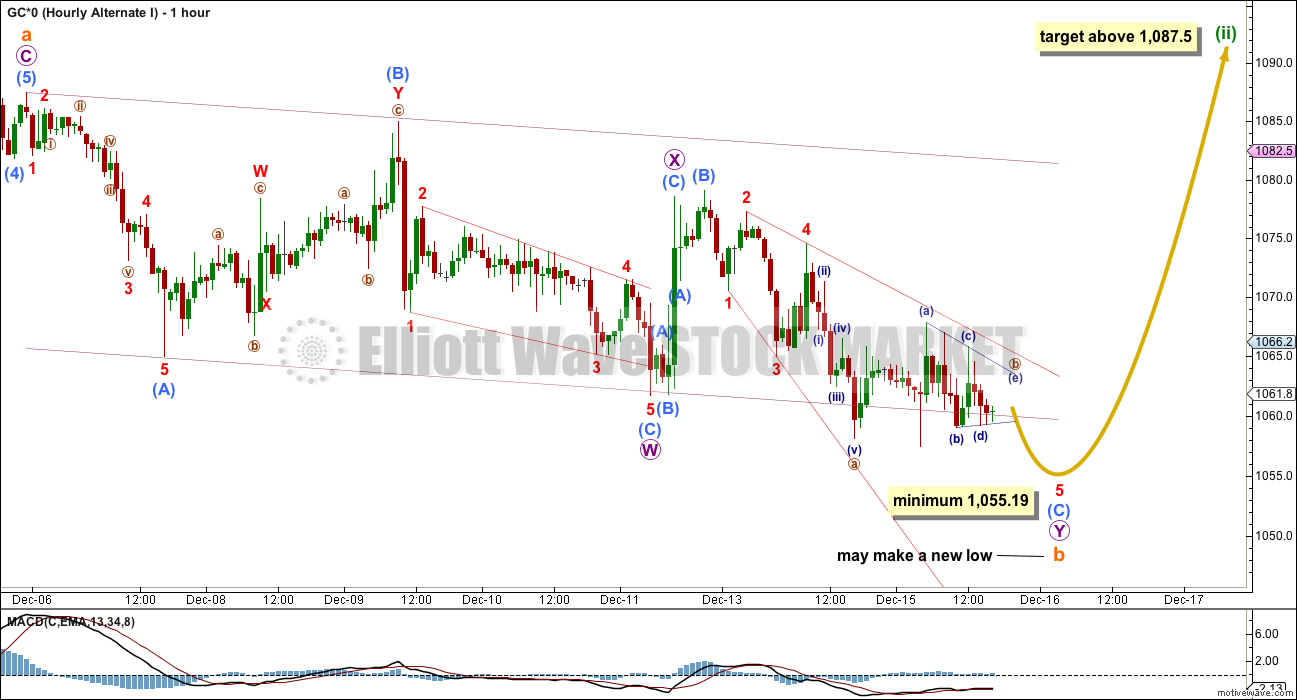
This first alternate wave count again looks at the possibility that minuette wave (ii) may still be a single flat correction.
Subminuette wave a is itself an expanded flat within the flat correction. Subminuette wave b must retrace a minimum 0.9 length of subminuette wave a at 1,055.19.
When subminuette wave b is complete, then the type of flat would be known and a target for subminuette wave c may be calculated. Subminuette wave c would be likely to end at least slightly above subminuette wave a at 1,087.5 to avoid a truncation.
Subminuette wave b may make a new low below the start (and the price extreme) of subminuette wave a. There is no lower invalidation point for this wave count for this reason.
This second idea may need more time to complete this structure. It may continue for a further nine days, so that minuette wave (ii) lasts a Fibonacci twenty one days in total.
SECOND ALTERNATE HOURLY WAVE COUNT
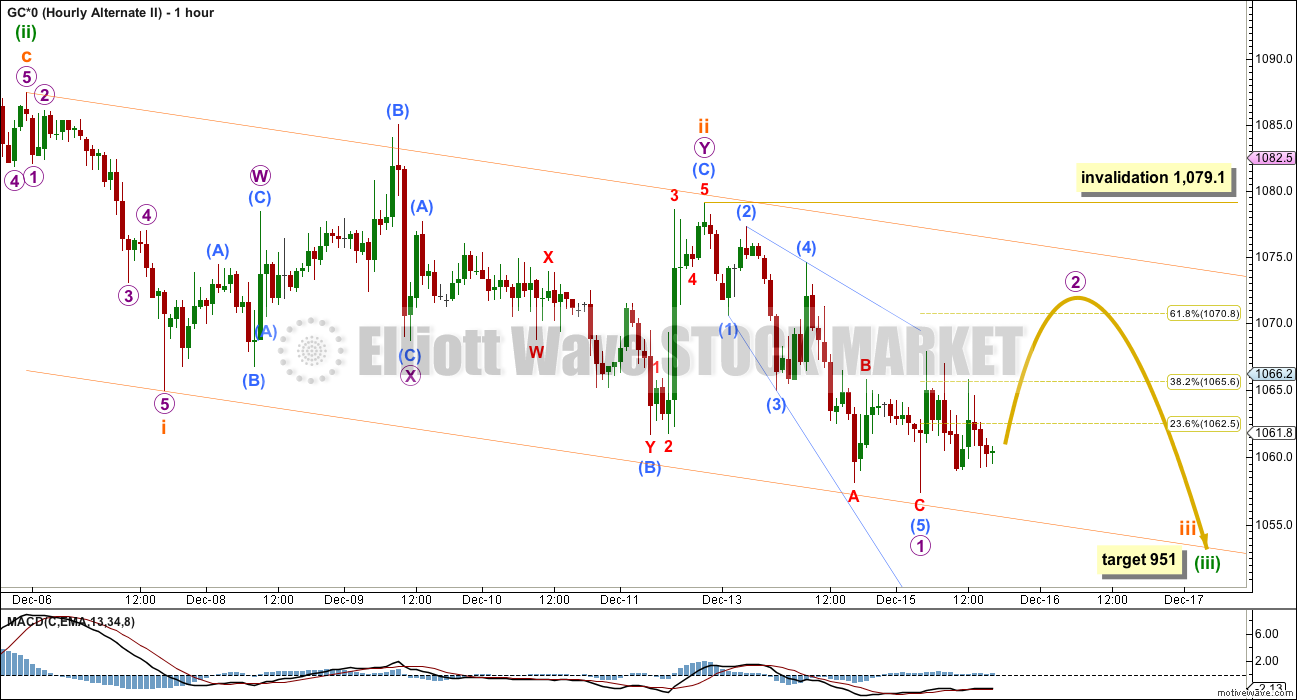
This second alternate wave count is least likely. It looks at minuette wave (ii) as a complete expanded flat.
This would be a very quick and shallow second wave correction, but the possibility must be considered.
If the main wave count is correct (as opposed to the alternate daily wave count below), then there should be a strong downwards pull from the middle of a big third wave at this stage. Surprises to the downside may turn up.
For this wave count a third wave down is expected. The following correction for a fourth wave may not move back into first wave price territory. The structure of downwards movement should indicate which of the two alternate wave counts is correct.
With subminuette wave ii now possibly a time consuming and deep double combination, the probability of this idea has further decreased. It is presented to consider all possibilities, as a what if.
Micro wave 1 would now be a complete leading expanding diagonal within subminuette wave iii. Leading diagonals in first wave positions are normally followed by very deep second wave corrections. Micro wave 2 would be expected to reach at least to the 0.618 Fibonacci ratio of micro wave 1. Micro wave 2 may not move beyond the start of micro wave 1 above 1,079.1.
ALTERNATE ELLIOTT WAVE COUNT
I am aware that this is the wave count which EWI and Danerics have. The implications are important, so I will follow this wave count daily for members here too.
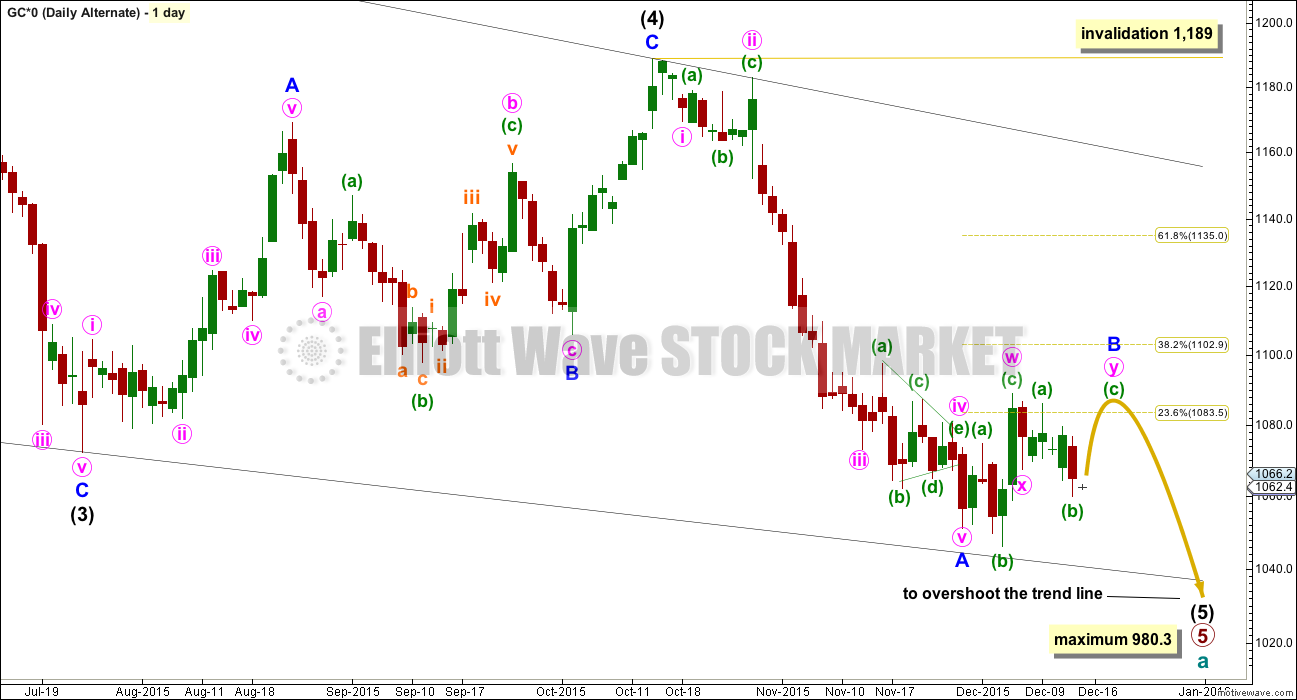
Everything is the same up to the end of the triangle for primary wave 4. Thereafter, primary wave 5 is seen as an ending contracting diagonal.
Within the ending contracting diagonal, it is not possible to see intermediate wave (2) as a zigzag and meet all Elliott wave rules. To see an explanation of why see this video at 10:25.
The same problem exists for the ending diagonal of primary wave 5 itself. Intermediate wave (3) is longer than intermediate wave (1) which would suggest an expanding diagonal, but intermediate wave (4) is shorter than intermediate wave (2) and the trend lines converge which suggests a contracting diagonal.
From “Elliott Wave Principle” by Frost and Prechter, 10th edition, page 88: “In the contracting variety, wave 3 is always shorter than wave 1, wave 4 is always shorter than wave 2, and wave 5 is always shorter than wave 3. In the expanding variety, wave 3 is always longer than wave 1, wave 4 is always longer than wave 2, and wave 5 is always longer than wave 3.”
This structure violates the rules for both a contracting and expanding variety. If the rules in Frost and Prechter are accepted, then this is an invalid wave count.
It may be that the rules need to be rewritten to add “sometimes a third wave may be the longest within a contracting or expanding diagonal”. But I have never seen Robert Prechter publish such a rule, I do not know that it exists.
I cannot reconcile this wave count from EWI with the rules in Frost and Prechter.
If an ending contracting diagonal is unfolding, then the (1) – (3) trend line may be overshot signalling the end of intermediate wave (5). If price behaves thus and turns around and moves strongly higher, then this wave count must be accepted and the rules for diagonals will need to be rewritten.
I will continue to follow this possibility as price moves lower.
Intermediate wave (5) should be shorter than intermediate wave (1). At 977.53 intermediate wave (5) would reach equality in length with intermediate wave (1). A new low below this point would take this possible diagonal structure too far from the rules. At that stage, it really should be finally discarded.
All sub waves within ending diagonals must subdivide as zigzags. Within the zigzag of intermediate wave (5), minor wave B should unfold over several days. At this stage, there is no divergence between this idea and the main Elliott wave count.
Minor wave B may not move beyond the start of minor wave A above 1,191.66.
I am uncomfortable with publishing this wave count and I only do so because it has been published by Elliott Wave International. I am not comfortable with publishing any wave count which violates the rules in Frost and Prechter. However, when looking at primary wave 5 on the weekly chart it does look like a diagonal is unfolding.
Short to mid term there is no divergence in expected direction between this wave count and the main wave count.
TECHNICAL ANALYSIS
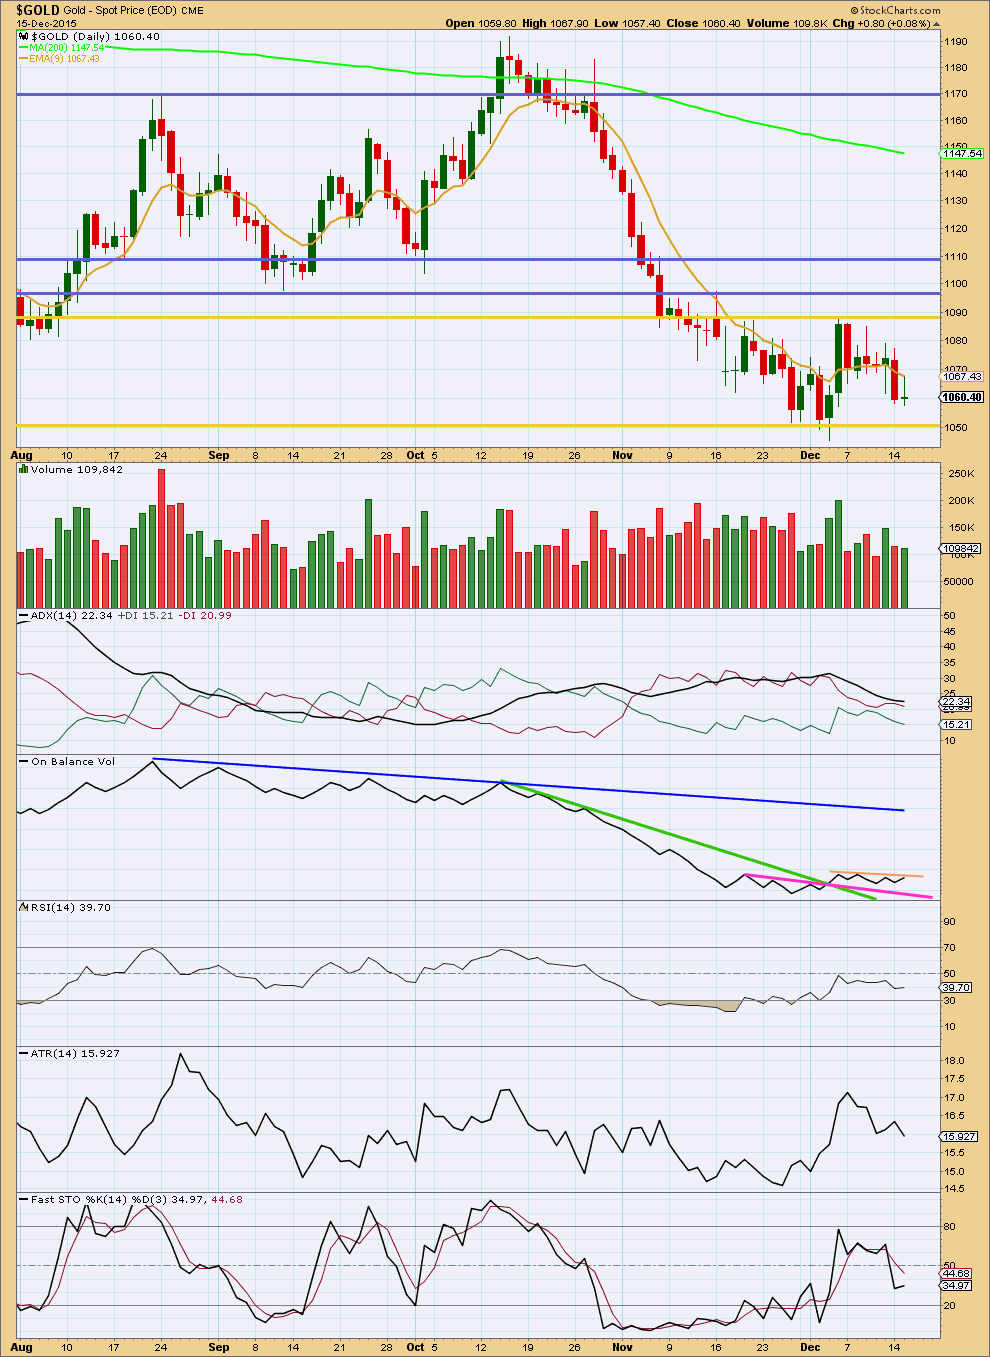
Click chart to enlarge. Chart courtesy of StockCharts.com.
The consolidation continues. Another long legged doji on light volume fits a consolidation perfectly.
It is three upwards days which show strongest volume during this consolidation. This indicates that the breakout, when it comes, would more likely be upwards than downwards. This does not support the Elliott wave counts which expect a downwards breakout. Caution is advised with any short positions due to the conflict of this regular technical analysis and the Elliott wave analysis at this time. This trick with using volume to indicate the direction of a breakout often works, but not always.
I have added a new short term trend line, in orange, to On Balance Volume. This short line has been tested three times now, so it has some technical significance. If OBV moves above this line, it would be further bullish indication. If OBV moves down from this line, it would be some bearish indication and the strength of the line would be reinforced. OBV may find support at the pink line.
ADX is declining indicating the market is not currently trending. ATR agrees as it too is declining. It should be expected that price will swing between resistance and support delineated by the gold horizontal trend lines. Currently, the swing short term may be down and may only end when price finds support and Stochastics is oversold.
We are waiting for a breakout. When price breaks above or below the gold horizontal lines on a day with increased volume, then a breakout shall be indicated.
This analysis is published about 06:52 p.m. EST.

I still cannot see the structure of minuette (ii) as complete.
At least one more day…. it may not exhibit a Fibonacci number in terms of duration. Gold’s waves fairly often do, but not always. So those expectations are a rough guide, they will work fairly often but not always.
The target remains the same at 1,090 for the main hourly wave count. It looks like there is a three up complete now so maybe micro wave C is unfolding as an ending diagonal (all sub waves must subdivide as zigzags).
Invalidation point remains the same too.
Not much change today.
Lara, is an ending diagonal in play?
Exactly.
Since the most bearish count is still on the table, I’m taking some longs off the table and building some short.
I’ll be doing some sizable trading if we get some whips after 2pm.
This could be interesting.
Gold at 12:52 pm just hit 1,075.49 and a double high for NUGT 26.65 not sure if Lara’s target will be met by 2:00 pm news.
Good call by Lara as maybe gold peaks today.
Not sure if it will hit the target, however I’d be out of bullish gold before the 2:00 pm FED FOMC news release.
FED interest rate decision is at 1:00 PM not 2.
Check the events schedule.
FED FOMC has been at 2:00 pm EST for many months and today also.
1:00 pm Central time.
WEDNESDAY, DEC. 16
2 pm FOMC statement
2:30 pm Janet Yellen press conference
http://www.marketwatch.com/Economy-Politics/Calendars/Economic
It is a moog point??? It was on one of the NETDania site.
Oops, Papudi is wrong again…
Alt wave count ii invalidation 1079.1
I thought you were saying it happened, which it hasn’t yet as gold high 1,077.08 at 9:57 am so far.
On a FED day I wanted to have invalidation reminder during the markup/down after the news.
With gold seasonality picking up in the back half of Dec, the divergence in technical analysis, the COT report at pretty much all-time bearish positioning, and the idea we are in a Wave 2 correction, I wouldn’t be surprised *at all* if 1140 is tagged on the upside.
That would smack it right into the cyan resistance line.
Also, every time the COT report has been this extreme, we’ve rallied $90 – $190.
Regarding the wave count, for this scenario it would make a bit more sense if green (i) was moved down to where purple B is located. That way (if it makes sense) green (ii) would look more like the beginning of a deeper correction.
Just some thoughts in case we actually do move up toward $1140.
Why do you say COT is bearish? In my opinion COT moved to bullish the last couple of weeks as Commercials reduced their short positions.
Bearish positioning..yes = bullish for gold.
Wow!!! No interest in gold??? FED day may be.
Lara was correct in forecasting sideway, choppy , overlapping gold market till correction is over.
Hopefully today is the 13th day trend may begin.
wxyxxz