
An upwards day was expected.
Summary: The correction is very close to completion, but it has not managed to complete in a Fibonacci thirteen days. The target for choppy overlapping upwards movement remains the same at 1,090. It may now be met in one to three days time.
New updates to this analysis are in bold.
To see weekly charts and the difference between the two wave counts go here.
MAIN ELLIOTT WAVE COUNT
Click chart to enlarge.
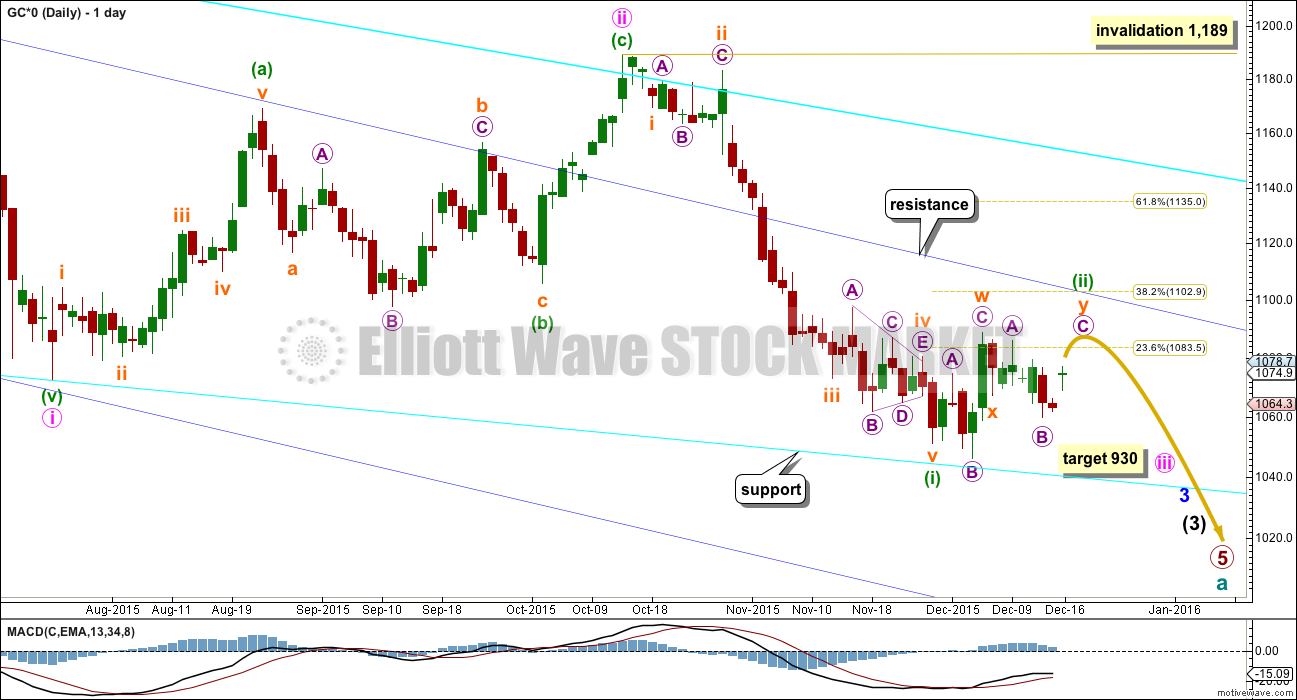
Gold has been in a bear market since September 2011. There has not yet been confirmation of a change from bear to bull, and so at this stage any bull wave count would be trying to pick a low which is not advised. Price remains below the 200 day moving average and below the cyan trend line (copied over from the weekly chart). The bear market should be expected to be intact until we have technical confirmation of a big trend change.
The final line of resistance (cyan line copied over from weekly charts) is only overshot and not so far properly breached. While this line is not breached the bear wave count will remain possible. Simple is best, and the simplest method to confirm a trend change is a trend line.
Minute wave ii is a complete double zigzag and deep at 0.75 the length of minute wave i. It has breached the dark blue base channel drawn about minor waves 1 and 2, one degree higher. When a lower degree second wave correction does this it reduces the probability of the wave count but does not invalidate it. Base channels most often work to show where following corrections find support or resistance, but not always.
At 930 minute wave iii would reach 1.618 the length of minute wave i.
Minuette wave (i) is complete.
Minuette wave (ii) may find resistance at the upper dark blue trend line. This may see it end about the 0.382 Fibonacci ratio of minuette wave (i) at 1,103.
Minuette wave (ii) has not managed to complete in a Fibonacci thirteen days. It still needs more time to complete, maybe another one to three days. It may not exhibit a Fibonacci number in terms of duration. Gold fairly often has waves which exhibit Fibonacci durations, but not always.
I have only two hourly wave counts today presented in order of probability. The second is very unlikely.
MAIN HOURLY WAVE COUNT
Click chart to enlarge.
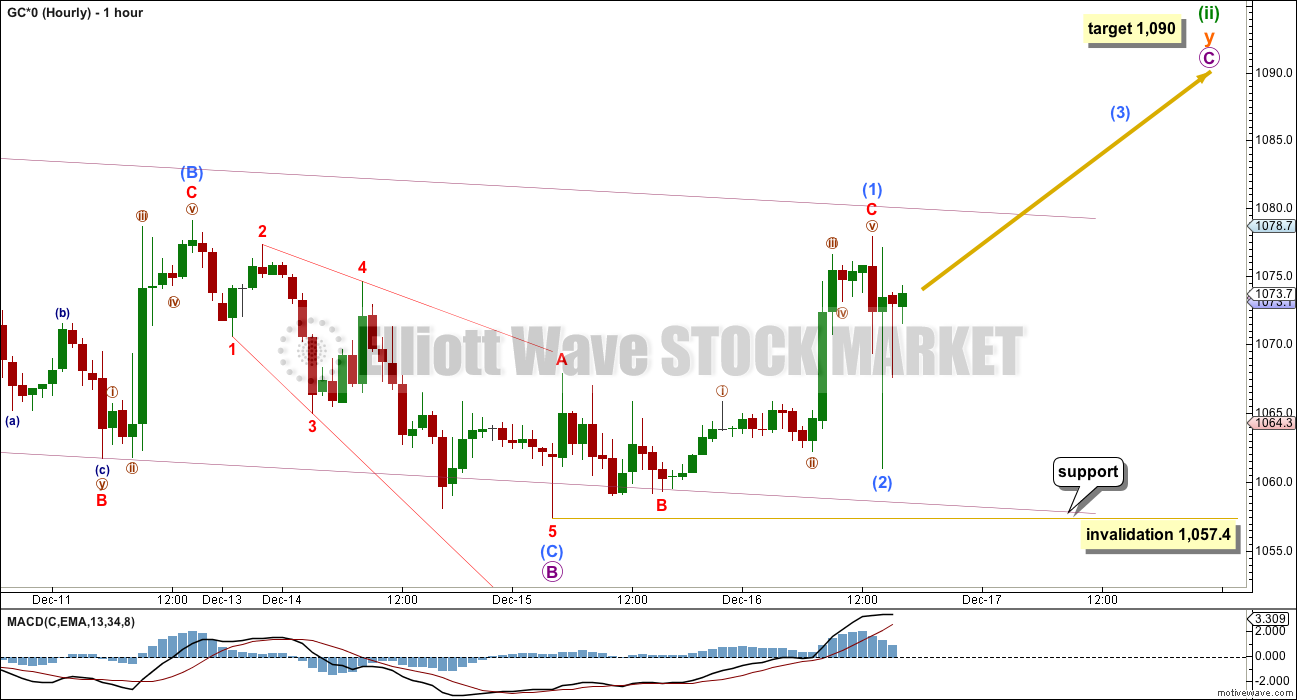
This main wave count still looks at minuette wave (ii) as an incomplete double flat correction.
Within the second flat of subminuette wave y, micro wave B is now exactly 1.38 the length of micro wave A (within the normal range of 1 to 1.38).
At 1,090 micro wave C would reach 1.618 the length of micro wave A.
Submicro wave (2) may not move beyond the start of submicro wave (1) below 1,057.4 within micro wave C.
Micro wave C has not managed to complete in one day. The structure is incomplete and should be expected to move higher to end at least slightly above the end of micro wave A at 1,085 to avoid a truncation and a very rare running flat.
There are two possible structures that micro wave C may unfold as: an impulse or an ending diagonal. With the first wave up now looking complete and subdividing best as a three, an ending diagonal is the more likely structure that is unfolding. Ending diagonals require all their sub waves to subdivide as zigzags.
Submicro wave (1) is a complete zigzag. Submicro wave (2) also looks best as a complete zigzag on the five minute chart. It is a 0.82 correction of submicro wave (1), just slightly longer than the normal range of 0.66 to 0.81.
When submicro wave (3) is complete, then the type of diagonal should be known: expanding or contracting. The contracting variety is more common. At 1,081.5 submicro wave (3) would reach equality in length with submicro wave (1). If it ends below this point, then the diagonal would be contracting. If it ends above this point, the diagonal would be expanding.
Submicro wave (3) upwards must move above the end of submicro wave (1) at 1,077.9. When submicro wave (3) is done, then submicro wave (4) must unfold as a zigzag downwards and must overlap back into submicro wave (1) price territory.
Diagonals are choppy and overlapping structures with a general trend (as opposed to triangles which are sideways). This structure may end in one more day, if it is a contracting diagonal. But if it is expanding, it may require longer.
I am discarding yesterday’s first alternate wave count. This upwards movement does not make sense although it was not invalided by price. The probability is now too low for publication.
ALTERNATE HOURLY WAVE COUNT
Click chart to enlarge.
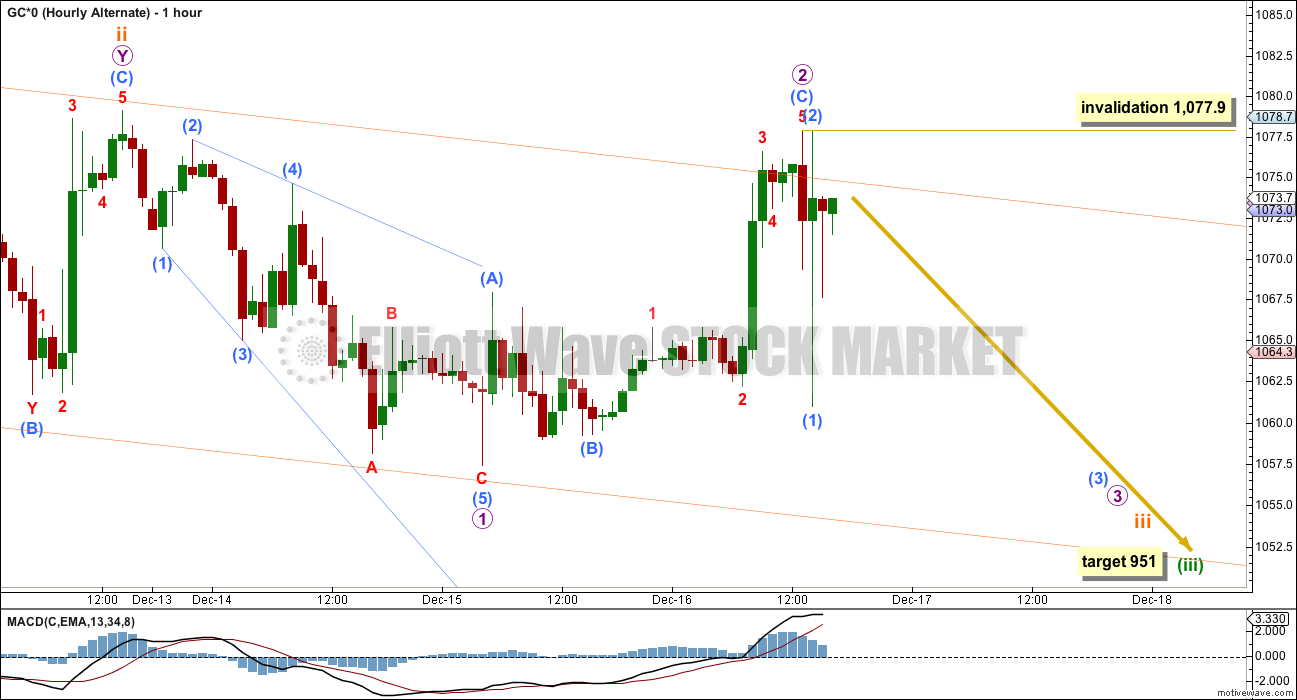
This alternate wave count is least likely. It looks at minuette wave (ii) as a complete expanded flat.
This would be a very quick and shallow second wave correction, but the possibility must be considered.
If the main wave count is correct (as opposed to the alternate daily wave count below), then there should be a strong downwards pull from the middle of a big third wave at this stage. Surprises to the downside may turn up.
For this wave count a third wave down is expected. The following correction for a fourth wave may not move back into first wave price territory. The structure of downwards movement should indicate which of the two alternate wave counts is correct.
With subminuette wave ii now possibly a time consuming and deep double combination, the probability of this idea has further decreased. It is presented to consider all possibilities, as a what if.
Micro wave 2 would be a complete zigzag, a very deep correction which was expected following a leading diagonal in a first wave position. Micro wave 3 downwards should be underway. If price makes a new low below 1,057.4, then this alternate and its implications must be seriously considered. This alternate should not be used while price remains above 1,057.4 because the probability still is too low.
ALTERNATE ELLIOTT WAVE COUNT
Click chart to enlarge.
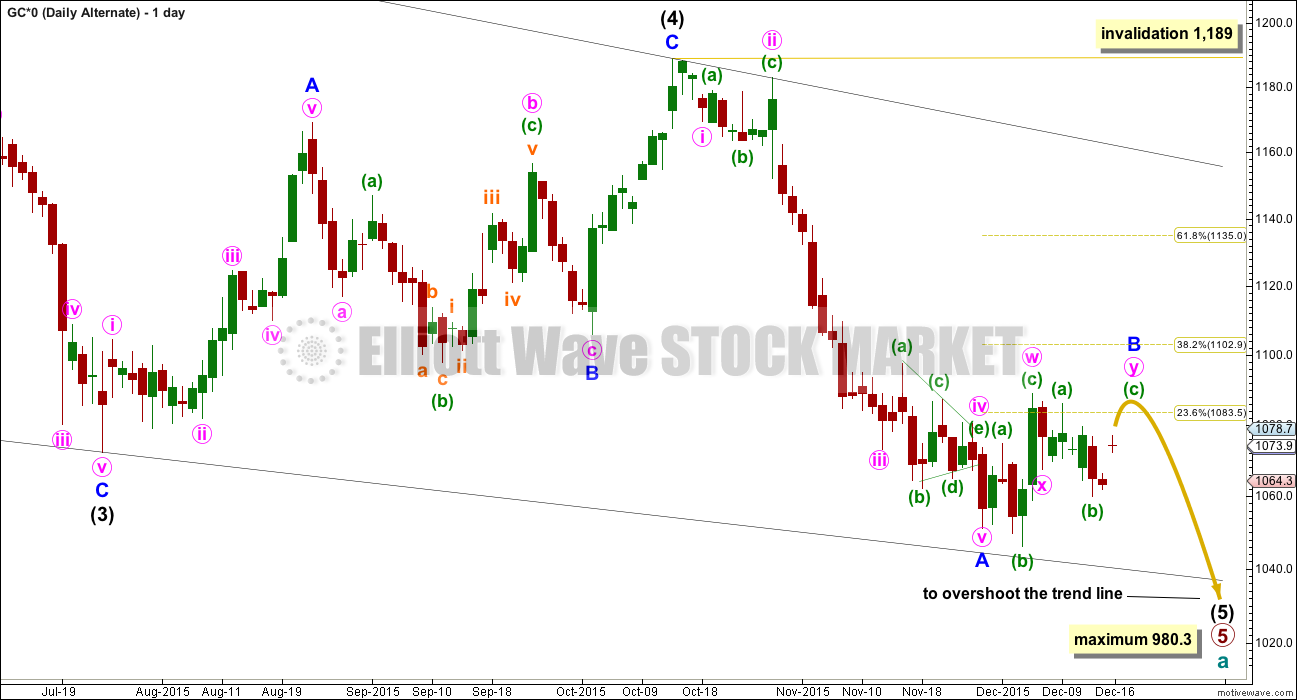
I am aware that this is the wave count which EWI and Danerics have. The implications are important, so I will follow this wave count daily for members here too.
Everything is the same up to the end of the triangle for primary wave 4. Thereafter, primary wave 5 is seen as an ending contracting diagonal.
Within the ending contracting diagonal, it is not possible to see intermediate wave (2) as a zigzag and meet all Elliott wave rules. To see an explanation of why see this video at 10:25.
The same problem exists for the ending diagonal of primary wave 5 itself. Intermediate wave (3) is longer than intermediate wave (1) which would suggest an expanding diagonal, but intermediate wave (4) is shorter than intermediate wave (2) and the trend lines converge which suggests a contracting diagonal.
From “Elliott Wave Principle” by Frost and Prechter, 10th edition, page 88: “In the contracting variety, wave 3 is always shorter than wave 1, wave 4 is always shorter than wave 2, and wave 5 is always shorter than wave 3. In the expanding variety, wave 3 is always longer than wave 1, wave 4 is always longer than wave 2, and wave 5 is always longer than wave 3.”
This structure violates the rules for both a contracting and expanding variety. If the rules in Frost and Prechter are accepted, then this is an invalid wave count.
It may be that the rules need to be rewritten to add “sometimes a third wave may be the longest within a contracting or expanding diagonal”. But I have never seen Robert Prechter publish such a rule, I do not know that it exists.
I cannot reconcile this wave count from EWI with the rules in Frost and Prechter.
If an ending contracting diagonal is unfolding, then the (1) – (3) trend line may be overshot signalling the end of intermediate wave (5). If price behaves thus and turns around and moves strongly higher, then this wave count must be accepted and the rules for diagonals will need to be rewritten.
I will continue to follow this possibility as price moves lower.
Intermediate wave (5) should be shorter than intermediate wave (1). At 977.53 intermediate wave (5) would reach equality in length with intermediate wave (1). A new low below this point would take this possible diagonal structure too far from the rules. At that stage, it really should be finally discarded.
All sub waves within ending diagonals must subdivide as zigzags. Within the zigzag of intermediate wave (5), minor wave B should unfold over several days. At this stage, there is no divergence between this idea and the main Elliott wave count.
Minor wave B may not move beyond the start of minor wave A above 1,191.66.
I am uncomfortable with publishing this wave count and I only do so because it has been published by Elliott Wave International. I am not comfortable with publishing any wave count which violates the rules in Frost and Prechter. However, when looking at primary wave 5 on the weekly chart it does look like a diagonal is unfolding.
Short to mid term there is no divergence in expected direction between this wave count and the main wave count.
TECHNICAL ANALYSIS
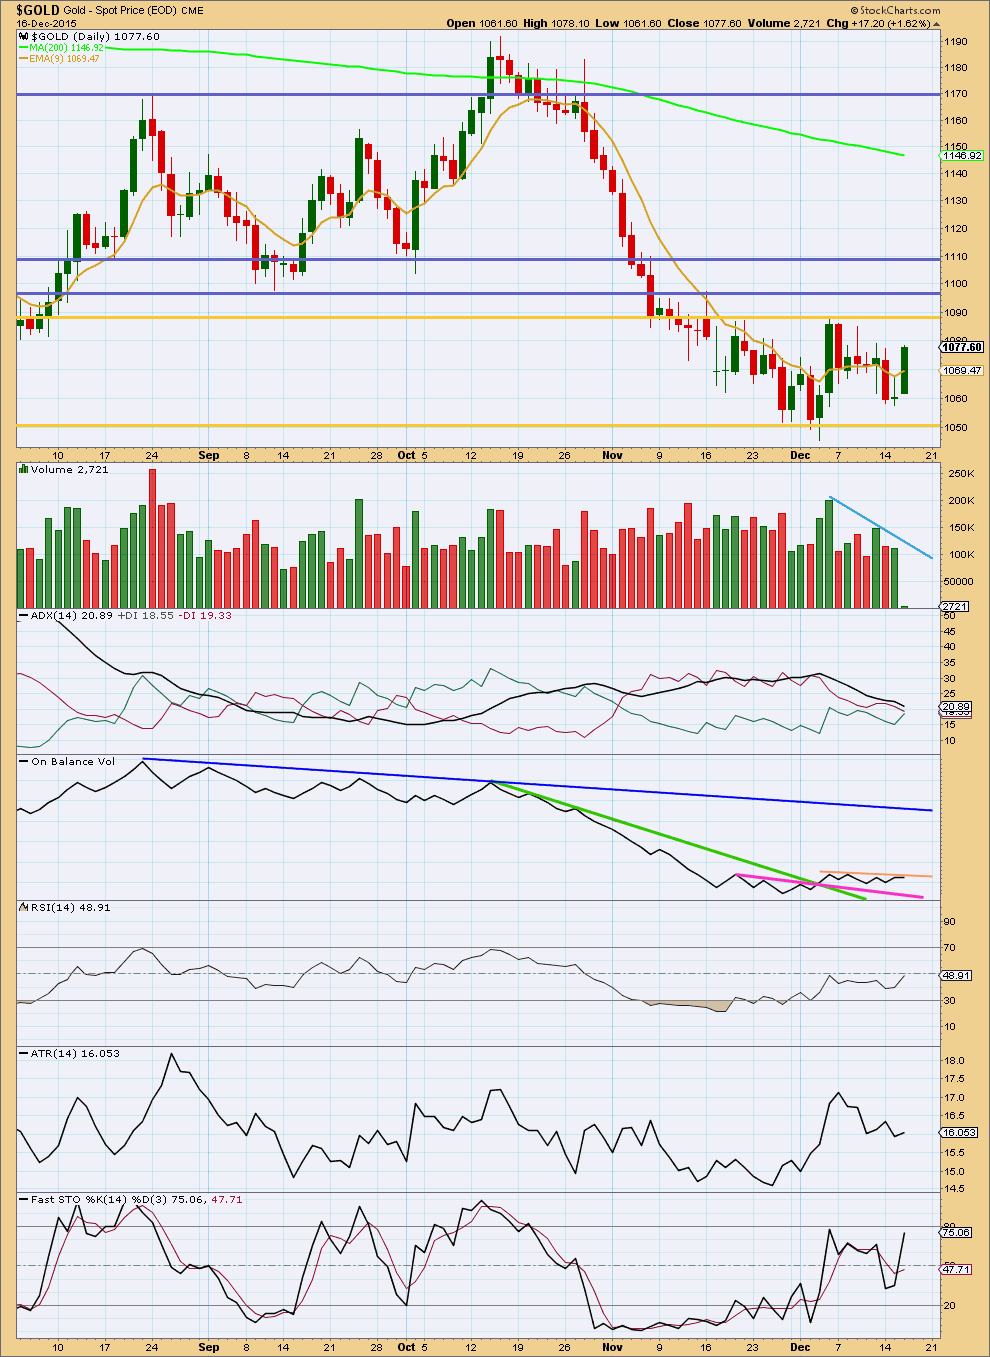
Click chart to enlarge. Chart courtesy of StockCharts.com.
The consolidation continues further on declining volume. This volume profile supports the wave count in that it expects price is consolidating and not trending.
It is still upwards days which show strongest volume during this consolidation. That would indicate an upwards breakout is more likely than a downwards breakout. This trick of using volume as an indicator of the breakout direction often works, but not always. At this stage, stronger upwards days do not support the Elliott wave counts which expect a downwards breakout from this consolidation.
ADX is declining as is ATR. Both these indicators are in agreement. Price is consolidating.
Price is swinging between support and resistance. At this stage, some more upwards movement may be expected to continue until price finds resistance at the upper horizontal gold trend line and Stochastics reaches overbought at the same time.
We are still waiting for a breakout. It will be indicated when price breaks above resistance or below support on a day with increased volume. That has not happened yet.
On Balance Volume is today flat while price made a new high. This small divergence is bearish short term. OBV is finding resistance at the short orange trend line.
This analysis is published about 05:47 p.m. EST.
StockCharts $GOLD volume data for today is biggest in 6 months.
Not sure if finalized yet though but it’s huge.
I may be dead wrong, but….
There is a small gap on the USD chart, which will need to be filled eventually. This may, in turn, affect gold. While I am overall still bearish, I don’t believe that this correction is over and anticipate a snapback rally. That may start as soon as tomorrow.
I should add that I don’t think that gold will completely break down until the USD definitively sails past 100. I do expect that moment to come eventually, but not right now.
Intra day – is this a B wave triangle?
No, it doesn’t fit.
Sell gold if it touches $1,045/oz
http://www.thehindubusinessline.com/markets/commodities/sell-gold-if-it-touches-1045oz/article8000846.ece?utm_source=RSS_Feed&utm_medium=RSS&utm_campaign=RSS_Syndication
Lara, is there any chance that the correction is morphing into a large flat?
That is what I need to take time to figure out.
And when I do that I need to determine exactly what final price point can tell us the correction is over.
From a classic technical analysis POV a break below 1,050 (the lower gold support line on the TA chart here) with a downwards day on increased volume would indicate a downwards breakout.
I cannot see volume data until the session is over and StockCharts have finalised their data.
And currently I am having problems with COMEX data that BarChart is giving me. I cannot see today’s daily candlestick until tomorrow! But the hourly chart is correct… so far.
It’s infuriating this lack of decent data. Motive Wave are aware of the problem with the data import from BarChart, and the next update to Motive Wave will fix the problem they tell me.
But for now I have to wait for the reliable data from StockCharts.
Nope. I’ve tried and tried to see it… I cannot see a single flat correction continuing.
I can see a double flat continuing though. So that will now be an alternate.
Still waiting for StockCharts volume data to be finalised.
Wow.
If we cut out the 16th then the low below 1055.19 would fit Lara’s yesterday alternate so beautifully, which had me baffled this morning. Alas we can’t ignore one day’s worth of data. So then I imagine Lara is working diligently reviewing the counts. I’ve missed a good entry which would have been last night before close buying Dust but I err on side of caution. So, plan again.
Last trade was not negative though. Barely successful. Two entries averaged 12.26 on GG with an exit 12/4 at 12.61- small position. Yes, I traded countertrend– not my norm.
Looking now to join current trend .
** shout out ** How’s Alan Tham been doing? Haven’t seen him/you post lately?
ET call home.
Whoops AT call home. Alan Tham.
Your wisdom is missed.
🙂
The main hourly wave count was invalidated and the alternate confirmed.
There is now only one hourly wave count, the alternate.
The correction is over and we should be on the way to a downwards breakout.
Lara thanks for clarifying the direction.
“The correction is over and we should be on the way to a downwards breakout.”
“We are still waiting for a breakout. It will be indicated when price breaks above resistance or below support on a day with increased volume”
Did we get the volume that also confirmed that?
If we didn’t get it yet we will know by day end.
StockCharts data isn’t finalised until 6:30pm EST.
So I won’t know until then unfortunately.
And I’m having problems with the COMEX data. So I’ll wait for StockCharts data to see volume.
Lara is doing great wrk..
But these analysis are proving more wrong than right…missing the trend always..and also incurring losses.. 🙁
overall trend is down, my advice is to not go against the overall trend, playing with corrections is like playing with fire, if you are going to play them, you have to take profits quick and never hold over night!
Good points.
believe me I have learned the hard way!
Also never hold overnight after FED FOMC meeting as often the world has a 2nd opinion and the direction changes overnight.
If you’ve been trying to trade the choppy waves of a correction then you’ve been going against the trend.
I’ve stated clearly that only the most experienced traders should try to trade corrections. The rest of us should stand aside and wait until a trend is clear, then join it.
And I’ve also stated clearly that trying to trade corrections is more risky and will incur more losses.
I don’t know how much clearer I can be than that.
GDX may not bounce much today if gold stays in the 1050’s today and GDX adjusts down to a new lower gold normal.
GDX may stay under 13.50 today.
Lara cautions going bullish in a bear market.
Now that the correction is over so bullish is even more risky and definitely risky holding overnight.
Gold bullish COT failed this time. May be it has failed before also????
I’m sure that COT has failed many times. They don’t control the market.
COT is not a precise timing tool. If gold bottoms within the next few weeks, COT will not be considered to have failed.
The way I look at the COT data has me looking for a low in gold between 12/22 and 12/31. I am expecting gold to get punished more over the next 5 to 7 trading days.
Agreed. Same pattern (down into year end) as has occurred in each of the last 4 years of this bear market in gold.
From the COT analysis I do and post here sometimes, below is a comment I wrote last Friday. Based on what I see in the details of past weeks, their is the potential for a decent move down to get past the huge amount of shorts put on 9 and 10 weeks ago.
Updated Gold COT analysis. There are some weeks in the data coming up, weeks 8 and 9 in the 10 week cumulative, where a huge divergence occurred driving the blue line UP. Those weeks will drop off the COT report of 12/22 and 12/29. So I expect the blue line to drop into these COT weeks, and for now, I plan to take some long term GDX and/or GLD option positions at that time (using EWT counts as my guide). My intent is to hold them for 6 to 9 weeks. If the move has already started to go up significantly, I will probably look for an entry on a pullback or wait until Feb/Mar for the blue line peak.
Lara: Main hour wave count needs to change if target for the correction is still 1099???
Main hourly was invalidated below 1057.40.
Gold changed directions and what was left of the bullish correction ended before Wednesday close.
In fact minuette wave (ii) has been changed to it ended last Friday as per the hourly alternate chart so no more 1090 target.
Gold just hit 1047.74 at 10:15 am
Dec 3rd multi year low was 1046.38
Will it get broken today or was 1047.74 today’s low?
Gold at 9:21 am moved below 1057.40 just NOW and invalidated main hourly and we go with alternate hourly count bearish.
looks like the party got an early start!
Yes the bear party started early.
I did buy DUST minutes after FED FOMC announcement thinking interest rate hike would be bearish gold, however the market disagreed and I barely sold sold with a profit. However The world had a 2nd opinion and today the stock market Santa Claus Fed fueled rally continues in stocks and discarding gold.
I locked in dust at 17.30 this morning, will add on any drops, hopefully this wave is a long and profitable one for us all!
Invalidation prices:
Hourly wave count : 1057.4
Alt hourly wave count: 1077.90
Hello, has anybody here heard about Martin Armstrongs forecast about gold for 2016? I know as probably most of you that he predicts a rally. I truly believe in EW principle and daily follow Lara’s analysizes and adds some of mine. I’m very curious about what he said about gold on World Economic Conference. It would be great to combine EW with his predictions!
Gold down…is everything going according to plan..??
Another spectacular analysis. Thanks Lara.
I’m sure to going to miss you while you’re on vacation the next two weeks.
Just leave all your phone numbers in case of an emergency.
Just kidding. Go surf the world having the time of your life. You deserve it.
We’ll cover the home front on the look out for Rogue gold waves or whirlpools. LOL.
LOL
I plan on surfing until my arms are noodles and I am a fish 🙂
My soul will be restored.
Surfing has to be amongst the most exciting sports in the world.
maybe one more hit at the bottom trend line which would correspond to Lara’s target of 1090 and then blast off?
Shahab
That sounds good to me.
I’m figuring it’s Dusty gold trails next week and you’re JDusty trails, both heading south to new lows.