
A new low below 1,057.4 confirmed the alternate hourly wave count.
Summary: A downwards breakout may be underway. A close below the lower zone of support on a day with an increase in volume looks like a downwards breakout from a consolidation zone. Yesterday’s alternate hourly wave count was confirmed, so is now the main hourly wave count. The target for the short term is 1,042 – 1,043. At about there, price may bounce up for a small fourth wave correction. The trend is down.
New updates to this analysis are in bold.
To see weekly charts and the difference between the two wave counts go here.
Notice: There is a problem with current day’s data from COMEX at the daily chart level. MotiveWave is aware of this problem which will be fixed within a few days. I am using StockCharts data to supplement COMEX data for today’s daily candlestick.
MAIN ELLIOTT WAVE COUNT
Click chart to enlarge.
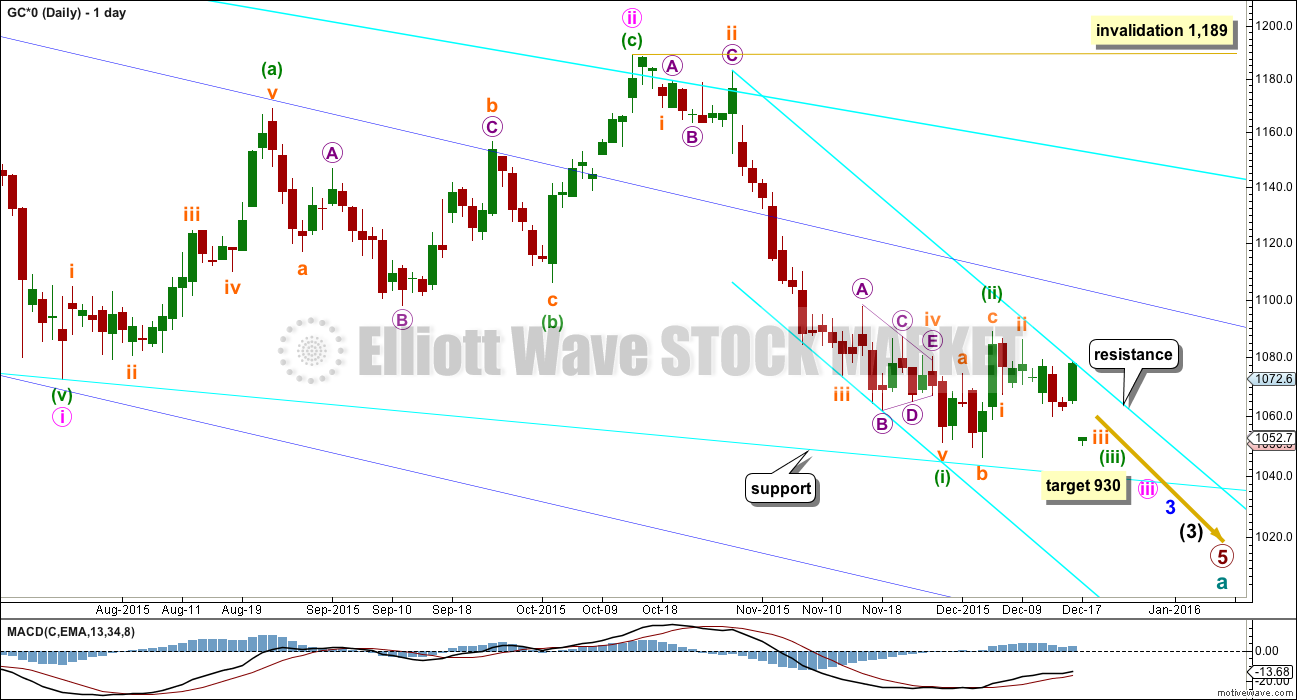
Gold has been in a bear market since September 2011. There has not yet been confirmation of a change from bear to bull, and so at this stage any bull wave count would be trying to pick a low which is not advised. Price remains below the 200 day moving average and below the cyan trend line (copied over from the weekly chart). The bear market should be expected to be intact until we have technical confirmation of a big trend change.
The final line of resistance (cyan line copied over from weekly charts) is only overshot and not so far properly breached. While this line is not breached the bear wave count will remain possible. Simple is best, and the simplest method to confirm a trend change is a trend line.
Minute wave ii is a complete double zigzag and deep at 0.75 the length of minute wave i. It has breached the dark blue base channel drawn about minor waves 1 and 2, one degree higher. When a lower degree second wave correction does this it reduces the probability of the wave count but does not invalidate it. Base channels most often work to show where following corrections find support or resistance, but not always.
At 930 minute wave iii would reach 1.618 the length of minute wave i.
Minuette wave (i) is complete.
Minuette wave (ii) now looks like it may have been over earlier in a Fibonacci five days as a brief shallow second wave correction. Minuette wave (iii) may have begun. Today’s main hourly wave count was yesterday’s alternate, and yesterday it was judged to have a very low probability. Classic technical analysis indicates a downwards breakout may be underway, so today this wave count has increased in probability.
I am drawing a best fit channel about this downwards movement in cyan. Along the way down, there will be small upwards corrections which may find resistance at the upper trend line.
Both hourly wave counts today will look at price movement since the high of 1,088 on 4th December, when minuette wave (ii) probably ended.
MAIN HOURLY WAVE COUNT
Click chart to enlarge.
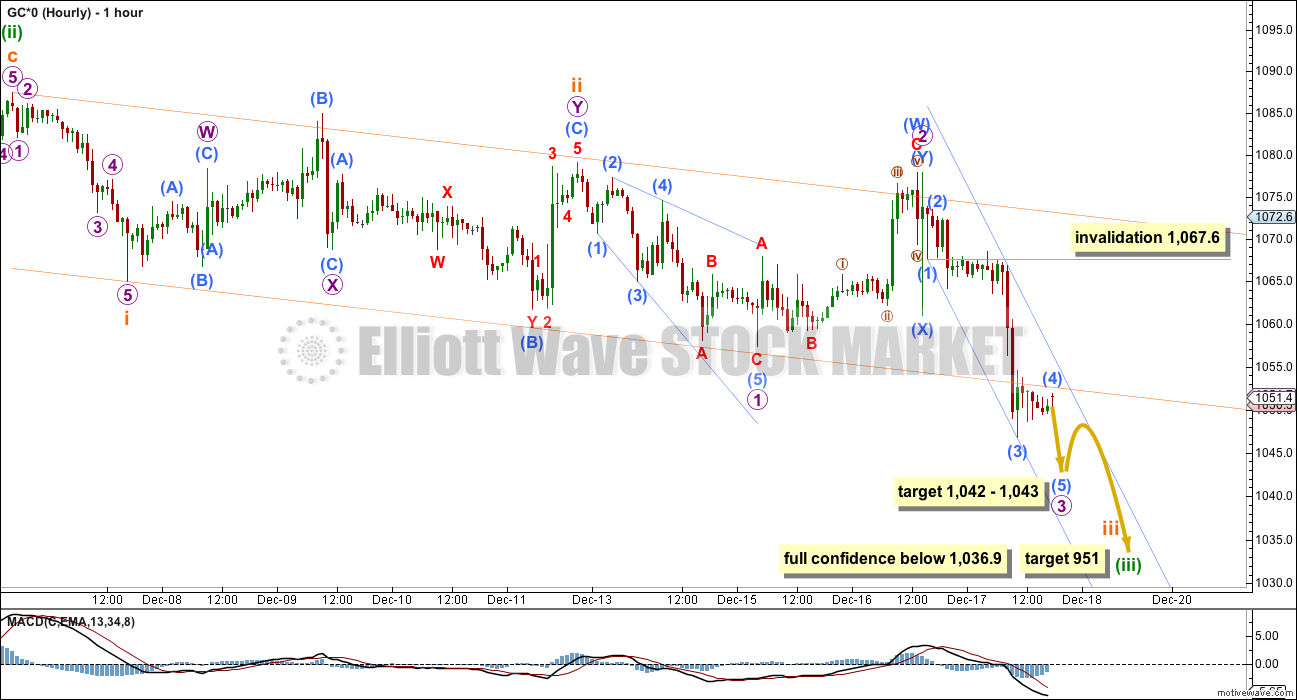
This wave count looks at minuette wave (ii) as a complete expanded flat.
This would be a very quick and shallow second wave correction. There should be a strong downwards pull from the middle of a big third wave at this stage. Surprises to the downside may turn up.
Within minuette wave (iii), another first and second wave could also be complete for subminuette waves i and ii. Subminuette wave ii fits perfectly as a double combination.
Within subminuete wave iii, another first and second wave may be complete for micro waves 1 and 2. Micro wave 2 importantly ends at the second of a double top at 1,077.9. This means that the low of the price shock from yesterday labelled submicro wave (X) is part of micro wave 2 and not a first wave down. This makes a difference to invalidation points, so makes a difference to risk.
The orange channel is a base channel about subminuette waves i and ii. It has now been breached by downwards movement. A third wave should break out of a base channel about its first and second waves.
The lower edge of this base channel may now offer resistance.
The degree of labelling within micro wave 3 may yet need to be moved down one degree. This degree of labelling assumes micro wave 5 will be a long extension, typical of commodities. But if it is not, then micro wave 3 may not be close to completion.
Either way, an impulse down is probably close to completion and the fourth wave labelled here submicro wave (4) is a small regular contracting triangle. The breakout should be down when it is done. At 1,042 submicro wave (5) would reach equality in length with submicro wave (1). At 1,043 micro wave 3 would reach 1.618 the length of micro wave 1.
Submicro wave (4) may not move into submicro wave (1) price territory above 1,067.6.
When a fifth wave down completes an impulse which may potentially be micro wave 3, then there will be two equally valid ideas and two invalidation points. At that stage, if micro wave 3 is over, then the following correction for micro wave 4 may not move into micro wave 1 price territory above 1,057.4. But if this impulse is yet another first wave and not the third wave, then the invalidation point for yet another second wave correction would be back at its start at 1,077.9.
The light blue channel is a best fit about this downwards impulse. Downwards movement may end either midway within the channel or about the lower edge. When the channel is breached by upwards movement it shall indicate the downwards impulse is over and the next small correction has arrived. That small correction may find resistance at the lower orange trend line.
ALTERNATE HOURLY WAVE COUNT
Click chart to enlarge.
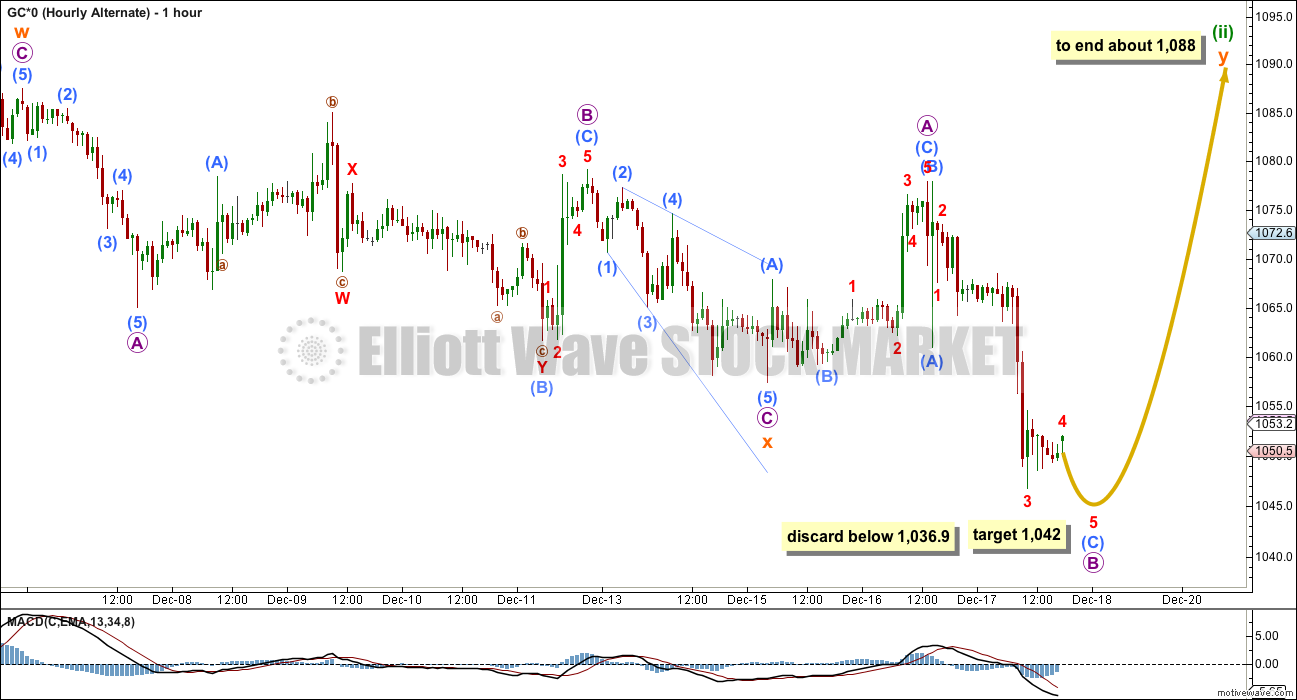
I have tried to see if minuette wave (ii) could be continuing further as a single flat correction and the subdivisions will not work.
It may still be continuing as a double flat correction though. The first expanded flat correction may not have been the entire correction of minuette wave (ii). That may have only been the first in a double flat.
The double is joined by a three in the opposite direction, a zigzag labelled subminuette wave x.
The second flat in a double is incomplete, labelled subminuette wave y.
Micro wave A is a three, a zigzag, within subminuette wave y. Micro wave B is an incomplete zigzag which is longer than the maximum common length of up to 1.38 the length of micro wave A. So far it is 1.52 the length of micro wave A. There is no rule stating the maximum length for a B wave within a flat correction, but there is a convention which states when the potential B wave reaches 2 times the length of the A wave the probability of a flat unfolding is so low it should be discarded. That price point would be at 1,036.90.
The impulse down for submicro wave (C) still needs a final fifth wave to complete it. At 1,042 minuscule wave 5 would reach equality in length with minuscule wave 1.
When the downwards impulse is complete, then how high the following wave goes will tell us which wave count is correct. A new high above 1,077.9 would invalidate the main hourly wave count and confirm this alternate. At that stage, this wave count would expect more upwards movement to end about 1,088 so that subminuette wave y ends about the same level as subminuette wave w and achieves the purpose of the second flat in a double, to move price sideways.
At this stage, because volume indicates a downwards breakout may be underway, this wave count is an alternate.
ALTERNATE ELLIOTT WAVE COUNT
Click chart to enlarge.
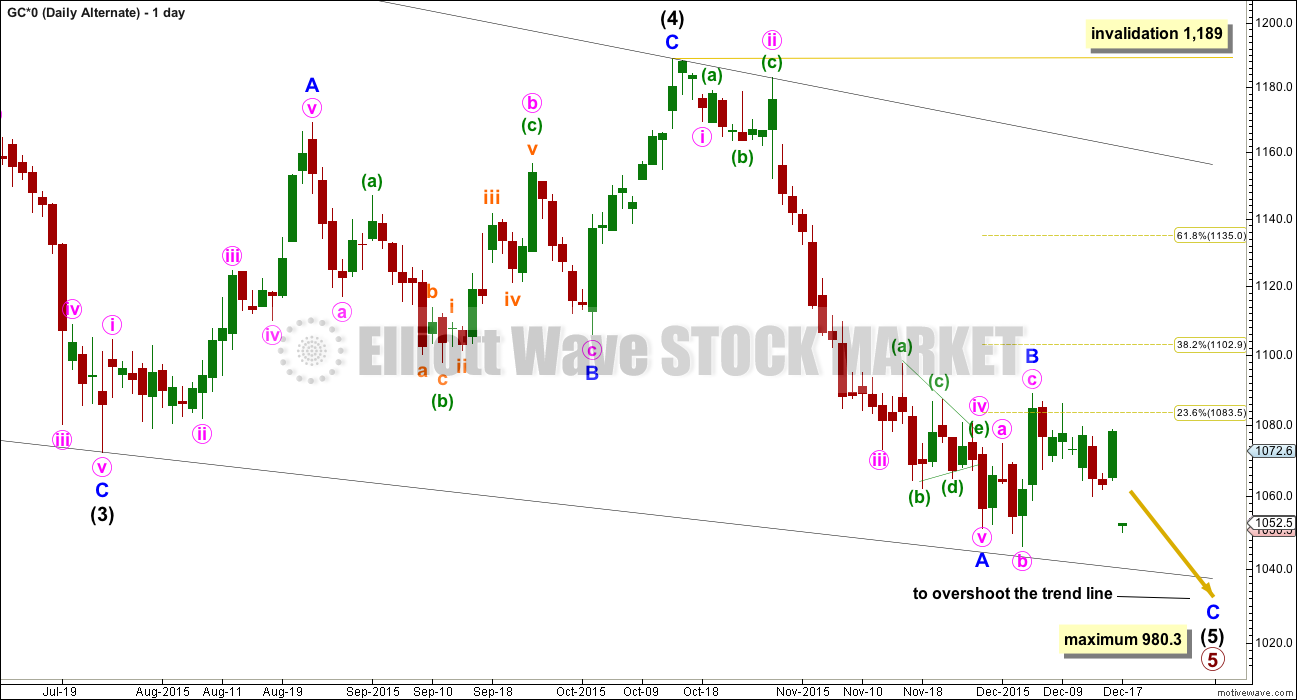
I am aware that this is the wave count which EWI and Danerics have. The implications are important, so I will follow this wave count daily for members here too.
Everything is the same up to the end of the triangle for primary wave 4. Thereafter, primary wave 5 is seen as an ending contracting diagonal.
Within the ending contracting diagonal, it is not possible to see intermediate wave (2) as a zigzag and meet all Elliott wave rules. To see an explanation of why see this video at 10:25.
The same problem exists for the ending diagonal of primary wave 5 itself. Intermediate wave (3) is longer than intermediate wave (1) which would suggest an expanding diagonal, but intermediate wave (4) is shorter than intermediate wave (2) and the trend lines converge which suggests a contracting diagonal.
From “Elliott Wave Principle” by Frost and Prechter, 10th edition, page 88: “In the contracting variety, wave 3 is always shorter than wave 1, wave 4 is always shorter than wave 2, and wave 5 is always shorter than wave 3. In the expanding variety, wave 3 is always longer than wave 1, wave 4 is always longer than wave 2, and wave 5 is always longer than wave 3.”
This structure violates the rules for both a contracting and expanding variety. If the rules in Frost and Prechter are accepted, then this is an invalid wave count.
It may be that the rules need to be rewritten to add “sometimes a third wave may be the longest within a contracting or expanding diagonal”. But I have never seen Robert Prechter publish such a rule, I do not know that it exists.
I cannot reconcile this wave count from EWI with the rules in Frost and Prechter.
If an ending contracting diagonal is unfolding, then the (1) – (3) trend line may be overshot signalling the end of intermediate wave (5). If price behaves thus and turns around and moves strongly higher, then this wave count must be accepted and the rules for diagonals will need to be rewritten.
I will continue to follow this possibility as price moves lower.
Intermediate wave (5) should be shorter than intermediate wave (1). At 977.53 intermediate wave (5) would reach equality in length with intermediate wave (1). A new low below this point would take this possible diagonal structure too far from the rules. At that stage, it really should be finally discarded.
All sub waves within ending diagonals must subdivide as zigzags. Within the zigzag of intermediate wave (5), minor wave B should unfold over several days. At this stage, there is no divergence between this idea and the main Elliott wave count.
Minor wave B may not move beyond the start of minor wave A above 1,191.66.
I am uncomfortable with publishing this wave count and I only do so because it has been published by Elliott Wave International. I am not comfortable with publishing any wave count which violates the rules in Frost and Prechter. However, when looking at primary wave 5 on the weekly chart it does look like a diagonal is unfolding.
Short to mid term there is no divergence in expected direction between this wave count and the main wave count.
The same idea for Silver now works on COMEX data. An ending expanding diagonal, which meets all Elliott wave rules, may be close to completion for Silver. This adds slight support to this alternate idea for Gold.
TECHNICAL ANALYSIS
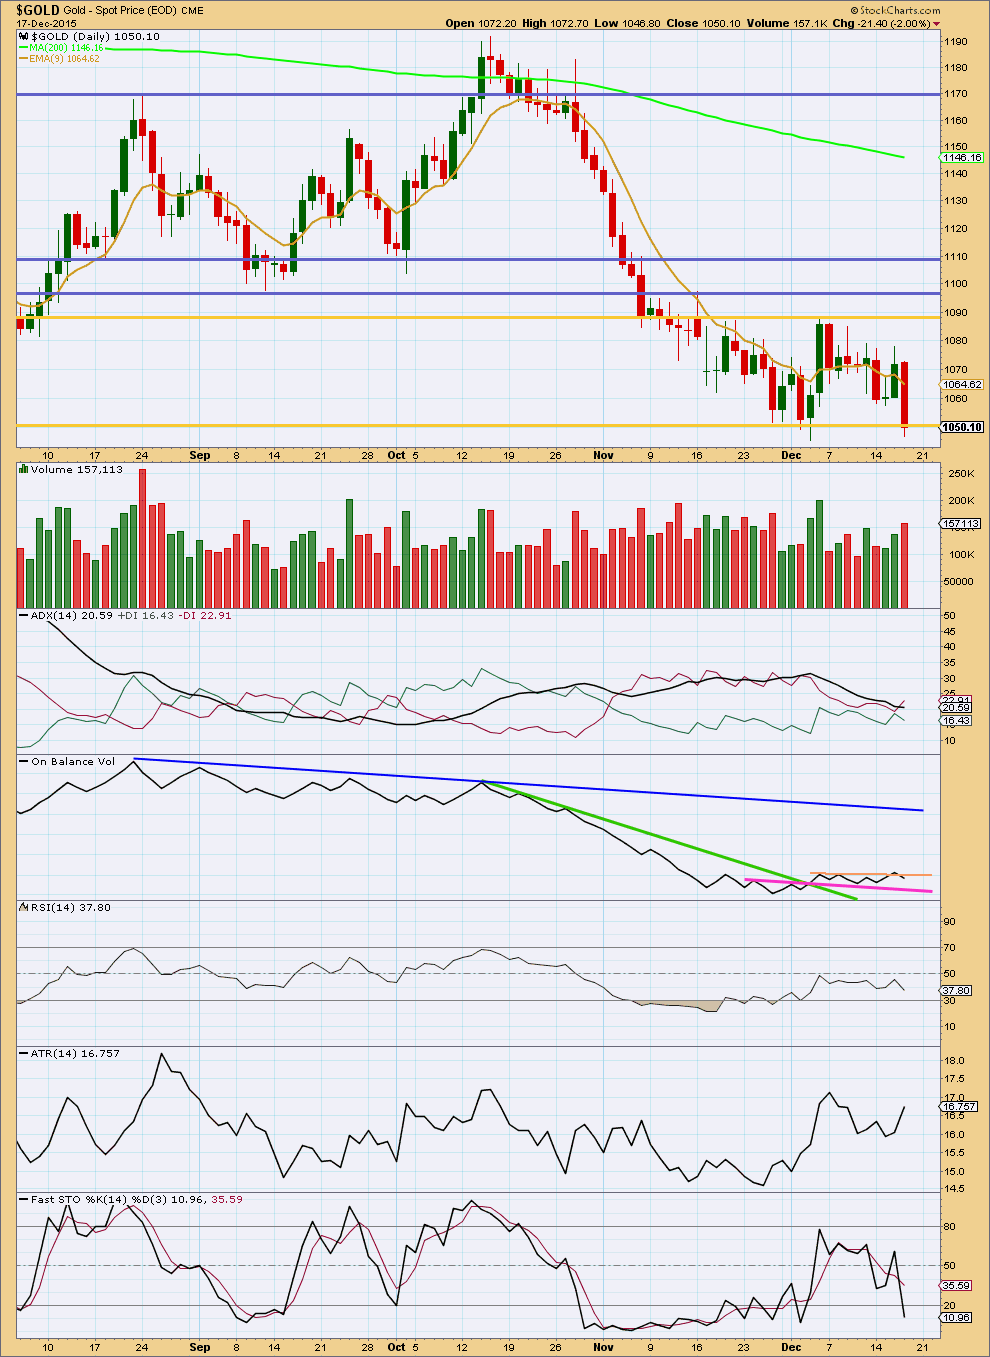
Click chart to enlarge. Chart courtesy of StockCharts.com.
A strong downwards day comes with volume which is higher than any prior day since the start of the consolidation on 7th December (if the price low on a volume spike on 4th December is taken as the end of the prior trend). Because volume for this day is stronger than any day during the consolidation, it looks like a downwards breakout may be underway. The downwards move in price today was nicely supported by volume.
A second strong downwards day below the support line about 1,050 would add confidence to a downwards breakout.
ADX is flat but the red -DX line remains above the green +DX line. If the ADX line again turns upwards, a downwards trend would be again indicated. ATR is beginning to increase indicating the market is likely trending again.
On Balance Volume has not yet broken out of its small sideways zone. A break below the pink trend line for OBV would add confidence to a downwards trend. There is some cause for concern today from OBV: from the price high of 4th December to the price high of 16th December, price made a lower high but OBV made a higher high. This indicates weakness in downwards movement and is bullish.
Due to the concerns from volume and On Balance Volume, I would want to see another red candlestick with strong volume and a break by OBV below its pink trend line. If these two things happen in the next few days, then I would have full confidence that a downwards trend has resumed. At that stage, I would expect to see a throwback to the lower line of resistance about 1,050. If price throws back, then it would offer a perfect opportunity to join the trend.
This analysis is published about 07:55 p.m. EST.
Lara, if the alternate daily plays out with the large ending diagonal, how much of a throw over is expected? Because the diagonal is so big, could the throw over last more than a day?
Hope you have a wonderful holiday!
I’d expect a day or so. It may not properly breach the line, it may just overshoot. The trick is as soon as a daily candlestick moves below that line look out. It could be all over.
Once that happens I would not want to be short this market.
I’m leaning toward the alternate and I’m thinking we get that push down in the next 5 to 7 trading days. I am ready with my bullets to fire.
What is fascinating about the COT structure is that the swaps have managed to take price this low all while transferring short contracts over to the managed money. If this is the alt count, the firepower is there to launch like Lara suggests.
Agreed. Watching closely.
LARA is doing a mega written and video analysis for this weekend, which is the last analysis until January 4th.
Gold futures finish with a weekly loss of 1%
Dec 18, 2015 3:19 p.m. ET
http://www.marketwatch.com/story/gold-gets-a-lift-as-dollar-turns-lower-2015-12-18
Kitco Gold Survey: No Clear Direction For Gold During The Holidays
Friday December 18, 2015 12:11
http://www.kitco.com/news/2015-12-18/Kitco-Gold-Survey-No-Clear-Direction-For-Gold-During-The-Holidays.html
This consolidation has proven a nightmare to analyse and my accuracy rate during it is pretty bad. I am sorry for it. With the multiple possibilities its hard to avoid.
What we need to focus on is waiting for confirmation of a breakout.
And what I need to do today for an analysis to see you through the next two weeks is present as many alternate possibilities for Gold as I can possibly see.
So there’ll be a lot of charts to digest. And a rather long video.
Lara is wasn’t your fault. You were brave enough to tackle analyzing gold.
I’ll blame it on the FED.
I think its more a fact of life with corrections. For a second wave there are 17 possible structures. Thats a lot of potential variation.
The thing I really want members who aren’t experienced traders to learn here is don’t trade corrections, and if you absolutely insist on trying to do so don’t trade in the direction against the main trend.
I’ve been avoiding trading Gold during this time. There are plenty of other opportunities. Oil, FTSE and S&P are offering good profits.
My analysis of the last wave down as an incomplete impulse was wrong.
On the five minute chart there are a lot of shallow quick fourth wave corrections in that move. I counted one too few I think, and so I expected a final fifth wave down. I did that because it looked like a fourth wave triangle was unfolding at the time I did the analysis.
What now fits is that was a complete impulse. (It will also fit as a zigzag).
Upward movement may be another deep second wave correction for the main wave count.
Or it may be the last leg up of this consolidation to complete a double flat for minuette (ii).
Look at the daily chart and that cyan trend line. Price is perfectly finding resistance there.
What happens next is important. If the trend line is breached by an upwards day then the consolidation is not over, expect some more upwards movement. Again, it would be a correction so it may be very choppy and overlapping. We’d be back to waiting for a breakout 🙁
If price bounces down from here then expect the downwards trend has resumed. A third wave down (or for the alternate daily a C wave down) should be underway.
When price trends it usually finds resistance / support at a sloping trend line. So if this cyan line holds use it for resistance. Each time price touches the line that’s a potential opportunity to join the trend at a good price. That’s the technique I use anyway.
Stock market and US dollar dropping today, which tends to adjust sentiment to more bullish gold.
Instead of a breakout down to 1,042.43 gold got bullish and broke above the main hourly wave count invalidation of 1067.60 for submicro wave (4).
However even the only hourly chart remaining Hourly Alternate wave count has the lower target of 1,042.
So with gold looking bullish today can gold still hit the 1,042 target before heading up to 1,088 target or is that unrealistic and the lower target may somehow be considered as completed somehow in a adjusted count for the alternate after the upwards breakout?
The break of the channel on the hourly chart before any downwards movement was an indication that my analysis of that downwards move was wrong.
There can be another small quick fourth wave in there, the impulse was complete.
This upwards move is either a deep second wave correction for the main hourly or it’s the last leg up of minuette (ii) as a double flat for the alternate.
Look at the daily chart and where price is finding resistance, at the trend line. It has come up to perfectly touch that line. If it can break above then this is minuette (ii), but if it finds resistance here and bounces down from the line then it’s minuette (iii) underway.
Lara:
I want to show a potential alternate count which moves green (i) down to where you have orange b…if that is possible, we have orange i up, orange ii down with yesterday’s low (zig zag?), and potentially we are now in a wave orange iii up to complete a five wave (ii) green up?
This is simply a thought as gold COTs are very bullish, there is technical divergence, and wave ii’s can be deeper.
The implications are that we are about to start the middle of a third wave up for this green ii correction.
Thank you!
Pretty wild. The bulls will love your chart.
Not really that bullish…just another way to count the correction.
Us bulls will be a lot happier to see an end to the daily alternate diagonal down before year end followed by some months of upward movement.
The only way that would work is if Subminuette 5 down was an ending diagonal. Lara would need to see if the subdivisions fit the rules.
Overall though I don’t think it works because cycle wave a is incomplete.
minuette (ii) green up has to be a 3, perhaps a zigzag.
From Lara’s work, what you have as subminuette i orange is a 5, then your subminuette ii has to be a 3, and then the move up to minuette (ii) has to be a 5.
Corrections (which is what a second wave is) don’t subdivide into five wave impulses.
But relabel that micro 1-2-3-4-5 for subminuette a of a zigzag and you’ve got a wave count.
But I cannot resolve how minuette (i) would end at the price low on 3rd Dec. That would ignore the fourth wave triangle and the fifth wave subdivisions… I’d have to see if that could work on the hourly chart.
There’s another problem actually that I struggled with yesterday. The move down from the high on 4th Dec labelled minuette (ii) to yesterdays low is really difficult to analyse. It won’t subdivide as a complete correction. I just could not get that to fit yesterday.
I’ll take another look today, because it it can work then this may be a single flat correction and we could be in wave C up.
So only wave count remains is the expanded flat PO of 1088????
The main wave count appeared to have been invalidated above 1067.60 at 10:10 am when gold hit 1,070.07 as per warning on submicro wave (4) invalidation point.
Watch invalidation 1067.60 right now is the signal of higher or lower
Sorry, no. It should be the final decider at 1,077.9
GLD looks to be approaching long term significant support. Maybe the ending diagonal will play out for a significant bounce (cycle wave b), which could carve out a right shoulder. Then the H&S pattern plays out for cycle wave c. Just a thought.
http://www.safehaven.com/article/39888/gold-pullback-now-equals-1976-pullback
FTSE just published over at Elliott Wave Stock Market.
I see a nice set up over there. Looks pretty bearish to me at this time. Reasonable reward for the risk.
FTSE EW analysis is working like a charm. What is the short etf on NYSE?
Not sure. I have a NZ broker, I’m trading CFD’s on the cash index UK100
If I may I’d like to quote Matt from yesterday’s post, I think he has a good perspective on price movement:
“I may be dead wrong, but….
There is a small gap on the USD chart, which will need to be filled eventually. This may, in turn, affect gold. While I am overall still bearish, I don’t believe that this correction is over and anticipate a snapback rally. That may start as soon as tomorrow.
I should add that I don’t think that gold will completely break down until the USD definitively sails past 100. I do expect that moment to come eventually, but not right now.” Matt
This works with the current alternate view of a double flat correction taking place.
Happy Trading everyone!
You may be right as it appears the main hourly was invalidated at 10:10 am
Lara,
I noticed that the main count has subminuette i and ii and iii(orange) lasting almost a total of month from mid October to mid November. I recall in the past we had some counts that were off by a degree or two. According to your reference chart, which I know isn’t a hard and fast rule, subminuette is referenced as minutes, but here its charted as lasting days (maybe weeks?). Could we be off by a degree or two in the main count?
The alternate (ending diagonal) idea has better time frames actually.
And I think you mean subminuette iii? not i?
It lasted 11 days. Yes, that’s a lot longer than minutes, but yes, it should be a very rough guide line only. Particularly the lower degrees.
It is cycle and primary degrees (and those above of course too) that are the important ones to get right. Cycle degree waves should last one to several years. On the weekly chart this is right. Within cycle wave a the primary waves are all a few months to a couple of years (except the extended primary 3 which was longer).
For the main count if I move the degree of this last wave down from the high of minute ii at 1,189 all up one degree, then minute iii would be over and the consolidation would be minute iv not minuette (ii). But it overlaps back into minute i price territory. So it just won’t work.
That’s pretty much why I have the degree as I do.
But again, I note that the degrees are better within primary 5 for the alternate daily wave count. Suspiciously better.
Got it, thanks for the explanation!