
Upwards movement was expected.
Summary: This second wave correction may last a total Fibonacci 13 or 21 days. It would most likely end about the 0.382 Fibonacci ratio at 1,104, because it may find resistance there at a trend line. The trend is down. This is a correction against the trend.
New updates to this analysis are in bold.
To see weekly charts and the difference between the two wave counts go here.
MAIN ELLIOTT WAVE COUNT
Click chart to enlarge.
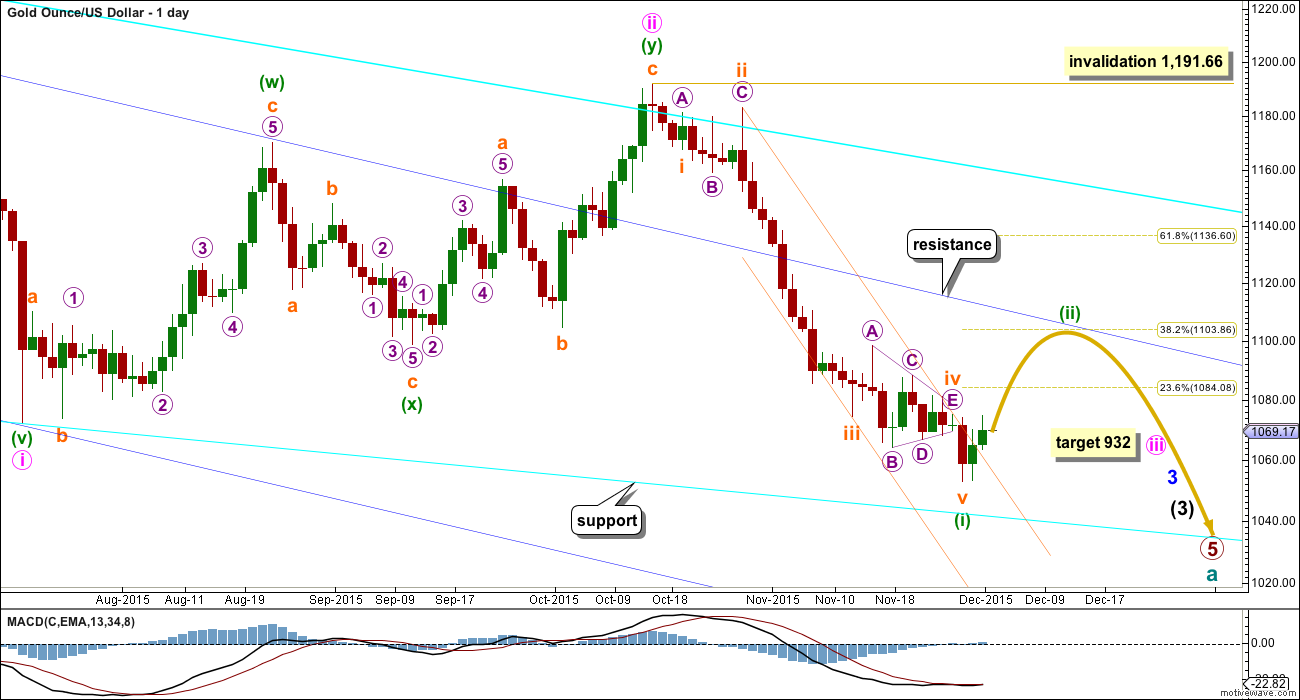
Gold has been in a bear market since September 2011. There has not yet been confirmation of a change from bear to bull, and so at this stage any bull wave count would be trying to pick a low which is not advised. Price remains below the 200 day moving average and below the blue trend line (copied over from the weekly chart). The bear market should be expected to be intact until we have technical confirmation of a big trend change.
The final line of resistance (cyan line copied over from weekly charts) is only overshot and not so far properly breached. While this line is not breached the bear wave count will remain possible. Simple is best, and the simplest method to confirm a trend change is a trend line.
Minute wave ii is a complete double zigzag and deep at 0.75 the length of minute wave i. It has breached the dark blue base channel drawn about minor waves 1 and 2, one degree higher. When a lower degree second wave correction does this it reduces the probability of the wave count but does not invalidate it. Base channels most often work to show where following corrections find support or resistance, but not always.
At 932 minute wave iii would reach 1.618 the length of minute wave i.
Minuette wave (i) is complete.
Minuette wave (ii) may find resistance at the upper dark blue trend line. This may see it end about the 0.382 Fibonacci ratio of minuette wave (i) at 1,104.
Draw a channel about minuette wave (i) using Elliott’s second technique: draw the first trend line from the ends of subminuette waves ii to iv, then place a parallel copy on the end of subminuette wave iii. When price breaks above the upper edge of this channel it should confirm a trend change. Copy the channel over to the hourly chart. This channel is also breached on the daily chart, and so more confidence may be had that minuette wave (i) is over and minuette wave (ii) is underway.
Minuette wave (i) lasted 31 days, three short of a Fibonacci 34. Minuette wave (ii) may be expected to last a Fibonacci 13 or 21 days, with 13 favoured at this stage. It may also be more brief than this due to the strong downwards pull of the middle of a big third wave. Analysis this week and next will focus on identifying a potential end to this correction.
At this early stage, it is impossible to determine which of several possible structures may unfold for minuette wave (ii). Today I have two hourly charts which look at upwards movement at two different wave degrees. The implications of the differences is important.
FIRST HOURLY WAVE COUNT
Click chart to enlarge.
At this stage, I consider this first hourly chart to have a lower probability than the second below.
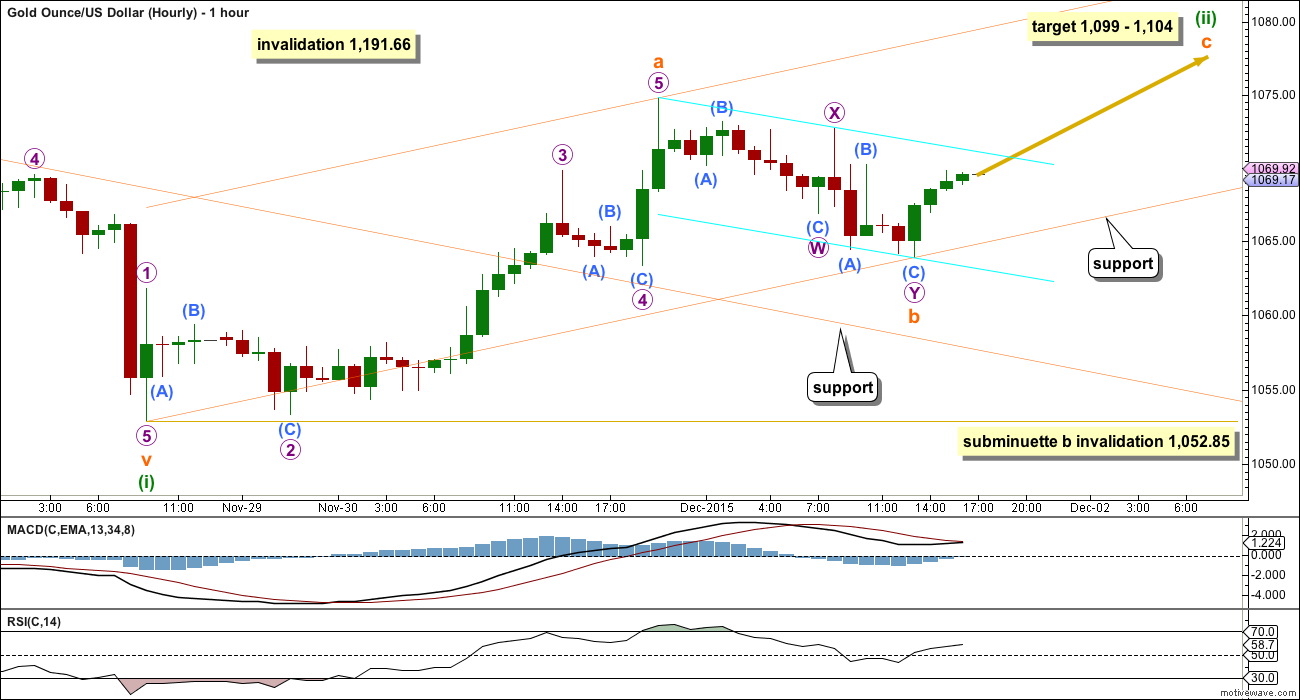
So far there is a complete five up and three down. This may be subminuette waves a and b of a quick shallow zigzag.
I only publish this idea now because of the potential for minuette wave (ii) to be more quick and shallow than normal due to the strong downwards pull from the middle of a third wave. If the main daily wave count is correct (as opposed to the alternate), then we should be looking out for possible surprises to the downside. The next move when minuette wave (ii) is complete should be a third wave at four degrees; the next downwards move for this wave count should be very strong indeed.
At 1,099 subminuette wave c would reach 1.618 the length of subminuette wave a. This is close to the 0.382 Fibonacci ratio at 1,104 giving a $5 target zone. Subminuette wave c must subdivide as a five wave structure.
Because subminuette wave a was a five wave structure, subminuette wave b, if it continues any further, may not move beyond its start below 1,052.85.
It is possible to see subminuette wave b as a completed double zigzag at this stage. When the small cyan trend channel drawn about it is breached by upwards movement, then a little more confidence may be had that it is over. A new high above 1,072.69 would provide further price confidence that it should be over. At that stage, upwards movement may not be a correction within the second zigzag, so the second zigzag would have to be over.
Along the way up, downwards corrections should find support at the lower edge of the orange channel drawn about minuette wave (ii). If that upwards sloping trend line is breached, then the next line to offer support should be the upper edge of the downwards sloping orange channel (copied over from the daily chart).
SECOND HOURLY WAVE COUNT
Click chart to enlarge.
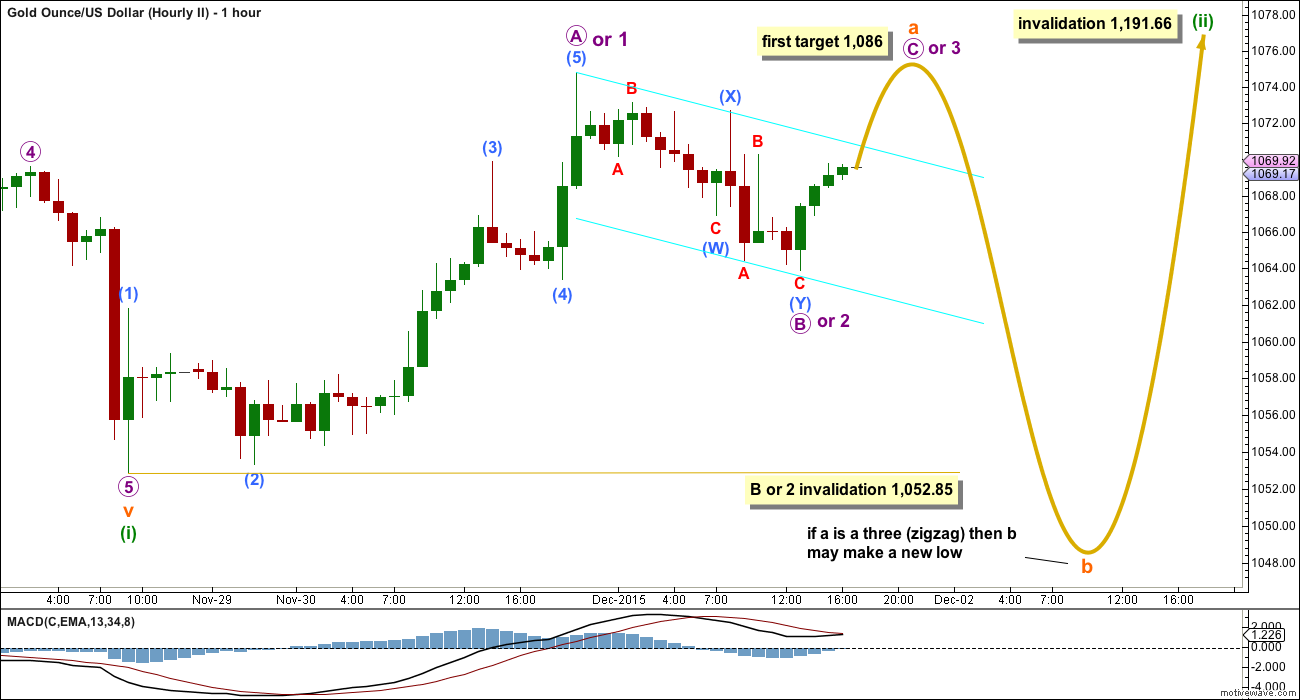
The degree of labelling within movement within minuette wave (ii) is moved down one degree in this chart. All the subdivisions are seen in the same way.
The first five up may be micro wave A of a zigzag or micro wave 1 of an impulse.
Because the first wave up subdivides as a five the following three down may not make a new low below its start at 1,052.85. Micro wave B may not move beyond the start of micro wave A, and micro wave 2 may not move beyond the start of micro wave 1. The rule for a second wave is the same as the rule for a B wave within a zigzag.
The small cyan channel about micro wave B or 2 is drawn in the same way and should be used in the same way. A new high above 1,072.69 would provide price confirmation that micro wave B or 2 is very likely to be over.
This wave count expects the next wave up to also be a five.
When the next wave up is complete, then how low the following correction goes may start to eliminate one or more potential corrective structures for minuette wave (ii).
For now both hourly wave counts have the same invalidation point and the same expectation of a five up to unfold from here.
At 1,086 micro wave C or 3 would reach equality in length with micro wave A or 1. If upwards movement for the next wave stops about this first target, it would more likely be a C wave than a third wave, and so a zigzag upwards would more likely be unfolding than an impulse.
Once the next five up is complete, then if the following correction goes back into micro wave A or 1 price territory, then it may not be a fourth wave correction and a zigzag upwards would be complete. At that stage, a zigzag for minuette wave (ii) could be eliminated and a new low would be possible for a B wave of an expanded flat. However, if the correction remains above micro wave A or 1 price territory, then it would most likely be a fourth wave and minuette wave (ii) would most likely be a zigzag or zigzag multiple.
ALTERNATE ELLIOTT WAVE COUNT
Click chart to enlarge.
I am aware that this is the wave count which EWI and Danerics have. The implications are important, so I will follow this wave count daily for members here too.
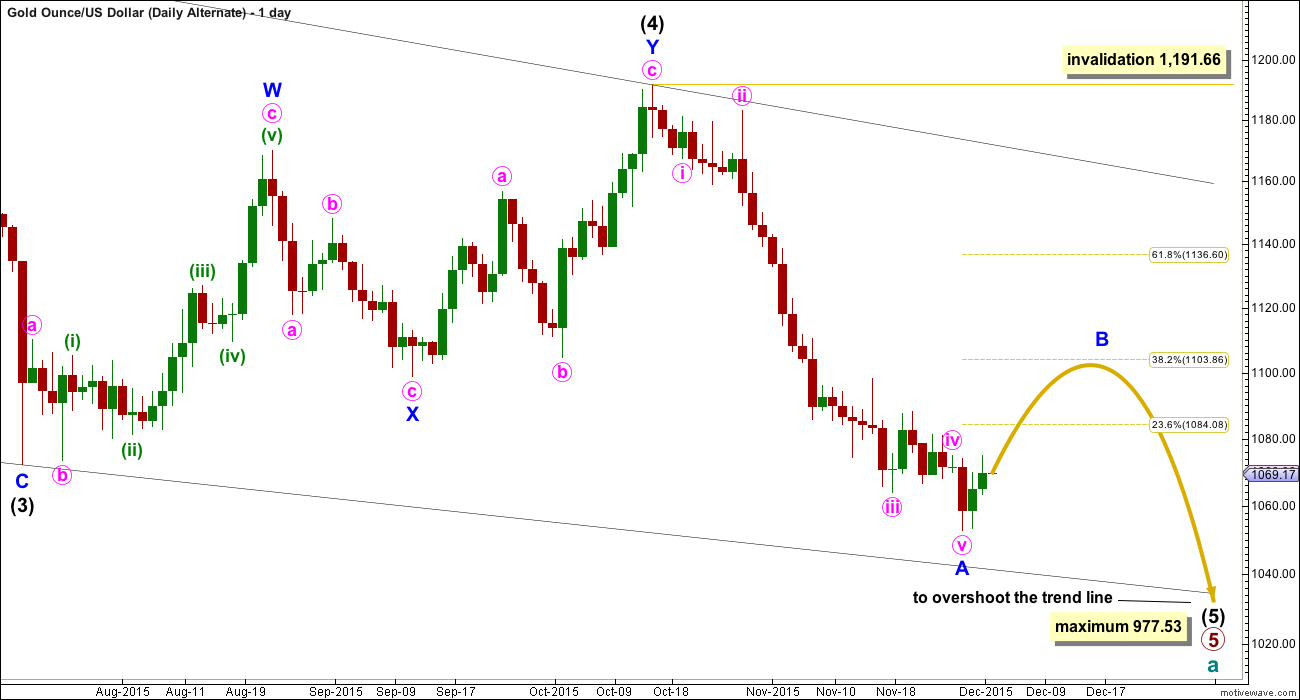
Everything is the same up to the end of the triangle for primary wave 4. Thereafter, primary wave 5 is seen as an ending contracting diagonal.
Within the ending contracting diagonal, it is not possible to see intermediate wave (2) as a zigzag and meet all Elliott wave rules. To see an explanation of why see this video at 10:25.
The same problem exists for the ending diagonal of primary wave 5 itself. Intermediate wave (3) is longer than intermediate wave (1) which would suggest an expanding diagonal, but intermediate wave (4) is shorter than intermediate wave (2) and the trend lines converge which suggests a contracting diagonal.
From “Elliott Wave Principle” by Frost and Prechter, 10th edition, page 88: “In the contracting variety, wave 3 is always shorter than wave 1, wave 4 is always shorter than wave 2, and wave 5 is always shorter than wave 3. In the expanding variety, wave 3 is always longer than wave 1, wave 4 is always longer than wave 2, and wave 5 is always longer than wave 3.”
This structure violates the rules for both a contracting and expanding variety. If the rules in Frost and Prechter are accepted, then this is an invalid wave count.
It may be that the rules need to be rewritten to add “sometimes a third wave may be the longest within a contracting or expanding diagonal”. But I have never seen Robert Prechter publish such a rule, I do not know that it exists.
I cannot reconcile this wave count from EWI with the rules in Frost and Prechter.
If an ending contracting diagonal is unfolding, then the (1) – (3) trend line may be overshot signalling the end of intermediate wave (5). If price behaves thus and turns around and moves strongly higher, then this wave count must be accepted and the rules for diagonals will need to be rewritten.
I will continue to follow this possibility as price moves lower.
Intermediate wave (5) should be shorter than intermediate wave (1). At 977.53 intermediate wave (5) would reach equality in length with intermediate wave (1). A new low below this point would take this possible diagonal structure too far from the rules. At that stage, it really should be finally discarded.
All sub waves within ending diagonals must subdivide as zigzags. Within the zigzag of intermediate wave (5), minor wave B should unfold over several days. At this stage, there is no divergence between this idea and the main Elliott wave count.
Minor wave B may not move beyond the start of minor wave A above 1,191.66.
I am uncomfortable with publishing this wave count and I only do so because it has been published by Elliott Wave International. I am not comfortable with publishing any wave count which violates the rules in Frost and Prechter. However, when looking at primary wave 5 on the weekly chart it does look like a diagonal is unfolding.
Short to mid term there is no divergence in expected direction between this wave count and the main wave count.
TECHNICAL ANALYSIS
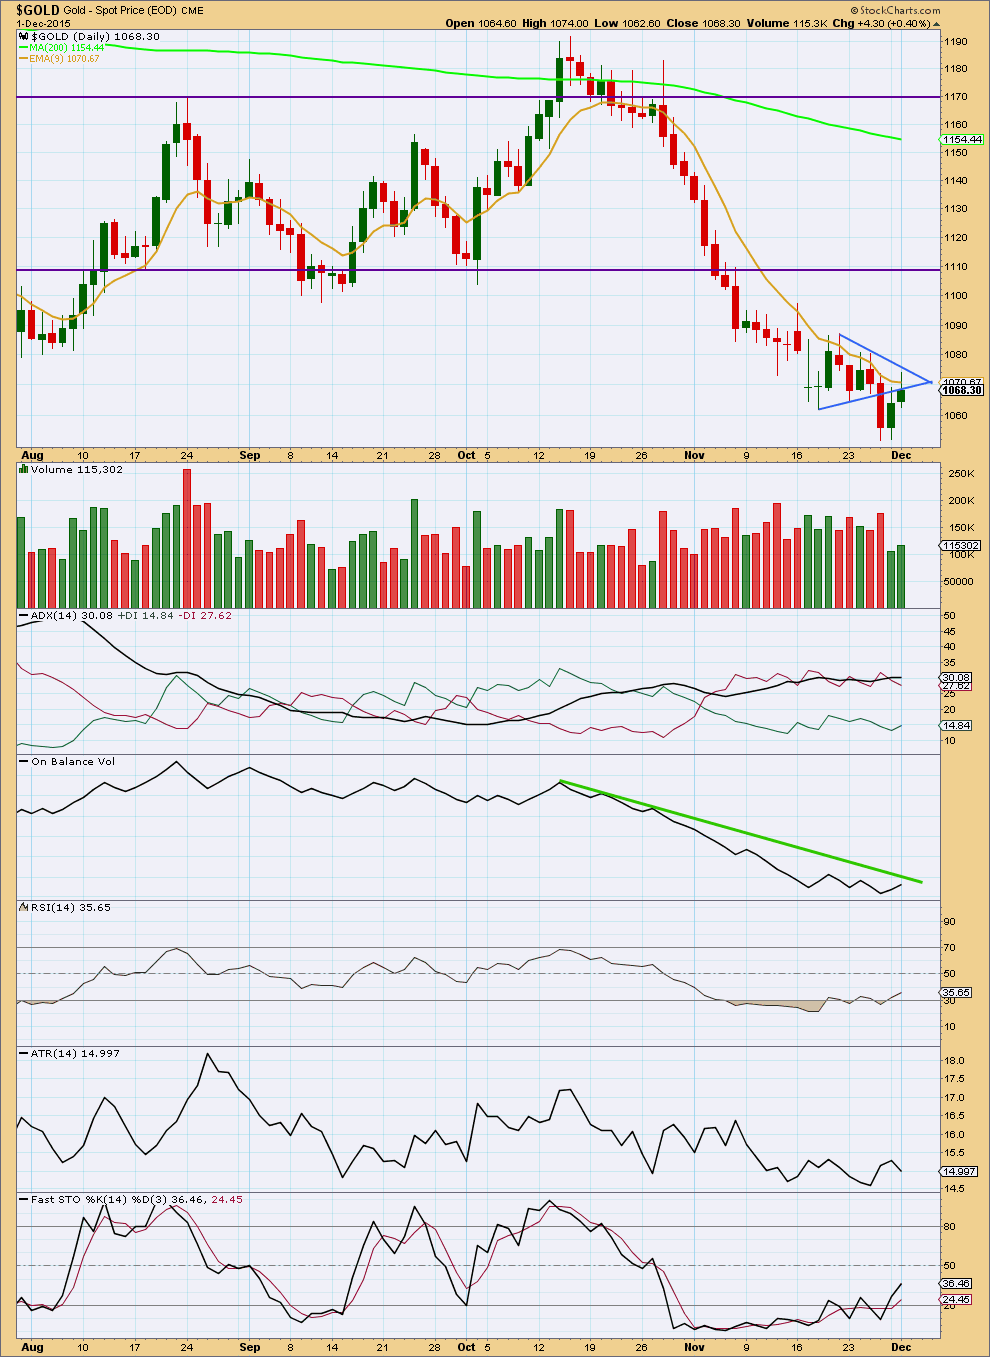
Click chart to enlarge. Chart courtesy of StockCharts.com.
A small increase in volume provides some small support for upwards movement, but volume for the last two upwards days is low. This supports the Elliott wave counts which expect that this upwards movement is a correction against the trend and not the start of a new trend.
ADX still indicates a downwards trend is in place. ATR is beginning to look less clear today. It is quite low and not clearly turning upwards. This is more indicative of a consolidation than a trend.
RSI and Stochastics are returning from oversold. More upwards movement may be expected to return further above oversold before there would be room again for more downwards movement.
On Balance Volume is coming close to its green trend line. This may provide some resistance and may assist to show where an interruption to the upwards correction may begin. When OBV touches that green line I would expect a downwards reaction from price at that time. If OBV does not find resistance at the green line and breaks above it, then I would expect more upwards movement from price to not be interrupted.
This analysis is published about 06:36 p.m. EST.
I am afraid it continues to have slowmotion outbreak downwards in the remaining days. This kind of motion would not have a quick instant rebounce for correction but keep on slow burn to the trending direction. At least TA signal not likely reverse at this time in hourly chart.
There’s a hammer and a bullish engulfing candlestick pattern on the hourly chart at the low for today.
Thank u lara..
Give a small focus on oil please..actually i did a mistake nd traded for correction…thats why im a bit concern:(
I see Oil has invalidated its count 🙁
I’ll post an updated daily chart today after I’ve done Gold, S&P and Silver.
Tuesday I got out of mine shorts after reading Mondays report. Good thing I did not go long!!!!!!LOL.. I would not trade against the major trend.
Looking for the report.
I think I’m getting seasick in these rogue gold waves! LOL
That’s the nature of corrections. Whipsaws.
There’s a hammer and a green candlestick forming on the hourly chart.
It looks like there’s a low in for today.
Gold falls 1% as dollar climbs ahead of ECB, US payrolls – 1 pm Dec 2
http://www.cnbc.com/2015/12/01/gold-inches-higher-on-short-covering-weak-us-data.html
IMHO …. at this stage it is not worth considering anything above 1068…
My analysis of the upwards wave labelled subminuette wave a as a five was wrong.
It was a three.
It fits very well as a three. And I should have had that as an alternate.
This new low is wave B of a flat. So far it is 1.08 times the length of A, which is a little longer than the minimum for an expanded flat which is 1.05. Expanded flats are the most common type of flat, they’re very common structures.
I’m watching the current hourly candlestick. If it completes as a hammer we may have a low for today.
The target for C to end is 1,087, it would reach 1.618 X A.
Once we have some indication of a low in place then upwards movement should unfold for maybe three days to total a Fibonacci five for this correction.
I think it looks like it may be more brief and shallow than second waves normally are.
I’ll still have to consider the alternate degree of labelling; the expanded flat may be only subminuette a forming.
If downwards movement continues from here then at 1,031 B would reach 2X A. At that stage the idea of a flat should be discarded due to an exceptionally low probability.
Thanks for the update. I was a little concerned with the invalidation, but kept thing about the COT and how bullish it was.
LOL!! Same here. Infect gold may just move sideways till Friday. It will be interesting to see this wknd report. It should bullish.
Did Lara limit the bounce to 1987 now not 1101????
Yes The target for C to end is 1,087
Only if the B wave doesn’t move lower.
There’s a hammer followed now by a green candlestick forming on the hourly chart.
Looks like that’s it for now, up from here for a bit.
If this C wave is an ending diagonal it may be choppy, overlapping and time consuming.
If it’s an impulse should be over more quickly with clearer upwards movement.
Appreciate your inputs today. Do you have a chart in progress we can view before your end of day analysis?
Sorry! Only just now came back and saw your comment.
Gold just invalidated at 12:15 pm dropped to 1,050.84.
Unless it wasn’t wave B or 2 and was wave b and just made a new 5 1/2 year gold low since February 5th, 2010 low at 1,044.53.
That means my analysis of subminuette a as a five was wrong.
It was a three.
Which means this is most likely wave B of an expanded flat.
Give some update on oil..
Gold Extends Early Losses, Hovers Near 5.5-Year Low
Wednesday December 02, 2015 10:23
http://www.kitco.com/news/2015-12-02/Gold-Extends-Early-Losses-Hovers-Near-5-5-Year-Low.html
Lara..
Gold coming down and so crude…im waiting to get proper level to join the trend…but this market is not giving chance…waiting for a proper correction since 2weeks now..will there be a correction..??
In the context of Lara’s hourly II count, it looks to me like wave micro B (or micro 2) is a complete or nearly complete double zigzag.
There has been a little correction. Now waiting to see if 1052.85 will be invalidated and if 1,086 is still in play before drop or if it started early due to ADP strong job report at 8:15 am today.
NUGT and GDX went bearish at 8:15 am then again at 10:15 am.
Wild gyrations daily and nightly makes Miners 3X ETF at risk other than intraday swings.
This is part of the correction.
When the session is finished volume will be telling. If this is part of a correction then volume should be relatively light.
This is wave B of an expanded flat. They make new price extremes. Wave C should move up and end above 1,075
ADP report was strong because Gold crashed when it came out at 8:15 am
8:18a
Treasury yields jump after ADP report
Private sector adds the most jobs in five months, ADP says
Dec 2, 2015 9:09 a.m. ET
http://www.marketwatch.com/story/adp-says-private-sector-added-217000-jobs-in-november-2015-12-02
Lara..
Today is ADP data and also Yellen speech.we have EW hourly green projection for gold today..Another thing thers OPEC meet on 4th and ther also we have same projection…Does US datas and News effect wave counts..??..or they dosent matter…??
I find that when the “news” moves the markets it fits nicely into an EW count. A third wave or a C wave, or for Gold a strong fifth wave, is often part of a strong movement which follows a news release.
If we think the market may be ready for a third wave, fifth wave or C wave (sometimes even a first wave, they can begin quite sharply) then it may begin at that time.
Ok thank u..
Gold needs to close above 9ema and move to strong resistance area 1104. Gold’s counter trend rally supported by TA above.
With COT being bullish expect gold to move higher as per EW counts.