
Upwards movement was expected.
Summary: The target for this correction to end is at 1,082 – 1,084. It may reach the target in four more days time. Upwards movement is still expected to be a correction against the downwards trend.
New updates to this analysis are in bold.
To see weekly charts and the difference between the two wave counts go here.
MAIN ELLIOTT WAVE COUNT
Click chart to enlarge.
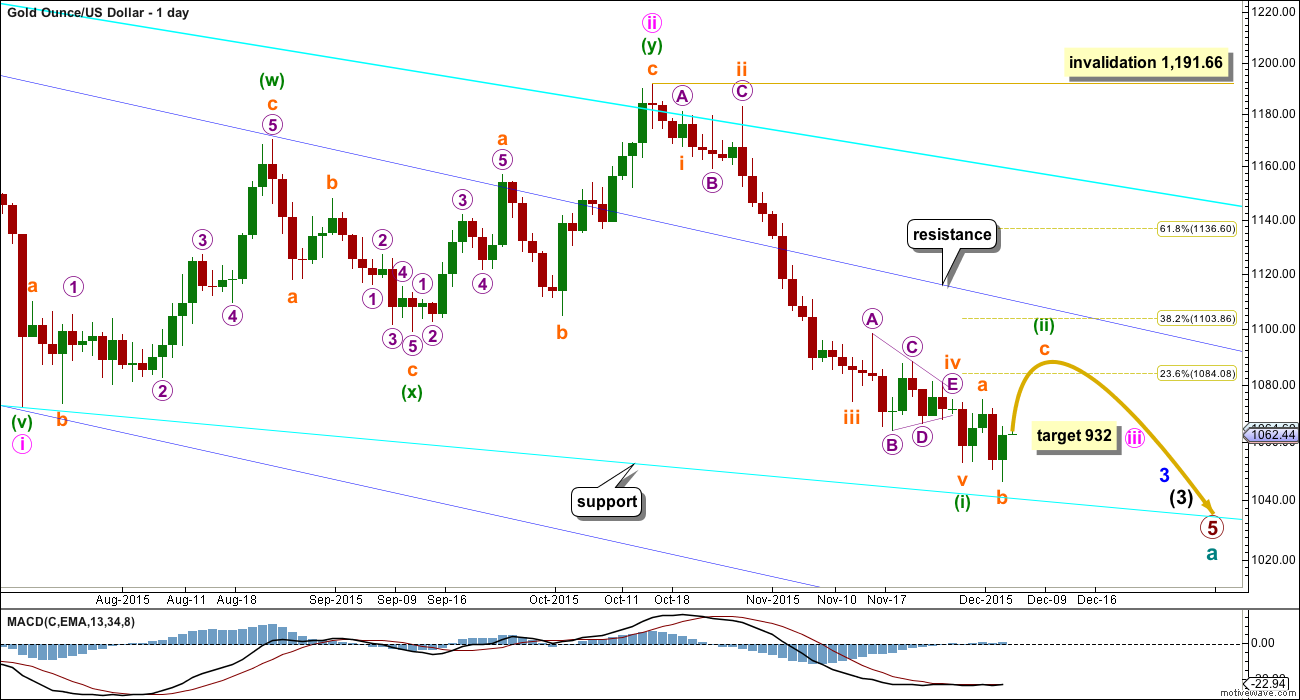
Gold has been in a bear market since September 2011. There has not yet been confirmation of a change from bear to bull, and so at this stage any bull wave count would be trying to pick a low which is not advised. Price remains below the 200 day moving average and below the cyan trend line (copied over from the weekly chart). The bear market should be expected to be intact until we have technical confirmation of a big trend change.
The final line of resistance (cyan line copied over from weekly charts) is only overshot and not so far properly breached. While this line is not breached the bear wave count will remain possible. Simple is best, and the simplest method to confirm a trend change is a trend line.
Minute wave ii is a complete double zigzag and deep at 0.75 the length of minute wave i. It has breached the dark blue base channel drawn about minor waves 1 and 2, one degree higher. When a lower degree second wave correction does this it reduces the probability of the wave count but does not invalidate it. Base channels most often work to show where following corrections find support or resistance, but not always.
At 932 minute wave iii would reach 1.618 the length of minute wave i.
Minuette wave (i) is complete.
Minuette wave (ii) may find resistance at the upper dark blue trend line. This may see it end about the 0.382 Fibonacci ratio of minuette wave (i) at 1,104.
Minuette wave (i) lasted 31 days, three short of a Fibonacci 34. It looks like minuette wave (ii) may be more brief and shallow than second wave corrections normally are, at this stage, due to the strong downwards pull from the middle of a third wave. So far it has lasted four days. If it continues now for a further four days, it may total a Fibonacci eight.
Minuette wave (ii) looks like it is most likely unfolding as an expanded flat correction at this stage. When this structure is complete, then we must consider the alternate idea that the expanded flat is only wave A within the correction. An alternate would then be published that moves the degree of labelling within the expanded flat down one degree and expects minuette wave (ii) to continue further as a larger flat correction, double flat or combination.
Minuette wave (ii) may not now be unfolding as a zigzag or zigzag multiple. It may also not be a triangle. The only two possible structures now would be an expanded flat or a combination. The two hourly wave counts below look at both these possibilities in order of probability.
MAIN HOURLY WAVE COUNT
Click chart to enlarge.
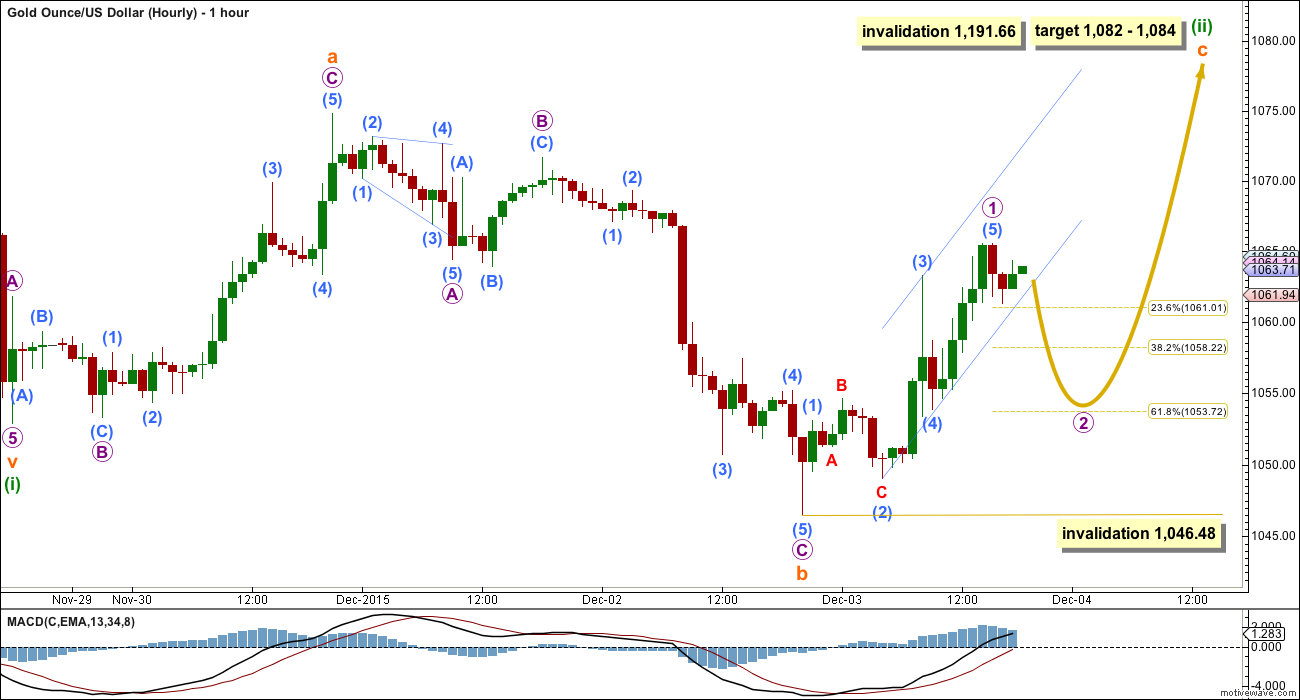
Subminuette wave b moved a little lower to be 1.29 times the length of subminuette wave a, nicely within the normal range of 1 to 1.38.
Thereafter, the small channel drawn about micro wave C was breached by upwards movement confirming an end to micro wave C and the start of a new upwards wave.
So far within subminuette wave c micro wave 1 looks to be complete. Micro wave 2 may correct to either the 0.382 or 0.618 Fibonacci ratios of micro wave 1, with the 0.618 Fibonacci ratio preferred.
Thereafter, a third wave up within this five wave impulse of subminuette wave c should unfold.
If the whole structure lasts another four days, it may complete in a Fibonacci eight days total. For it to continue for four more days, we may see a red candlestick or doji for one or both of micro waves 2 and 4.
A small channel is drawn about micro wave 1. While price remains within the channel it is entirely possible that my labelling of micro wave 1 as complete is wrong, the final fifth wave up may be extending further.
When the channel is breached by a full hourly candlestick below the lower edge and not touching it that shall provide trend channel confirmation that micro wave 1 is over and micro wave 2 downwards is underway.
At 1,082 subminuette wave c would reach 1.618 the length of subminuette wave a. This is close to the 0.236 Fibonacci ratio of minuette wave (i) at 1,084 giving a small $2 target zone. If this target is wrong, it may be too low.
When micro waves 1 through to 4 are complete within this impulse, then the target may be calculated also at micro wave degree. The target may change again at that stage.
Micro wave 2 may not move below the start of micro wave 1 at 1,046.48.
ALTERNATE HOURLY WAVE COUNT
Click chart to enlarge.
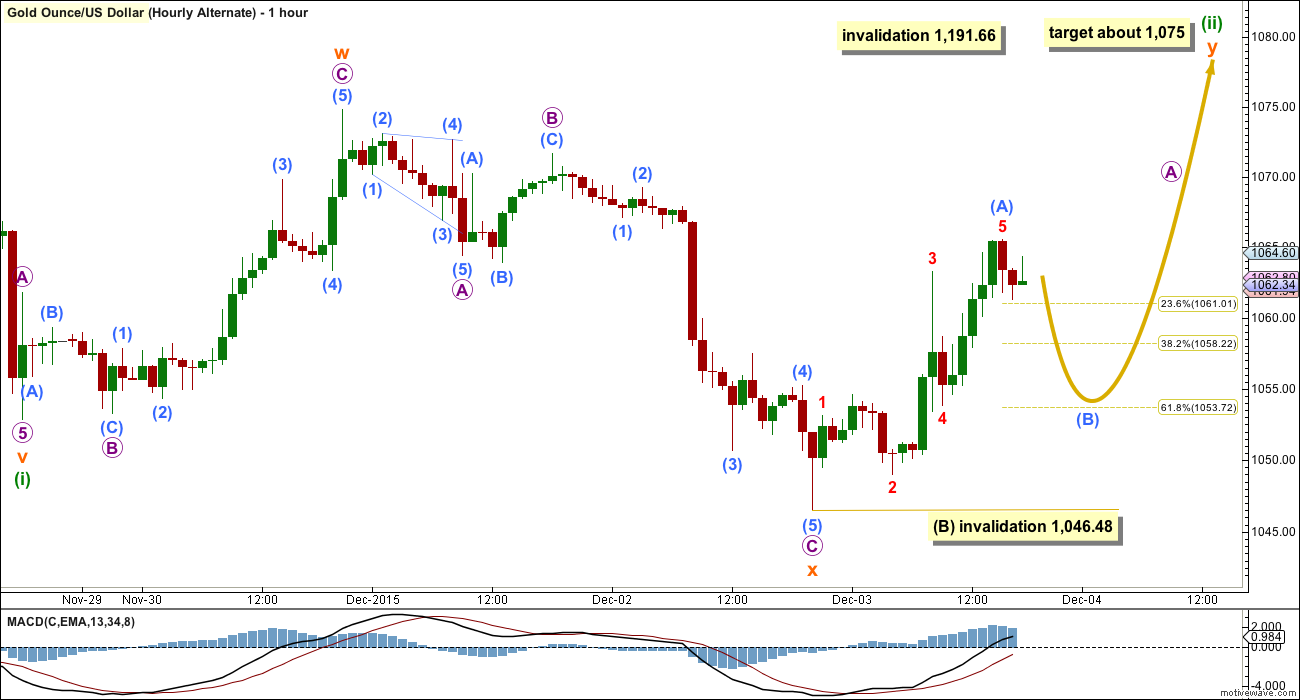
The other structural possibility for minuette wave (ii) at this stage is a combination.
The subdivisions for both hourly wave counts are identical. Here, the zigzag upwards is the first in a double labelled subminuette wave w. The double is joined by a three in the opposite direction, a zigzag labelled subminuette wave x.
The second structure in the double may be a flat or triangle. Because the X wave is so deep a double zigzag for minuette wave (ii) should not be considered; they have much more shallow X waves.
If subminuette wave y is to be a flat or triangle, then micro wave A within it must be a three. With the first wave up now a completed five micro wave A may be unfolding as a zigzag which subdivides 5-3-5. Micro wave B within it may not move below the start of micro wave A at 1,046.48.
When micro wave A is a completed zigzag, then the following correction for micro wave B should be deep and may make a new low below the start of micro wave A at 1,046.48 as in an expanded flat or running triangle.
The purpose of combinations is to take up time and move price sideways. To achieve their purpose they normally have deep X waves and wave Y normally ends close to the same level as wave W. Subminuette wave y should be expected to end about 1,075.
I judge this idea to have a lower probability than the main hourly wave count simply because so far this correction looks like a very typical and very common expanded flat. But all possibilities should be considered.
ALTERNATE ELLIOTT WAVE COUNT
Click chart to enlarge.
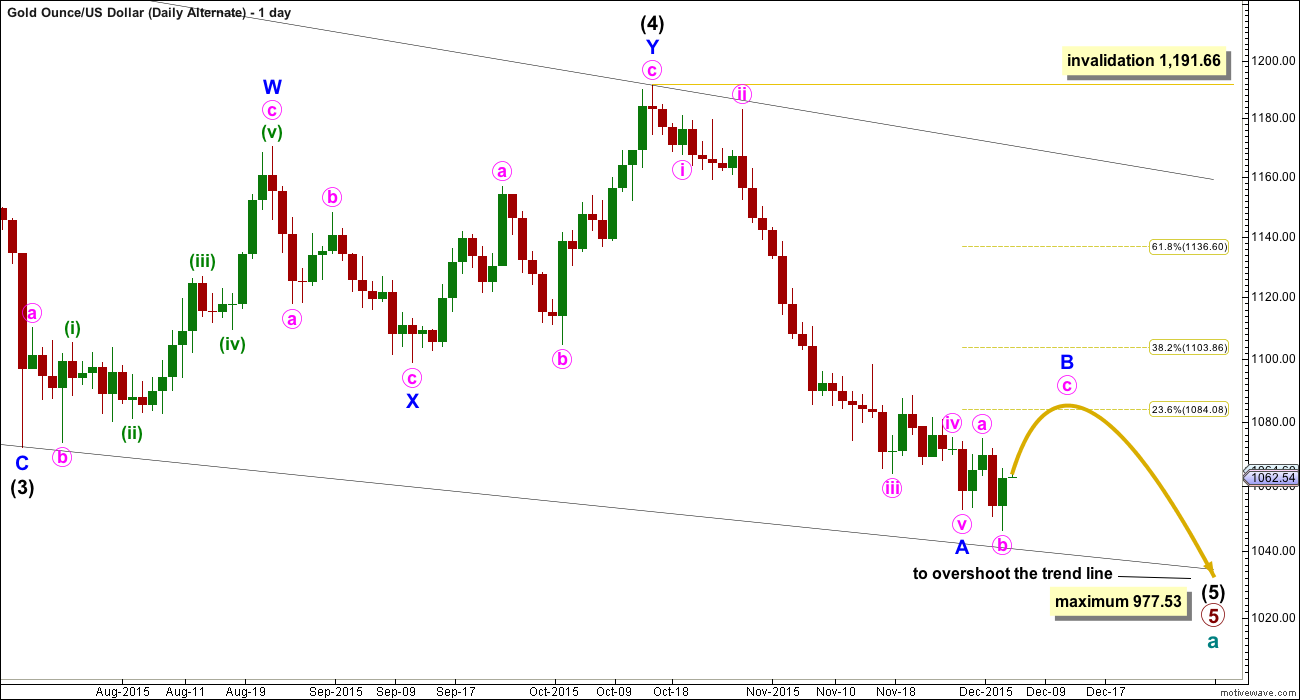
I am aware that this is the wave count which EWI and Danerics have. The implications are important, so I will follow this wave count daily for members here too.
Everything is the same up to the end of the triangle for primary wave 4. Thereafter, primary wave 5 is seen as an ending contracting diagonal.
Within the ending contracting diagonal, it is not possible to see intermediate wave (2) as a zigzag and meet all Elliott wave rules. To see an explanation of why see this video at 10:25.
The same problem exists for the ending diagonal of primary wave 5 itself. Intermediate wave (3) is longer than intermediate wave (1) which would suggest an expanding diagonal, but intermediate wave (4) is shorter than intermediate wave (2) and the trend lines converge which suggests a contracting diagonal.
From “Elliott Wave Principle” by Frost and Prechter, 10th edition, page 88: “In the contracting variety, wave 3 is always shorter than wave 1, wave 4 is always shorter than wave 2, and wave 5 is always shorter than wave 3. In the expanding variety, wave 3 is always longer than wave 1, wave 4 is always longer than wave 2, and wave 5 is always longer than wave 3.”
This structure violates the rules for both a contracting and expanding variety. If the rules in Frost and Prechter are accepted, then this is an invalid wave count.
It may be that the rules need to be rewritten to add “sometimes a third wave may be the longest within a contracting or expanding diagonal”. But I have never seen Robert Prechter publish such a rule, I do not know that it exists.
I cannot reconcile this wave count from EWI with the rules in Frost and Prechter.
If an ending contracting diagonal is unfolding, then the (1) – (3) trend line may be overshot signalling the end of intermediate wave (5). If price behaves thus and turns around and moves strongly higher, then this wave count must be accepted and the rules for diagonals will need to be rewritten.
I will continue to follow this possibility as price moves lower.
Intermediate wave (5) should be shorter than intermediate wave (1). At 977.53 intermediate wave (5) would reach equality in length with intermediate wave (1). A new low below this point would take this possible diagonal structure too far from the rules. At that stage, it really should be finally discarded.
All sub waves within ending diagonals must subdivide as zigzags. Within the zigzag of intermediate wave (5), minor wave B should unfold over several days. At this stage, there is no divergence between this idea and the main Elliott wave count.
Minor wave B may not move beyond the start of minor wave A above 1,191.66.
I am uncomfortable with publishing this wave count and I only do so because it has been published by Elliott Wave International. I am not comfortable with publishing any wave count which violates the rules in Frost and Prechter. However, when looking at primary wave 5 on the weekly chart it does look like a diagonal is unfolding.
Short to mid term there is no divergence in expected direction between this wave count and the main wave count.
TECHNICAL ANALYSIS
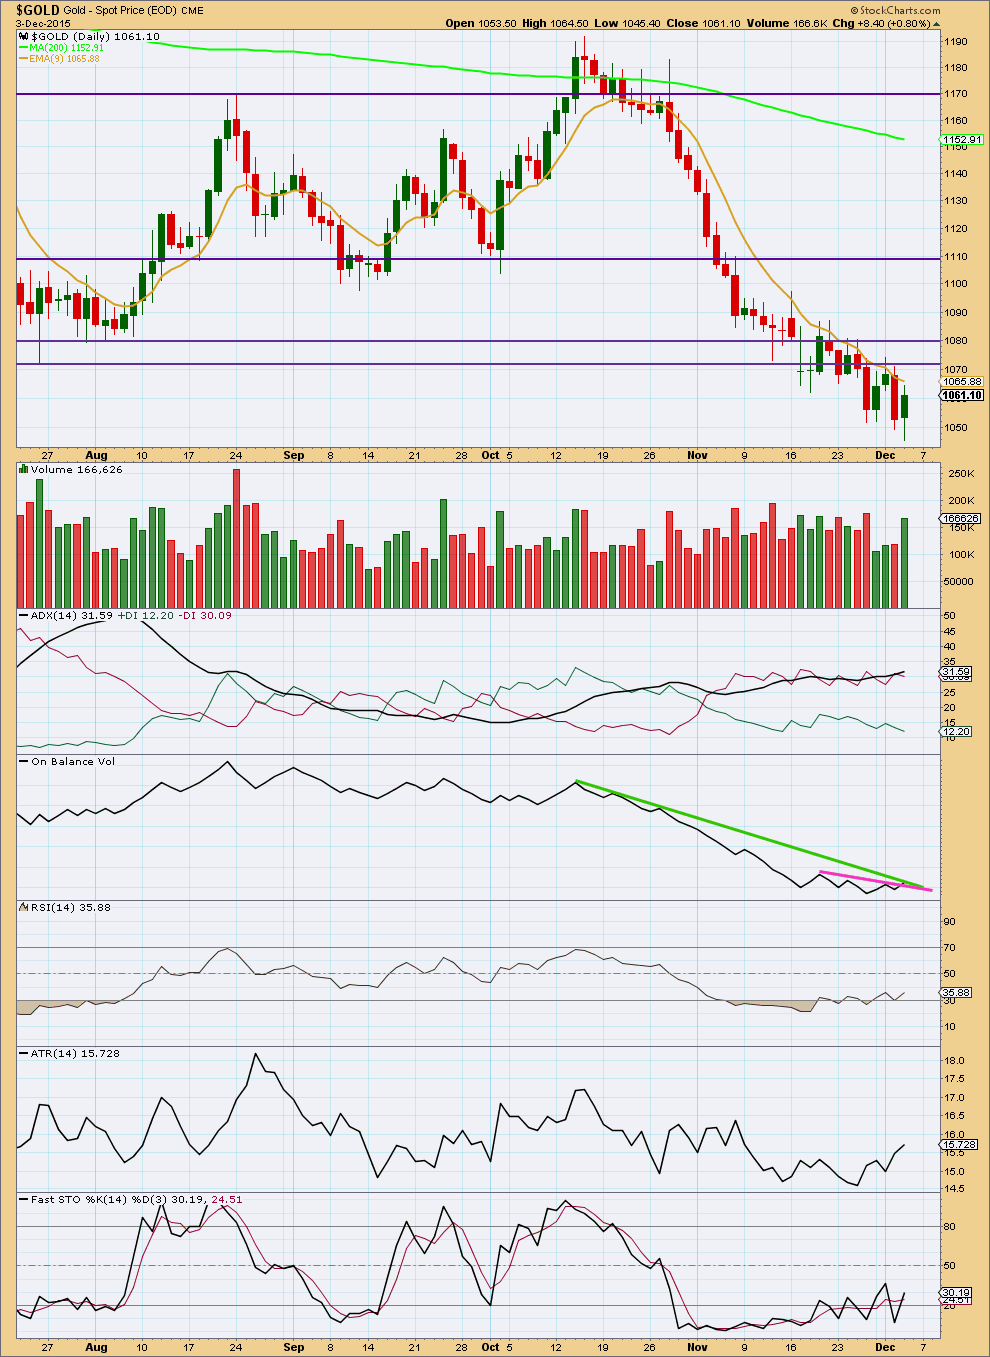
Click chart to enlarge. Chart courtesy of StockCharts.com.
A reasonable increase in volume supports the upwards movement in price for today. This supports the idea that more upwards movement should be expected.
Volume for today is still lower than the last strong downwards day of 27th November.
On Balance Volume is breaking above the short pink trend line and finding resistance at the green trend line. If it breaks above the green line in the next day or so, that would be reasonably bullish.
ADX still indicates a downward trend is in place, but this does tend to be a lagging indicator. However, ATR agrees as it is increasing.
The next line of resistance would be the new horizontal purple trend line at 1,072. Thereafter, another line of resistance is at 1,080.
This analysis is published about 07:24 p.m. EST.
COT gold bullish
Large commercial shorts 225,105 down 6370. Net short position down to only 7050. Net short was 171,000 when gold was at recent top 1160.
Chart to follow in the Friday report.
The target is inadequate. This structure is incomplete.
At 1,104 subminuette c will = 2.618 X a. That’s also the 0.382 Fibonacci ratio. So this is the new target.
New channel – use the lower edge for support for a small fourth wave correction.
Hourly chart posted here. This is what I have so far. One more thrust up for a fifth wave is needed to complete the impulse of submiuette wave c. Maybe Monday or Tuesday?
Lara thanks for letting us know about higher target of 1,104 and for the nice chart.
I sold my DUST at break even that I bought today. I had several times I could of taken a profit but got greedy and wanted more then it dissapeared. Next time I take a quick profit on a Friday when I don’t want to hold a Gold 3X ETF over the weekend.
Just when you think gold is doomed after 6 down weeks then it comes back with a strong day when you think it will drop with strong US payroll news and with a quick recharge Gold decides it’s feeling stronger and wants to party into next week. Let it go up and DUST will be even cheaper.
Buy around 11.30
An intermediate bottom call here. Chart by EagleSeagle.
Lara, what do you make of the monthly RSI divergence ?
Its bullish, it may favour the alternate wave count.
It’s been going on for a while. At the weekly chart level it goes back to June 2013 . I can see triple bullish divergence.
And that’s the problem with divergence. It’s a warning of weakness in price which precedes a trend change, but it can persist for long periods of time before the trend actually changes. Divergence doesn’t tell us exactly when the trend will change.
And so the main wave count sees Gold in a fifth wave down. I would expect to see some divergence at the end of that fifth wave at primary degree.
The “news” this week fit the EW pattern perfectly. Nice call Lara.
It usually does.
If it does not…. then the wave count is wrong.
1:15pm
U.S. stocks: Dow industrials jump more than 300 points after solid jobs report
1:12pm
Dollar rises as jobs report clears path for December rate hike
Both these factors tend to push down Gold so I’m looking for Gold to continue in the strong bearish third wave down.
“It looks like minuette wave (ii) may be more brief and shallow than second wave corrections normally are, at this stage, due to the strong downwards pull from the middle of a third wave…
Upwards movement is still expected to be a correction against the downwards trend.”
At 12:20 pm DUST indicators got more bullish.
MACD now on DUST 1 and 3 and 5 and 15 minutes are all bullish and have Buy signals.
The top 1088.94 at 10:22 am.
I did buy DUST at $15.24 at 11:37 am.
Nice call Richard…..
My inner chicken is in charge at the moment…
will look again at 2:15 to 2:30pm time frame…or Monday…
I’m a bit more active on the hourly chart turns.
Out of NUGT at 30.29 into DUST at 15.33 Thank you LARA. You are the BOMB!
Invalidation for both hour wave counts is 1191. Till gold chart has reversal candle on daily it is going higher.
NUGT – MACD 5 minutes just gave a Sell signal at 10:21 am as when that happens as less risk and often very good signal for selling time. Gold high of 1088.94 at 10:22
Thank you Lara….
Also closed out my NUGT at 10:37 am for 21% gain this week…could go higher but there’s other things need doing today and this is an upcoming time of volatility so no weekend holdovers….
Richard/MTLSD….are you guys looking to go DUST/JDST before EOD?
Looking to buy DUST very soon today.
Ted great trade, congrats.
U.S. gains 211,000 jobs in November, in report likely to trigger rate hike
Dec 4, 2015 10:10 a.m. ET
http://www.marketwatch.com/story/us-gains-211000-jobs-in-november-in-report-likely-to-trigger-rate-hike-2015-12-04?mod=MW_story_top_stories
Already above 1084 target as hit 1086.40 at 10:07 am very sooner than 4 days!!!
Multiple MACD time frames very bullish however target surpassed may go higher but how much how soon peak?
Dropped to 1058 to complete Micro wave 2 and now Gold already hit the first target for micro wave (ii) 1082 as it hit 1081.83 at 9:41 am.
Possible 1084?
Any E.W. here? Have we reached target for first hrly, or is this only a 3rd wave?
Dropped to 1058 to complete Micro wave 2 and now heading for 1082 – 1084 Micro wave (ii)?
Any wave counts?
211,000 and 5%
There is a possibility that this upward movement from 1058 is wave v of 1.
On the hourly chart possible macd divergence
No as it dropped to 1058 one of the lower targets in my opinion.
The low may be in around 1,057ish. I can see a completed double zig zag. Unless the NFP number surprises, gold may go up Friday as Lara’s count calls for.
Gold still looking weak….still waiting.
Maybe a small B wave triangle unfolding currently? So shall break out downwards when it’s done… So far that fits…
But the thing I’ve learned with triangles is look for alternate ideas. Too often I get complacent about a triangle only to see it invalidate at the last minute.
Could be a B wave within a B wave which means it may break out upwards.
Ruppu
Do not get too excited about primary wave 5 ending and beginning of gold’s bull trend. here is the warning/caution from lara from older posts:
August 4 2015:
“I have a Grand Supercycle EW analysis, look under “Gold Historical” category.
When primary wave 5 down is complete then I’m expecting a bear market rally. The rally should last one to several years. But beware, it will be a B wave. They’re the worst. They can be choppy and overlapping and hideous to analyse and trade, or they can be quick sharp zigzags that look like impulses. B waves exhibit the greatest variety in form and behaviour. There are a total of 23 possible patterns for them to unfold as. It could be a sideways drift or a sharp rally up.
Primary 5 still needs intermediate (3) to end which is weeks away yet and the strongest downwards move is ahead of us. Intermediate (4) should last weeks, maybe 8? Intermediate (5) also should last weeks.
I expect primary wave 5 may end at the end of this year, but it may take longer. It may end in the first quarter next year.
Then the B wave should start.”
Papudi u have an excellent knowing of the market..specially EW counts..thanks for update..yaa im not excited…i believe that a calculated risk can give gud rewards in this market.. 🙂
Not only am I not excited, I am dreading the arrival of a b wave at cycle degree.
It’s going to be really hard to analyse. I’ll have to have multiple alternate wave counts, manage lots of different charts and try to explain different ideas to members… daily.
Trading it will be hard.
There will be parts when multiple wave counts agree on direction, and that is when we can have some confidence in what we’re doing.
But for much of it there will be competing ideas, all equally valid.
Nope. Not looking forward to that. And it’ll last at least a year! 🙁
Lara I appreciate your honesty.
Thanks. I am a good student of Lara. Ever since I joined her market letter I have learned from her. Thanks to her excellent work.
Lara: Satellite Coastline Photo on EW Stock market site is gorgeous. Pretty long beach line. where is this place?
It’s a public domain image from NASA of the California coast 🙂
I’ve been there once. Had a fantastic road trip up from San Deigo to San Francisco. Listening to “Monterey Bay” by West Indian Girl as we entered Monterey was the best.
The idea for EWSM this month is we’re looking down from a great height. I’m expecting a big fall in that market.
Yes I am short the market from today after NFP day. market is done going higher. There are so many fundamental clues along with technical clues that market is going to surprise people.
Once you wrote: “For those that still question how well Elliott Wave can really predict market direction relative to all other methodologies, allow me to present you with the following prediction made by Ralph Nelson Elliott in August of 1941:
[1941] should mark the final correction of the 13 year pattern of defeatism. This termination will also mark the beginning of a new Supercylce wave (V), comparable in many respects with the long [advance] from 1857 to 1929. Supercycle (V) is not expected to culminate until about 2012.”
————————————————————
It is 2015. Give or take 3 period. Time has come.
I live in Southern California and have driven parts of the coastal drive many times. Glad you had a good trip here!
Thank u Lara..
Is it also possible that the wave 3 can end well before your target of 932..??..if that can be the case than what can be an alternate target for gold..??..
Yaaa im curious because my experience give me an opinion that the game is getting over very soon…. 🙂
Lara’s “ALTERNATE ELLIOTT WAVE COUNT” has an ending well before 932.
On duration of primary wave 5 to complete Lara wrote on NOV 11: ” So far 5 is 70 weeks in duration. The next Fibonacci number in the sequence for primary 5 is 89, so cycle wave a may end in a further 19 weeks give or take up to three either side of this expectation.”
It is not so quick as we like to think.
It’s started out remarkably slow. It may come to a quicker end, but it’s still got a ways to go yet.
For Gold that ending diagonal at the weekly chart level just looks really good… but it breaches an EW rule. And the same count applied to Silver breaches two EW rules. So although it looks right at this stage… I don’t think it’s very likely.
And so the main wave count should be used until proven wrong. And we’re still not at the strongest downwards part of this big third wave yet.