
A correction was expected to continue. A small inside day fits this expectation.
Summary: The structure of this correction is unclear and it will be impossible to accurately predict the pathway price will take to complete it (because it is impossible to predict what structure it will take and which of more than one valid wave count will be correct). What is clear is that it is unlikely to be over. It may continue for a further five days to end at either 1,088 or 1,104.
New updates to this analysis are in bold.
To see weekly charts and the difference between the two wave counts go here.
MAIN ELLIOTT WAVE COUNT
Click chart to enlarge.
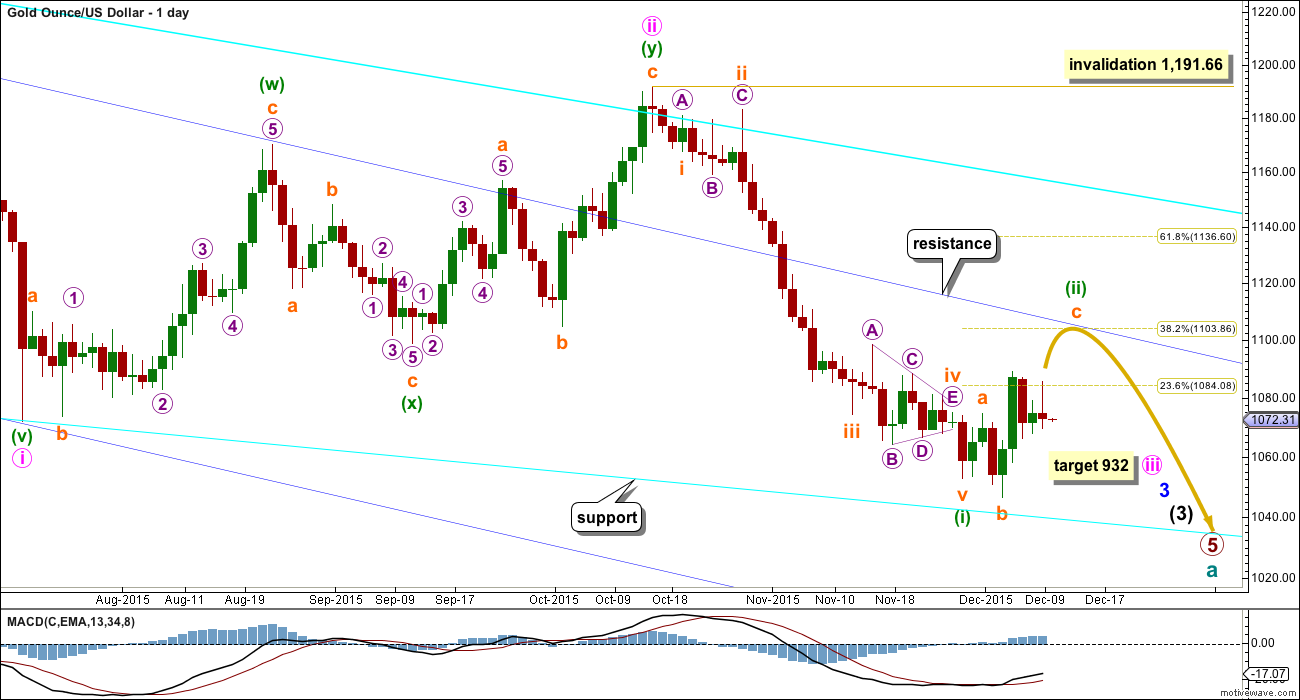
Gold has been in a bear market since September 2011. There has not yet been confirmation of a change from bear to bull, and so at this stage any bull wave count would be trying to pick a low which is not advised. Price remains below the 200 day moving average and below the cyan trend line (copied over from the weekly chart). The bear market should be expected to be intact until we have technical confirmation of a big trend change.
The final line of resistance (cyan line copied over from weekly charts) is only overshot and not so far properly breached. While this line is not breached the bear wave count will remain possible. Simple is best, and the simplest method to confirm a trend change is a trend line.
Minute wave ii is a complete double zigzag and deep at 0.75 the length of minute wave i. It has breached the dark blue base channel drawn about minor waves 1 and 2, one degree higher. When a lower degree second wave correction does this it reduces the probability of the wave count but does not invalidate it. Base channels most often work to show where following corrections find support or resistance, but not always.
At 932 minute wave iii would reach 1.618 the length of minute wave i.
Minuette wave (i) is complete.
Minuette wave (ii) may find resistance at the upper dark blue trend line. This may see it end about the 0.382 Fibonacci ratio of minuette wave (i) at 1,104.
Minuette wave (i) lasted 31 days, three short of a Fibonacci 34. It looks like minuette wave (ii) may be more brief and shallow than second wave corrections normally are, at this stage, due to the strong downwards pull from the middle of a third wave. So far it has lasted eight days. A further five days may see it total a Fibonacci thirteen.
MAIN HOURLY WAVE COUNT
Click chart to enlarge.
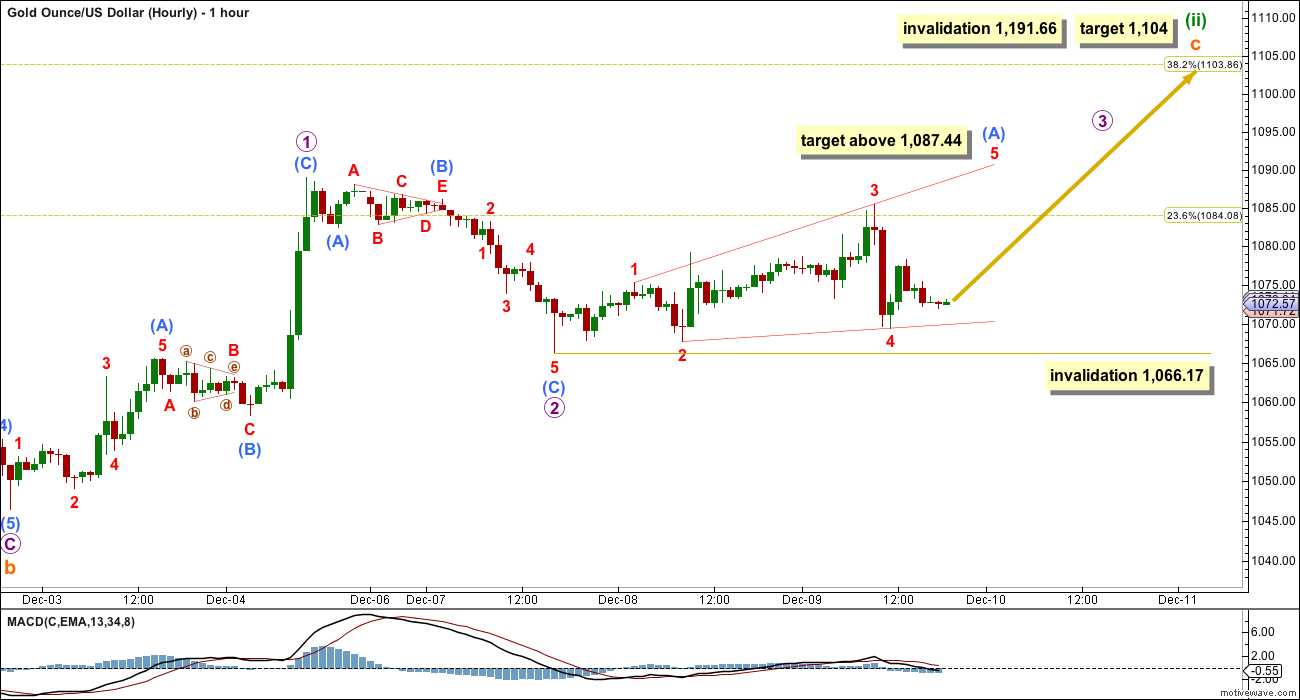
This main wave count looks at minuette wave (ii) as a single incomplete expanded flat correction.
There are two possible structures for subminuette wave c. C waves may be either impulses or ending diagonals.
Previously, I had seen this upwards movement as an unfolding impulse. But the correction labelled micro wave 2 shows up on the daily chart as a red candlestick, where the smaller correction now labelled sub micro wave (B) (within micro wave 1) does not. It is more likely these two corrections are not the same degree, and the larger correction which shows up on the daily chart is a higher degree than the smaller correction that does not.
If subminuette wave c is unfolding as an ending diagonal, then all the sub waves must subdivide as zigzags. Micro wave 1 is complete.
If the sideways movement labelled sub micro wave (B) within micro wave 2 is seen as a triangle, then micro wave 2 must be over. It is a 0.54 correction of micro wave 1, less than the normal range of 0.66 to 0.81 but still relatively deep, so not too far from normal to be problematic.
No second wave correction nor B wave may move beyond its start below 1,066.17 within micro wave 3.
Micro wave 3 must subdivide as a zigzag. When it is done the type of diagonal should be known, expanding or contracting. If micro wave 3 reaches above 1,108.63, the diagonal should be expanding. But it is more likely to be shorter than this for a contracting diagonal. Micro wave 3 must move above the end of micro wave 1 to make a new high above 1,088.94.
Submicro wave (A) may be unfolding as a leading expanding diagonal within micro wave 3. The final fifth wave up is required. Leading diagonals may not have truncated fifth waves, so minuscule wave 5 must end above 1,080.23. Because the diagonal is expanding, minuscule wave 5 should be longer than minuscule wave 3 and should end above 1,087.44.
When micro wave 3 is a complete zigzag, then micro wave 4 must overlap back into micro wave 1 price territory, should be deep, must be a zigzag, and may not move below the end of micro wave 2 at 1,066.17. The invalidation point will remain the same for this wave count for some time.
The classic technical analysis equivalent (to a contracting diagonal) is a rising wedge. They are terminal structures.
Diagonals are choppy and overlapping; they take time to form. This structure may continue for a further five days, if minuette wave (ii) completes in a Fibonacci thirteen.
At 1,104 subminuette wave c would reach 1.618 the length of subminuette wave a and minuette wave (ii) would correct to the 0.382 Fibonacci ratio of minuette wave (i).
FIRST ALTERNATE HOURLY WAVE COUNT
Click chart to enlarge.
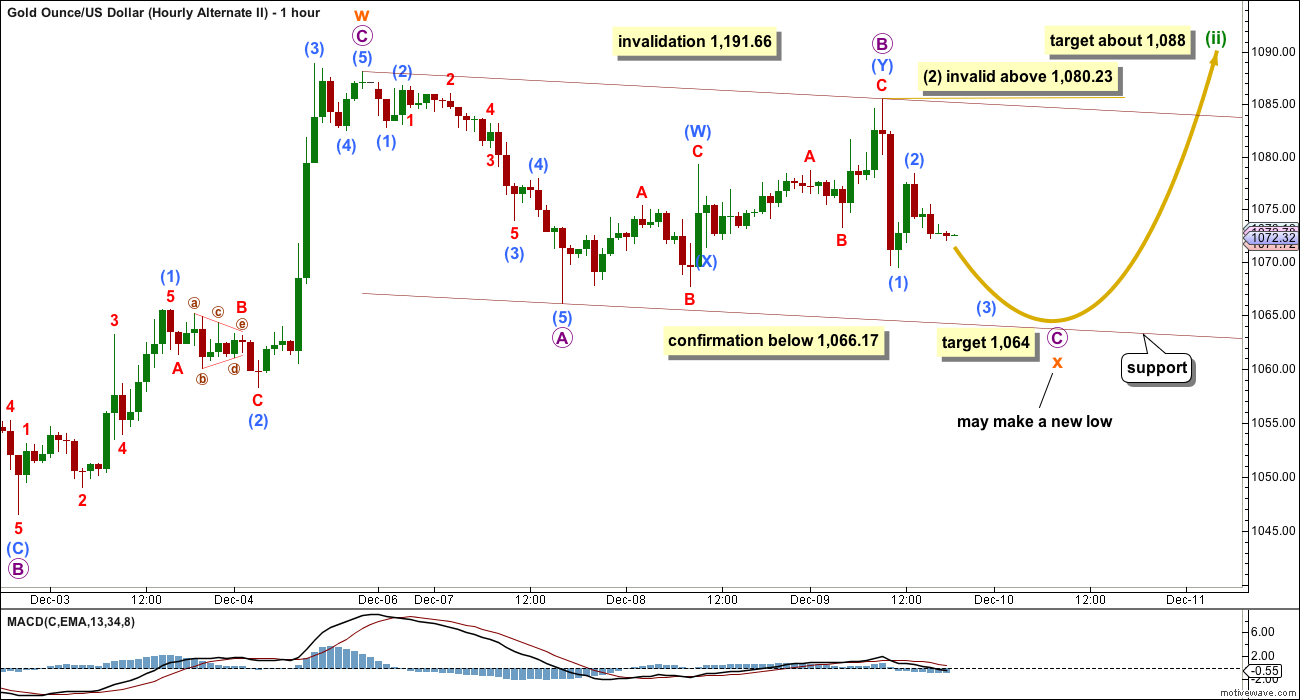
This first alternate wave count looks at minuette wave (ii) as an incomplete double combination or double flat correction.
An expanded flat correction may have been over with a slightly truncated fifth wave within micro wave C, labelled subminuette wave w.
This may have been the first flat correction within a longer lasting double flat or double combination for minuette wave (ii).
The second structure for a double combination may be a zigzag or a triangle. For a double flat, the second structure may be another flat. Double combinations and double flats have the same purpose: to take up time and move price sideways. To achieve this purpose the second structure in the double normally ends about the same level as the first, so subminuette wave y may be expected to end about 1,088.
Within doubles, the two structures are joined by a correction in the opposite direction labelled X. This may be any corrective structure. It may make a new low below the start of the first corrective structure, so there is no lower invalidation point for this wave count for that reason.
Subminuette wave x looks like it may be unfolding as a simple zigzag and that is the most common structure for X waves. Within subminuette wave x, micro wave B may not move beyond the start of micro wave A above 1,088.11.
Micro wave B moved higher within the zigzag of subminuette wave x, so the target for this zigzag down to end must also move correspondingly higher. At 1,064 micro wave C would reach equality in length with micro wave A.
Draw a channel about subminuette wave x. The lower edge may provide support.
When subminuette wave x is complete, then choppy overlapping sideways movement for a second corrective structure would unfold over a few days. If this continues now for a further five days, then minuette wave (ii) may last a total Fibonacci thirteen days.
SECOND ALTERNATE HOURLY WAVE COUNT
Click chart to enlarge.
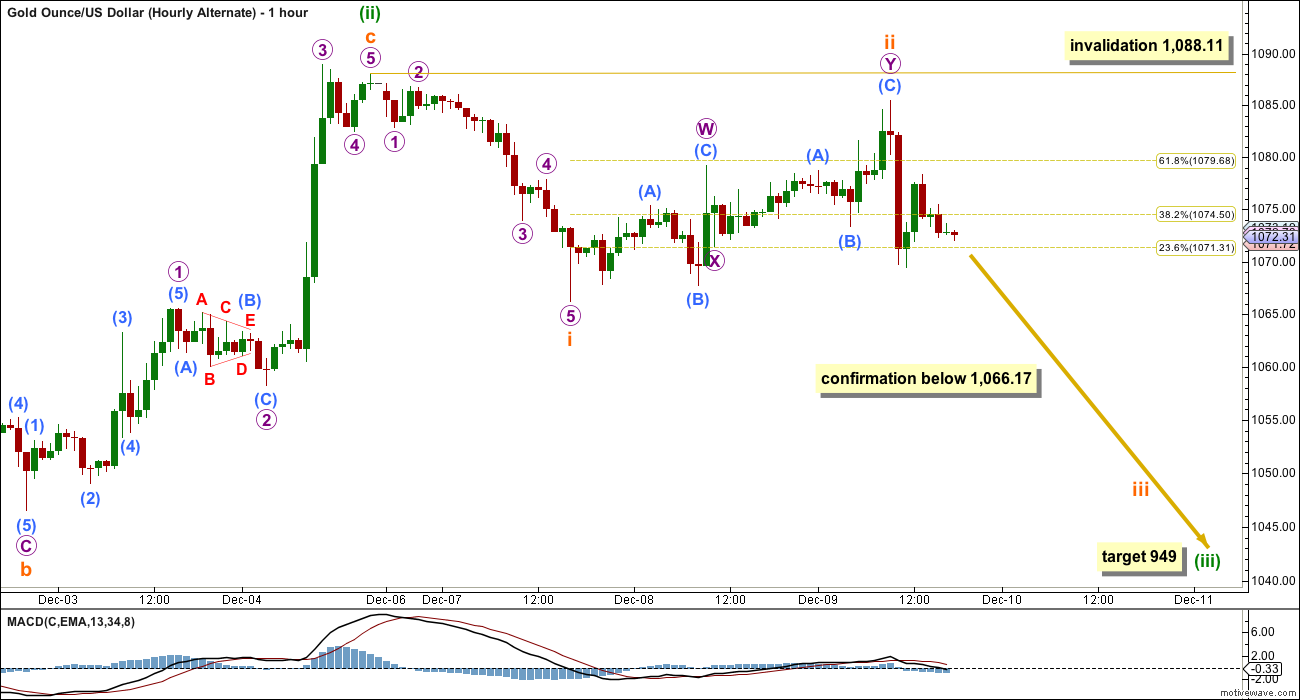
This second alternate wave count is least likely. It looks at minuette wave (ii) as a complete expanded flat.
This would be a very quick and shallow second wave correction, but the possibility must be considered.
If the main wave count is correct (as opposed to the alternate daily wave count below), then there should be a strong downwards pull from the middle of a big third wave at this stage. Surprises to the downside may turn up.
For this wave count a third wave down is expected. The following correction for a fourth wave may not move back into first wave price territory. The structure of downwards movement should indicate which of the two alternate wave counts is correct.
ALTERNATE ELLIOTT WAVE COUNT
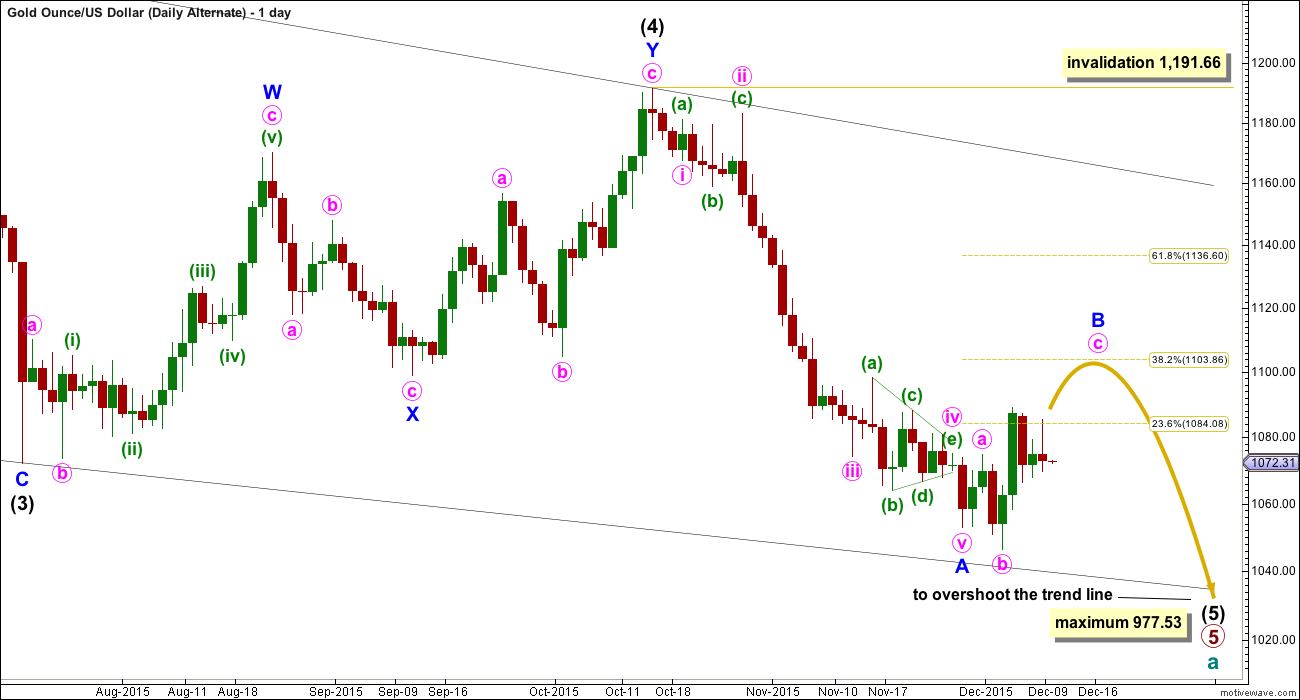
Click chart to enlarge.
I am aware that this is the wave count which EWI and Danerics have. The implications are important, so I will follow this wave count daily for members here too.
Everything is the same up to the end of the triangle for primary wave 4. Thereafter, primary wave 5 is seen as an ending contracting diagonal.
Within the ending contracting diagonal, it is not possible to see intermediate wave (2) as a zigzag and meet all Elliott wave rules. To see an explanation of why see this video at 10:25.
The same problem exists for the ending diagonal of primary wave 5 itself. Intermediate wave (3) is longer than intermediate wave (1) which would suggest an expanding diagonal, but intermediate wave (4) is shorter than intermediate wave (2) and the trend lines converge which suggests a contracting diagonal.
From “Elliott Wave Principle” by Frost and Prechter, 10th edition, page 88: “In the contracting variety, wave 3 is always shorter than wave 1, wave 4 is always shorter than wave 2, and wave 5 is always shorter than wave 3. In the expanding variety, wave 3 is always longer than wave 1, wave 4 is always longer than wave 2, and wave 5 is always longer than wave 3.”
This structure violates the rules for both a contracting and expanding variety. If the rules in Frost and Prechter are accepted, then this is an invalid wave count.
It may be that the rules need to be rewritten to add “sometimes a third wave may be the longest within a contracting or expanding diagonal”. But I have never seen Robert Prechter publish such a rule, I do not know that it exists.
I cannot reconcile this wave count from EWI with the rules in Frost and Prechter.
If an ending contracting diagonal is unfolding, then the (1) – (3) trend line may be overshot signalling the end of intermediate wave (5). If price behaves thus and turns around and moves strongly higher, then this wave count must be accepted and the rules for diagonals will need to be rewritten.
I will continue to follow this possibility as price moves lower.
Intermediate wave (5) should be shorter than intermediate wave (1). At 977.53 intermediate wave (5) would reach equality in length with intermediate wave (1). A new low below this point would take this possible diagonal structure too far from the rules. At that stage, it really should be finally discarded.
All sub waves within ending diagonals must subdivide as zigzags. Within the zigzag of intermediate wave (5), minor wave B should unfold over several days. At this stage, there is no divergence between this idea and the main Elliott wave count.
Minor wave B may not move beyond the start of minor wave A above 1,191.66.
I am uncomfortable with publishing this wave count and I only do so because it has been published by Elliott Wave International. I am not comfortable with publishing any wave count which violates the rules in Frost and Prechter. However, when looking at primary wave 5 on the weekly chart it does look like a diagonal is unfolding.
Short to mid term there is no divergence in expected direction between this wave count and the main wave count.
TECHNICAL ANALYSIS
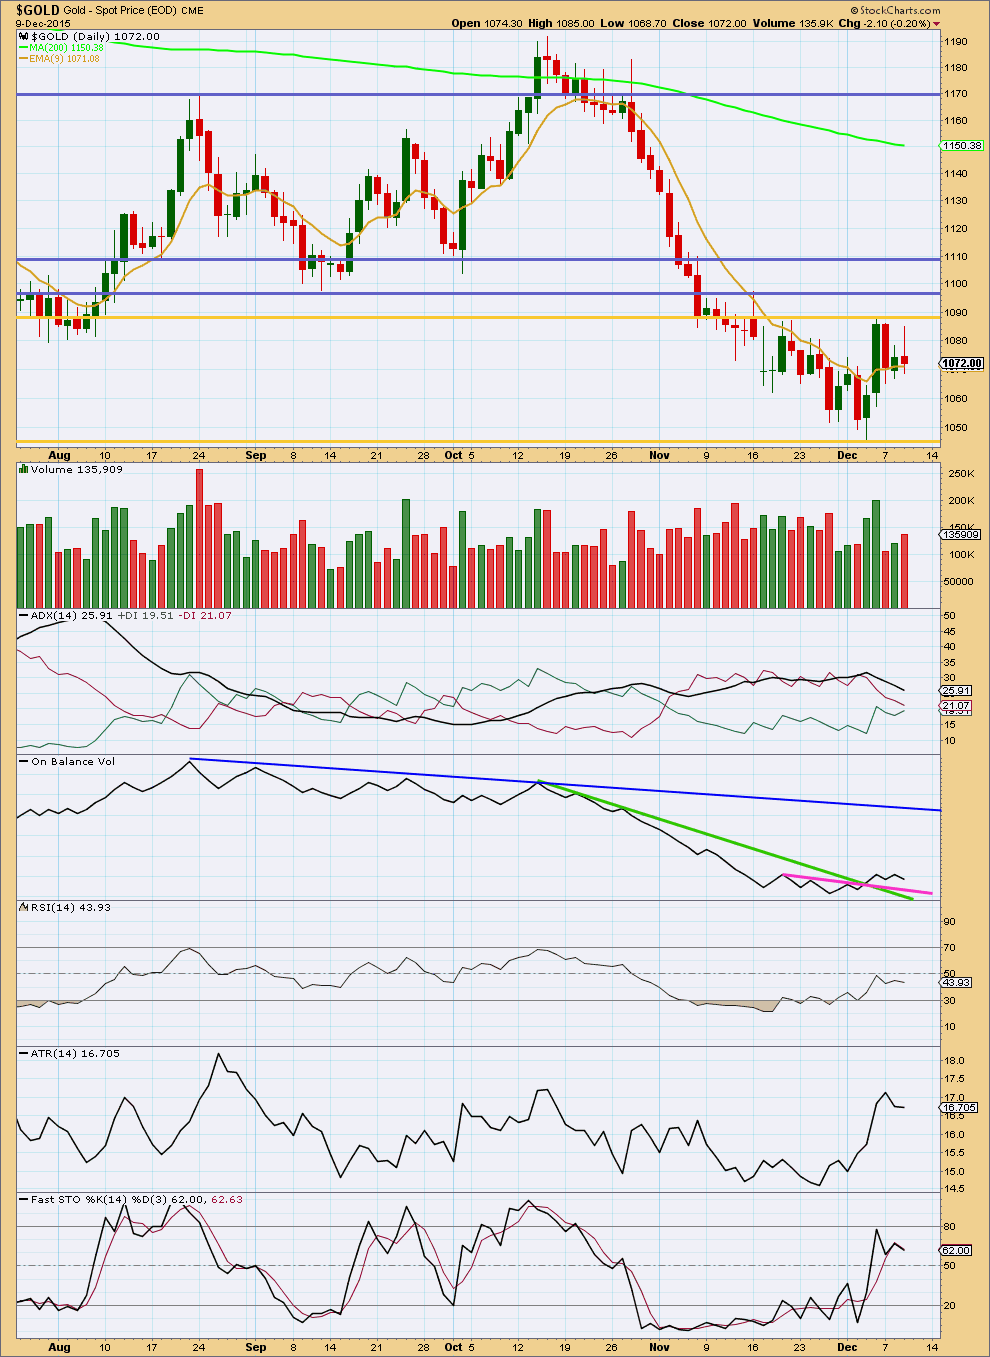
Click chart to enlarge. Chart courtesy of StockCharts.com.
Volume is still light but increasing for the last three days. Although today completed a red candlestick, it had a higher high and higher low than the prior day. The rise in price was supported by volume.
Overall, light volume supports the idea of a correction currently unfolding. The last strong day was an upwards day of 4th December. This indicates more upwards movement should unfold from here.
ADX is clearly declining, indicating a correction. More sideways movement should be expected to unfold as price consolidates. A breakout should be looked for either above or below the gold horizontal lines now delineating support and resistance of this consolidation. ATR is beginning to agree as it too is starting to turn downwards.
To the upside, if price breaks above the upper horizontal gold line, then the next line of resistance would be the purple lines. A move above the gold line should come on higher volume for a breakout to be confirmed. A move below the lower horizontal gold line on higher volume would confirm a downwards breakout.
Price should be expected to swing between support and resistance while price remains within the gold horizontal lines. At this stage, more upwards movement should be expected to continue and to only end when price finds resistance and Stochastics reaches overbought at the same time.
This analysis is published about 07:48 p.m. EST.
Lara – …”If this fifth wave has started out so slowly then it may speed up towards its end.”…
Lara may become a registered financial advisor and be able to give investment advice legally approximately around April.
COT analysis by Bob Hoye going back to 1977, Compelling conclusion for gold target to 1110.
http://www.321gold.com/editorials/hoye/hoye121015.pdf
Looks like gold may have bottomed near term as gold did a quick drop to hit 1069.49 at 9:35 am Thursday just 1 cent above yesterday’s low at 11:05 of 1069.48. NUGT and GDX hit day low then and then went up.
Gold price coasting below 1072-73 opens up downside risk 1065-57….
Lara
A new low in oil..it means that correction isnt started yet..??
I mean yesterdays move was not a part of correction..??
Correct.
I need to provide an update for Oil. Will do that later and post a chart in comments there.
Okiess
Last time COT chart was like this was 15 years ago.
Does that suggest gold will go up from here?
Yes. Plus read post by Bob Hoye above . ALL indications are pointing above for gold.
Not necessarily. It indicates we may go up… in the near future…. but not that we should go up from here.
The two (commercial hedgers and large traders) met close to zero in 1996 with large traders above hedgers, exactly the same position we have now. Price fell to 2001.
I’m really careful of indicators like that. On their own they’re not a signal. I prefer to add the information to all other pieces of info and weigh up on balance.
There is rather a lot of bullishness for Gold at weekly chart levels for this drop. RSI is showing persistent divergence.
This tells us the downwards trend will end… is closer to an end…. but it absolutely will not tell us the end is in already.
Only price can do that.
Lara : Impulse waves 1 and 3 lasted 3 and 37 weeks. Corrective waves 2 and 4 lasted 53 and 57 weeks.
Currently wave 5 is in 72 week. AND is expected to last in 89 weeks.
Is duration looks reasonable that wave 5 is the longest wave in duration????
There was no alternation between wave 2 and wave 4 in duration??? BUT amount was different.
Alternation should be a structure and depth. Not duration.
When the duration of second and fourth waves is the same then the impulse has closer to a textbook look to it.
If this fifth wave has started out so slowly then it may speed up towards its end. The duration will be much longer than that of the first and third waves, and that is okay.
Its really important an idea that the duration of the second and fourth waves should be the same or similar. Think of what an impulse looks like when one of those two corrections within it is much longer than the other; it starts to make the five look like a three.
Mahendra prophecy who is consistantly succesful in his gold predictions giving target of 888$ in gold..Agree with EW counts..
But says that Oil bottomed at 36.5..way before EW targets…
http://www.mahendraprophecy.com
EW analyst article on Gold
The Pet Rock Rallies, But For How Long?
Published at: Dec 06, 2015 20:17 EST by Ben Lockhart
https://www.lonewolftrader.com/library/articles/the-pet-rock-rallies-but-for-how-long
FEDs day getting closer this commodity is becoming unpredictable…i think its better to jst follow the trend and be on sell side and forget these small corrections…Fed announcement hopefully will be supporting the EW count…
Avi Gilburt EW – It Is Getting Harder To Continually Look Lower
Wednesday, 9 December 2015
http://news.goldseek.com/GoldSeek/1449673380.php
I wouldn’t be at all surprised by the second hourly alternate.
It doesn’t help that both alternates have the same confirmation below 1,066.17 and the first has a target at 1,064 and they both may make a new low below 1,046.48.
Lara now that you have passed the CMT exams are you permitted to make any investing recommendations or is that when you get your diploma?
If yes, then I was wondering once gold gets more predictable if you would be able to put into any of your charts a BUY zone box such as when gold does a retrace after a first 5 wave down, or the possible low zone at the end of a major bottom, or anything else to aid in trading with gold since we are not all EW experts like you or some of your EWG clients? Thanks for any feedback.
I checked with the MTA yesterday and it will take about two months for the process to approve me for CMT. I have my three sponsors who have all completed their questionnaires, and I’ve completed my application. Now I wait.
Once that is done then I’ll apply to be a registered financial advisor in New Zealand.
I have no idea how long that process takes, but no exams, just an application to be made and a background check on me to be done.
When that is approved then I will be legally able to give investment advice.
While I’m not a registered advisor I cannot legally make any buy or sell recommendations. If I do I could be in very big trouble. So I am very careful how I word my analysis, it must legally be educational and my opinion on the market only.
So probably not until about April next year 🙁
Lara may be able to give investing advice legally around April.