
The structure is becoming a little clearer. There is only one daily Elliott wave count this week.
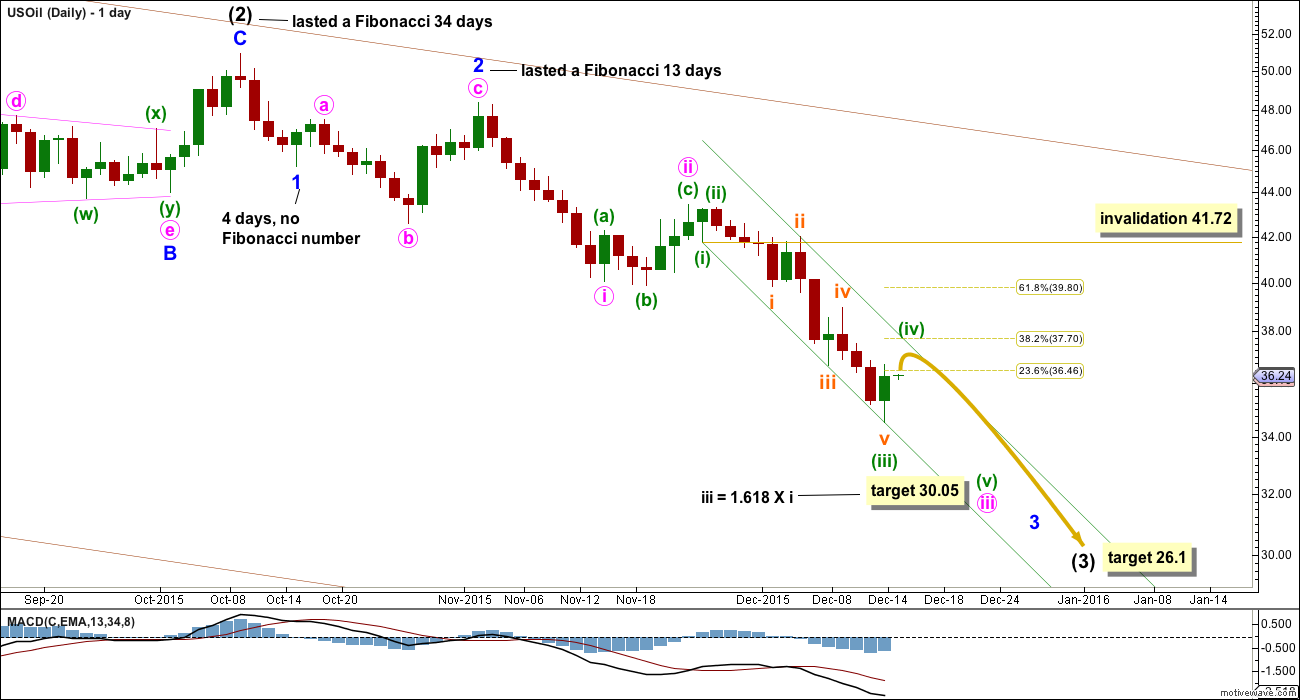
Summary: The trend is down and corrections present an opportunity to join the trend. Currently, a little more upwards movement is indicated for another one or two days to about 37.7. The next target for a correction to interrupt this trend is at 30.05.
New updates to this analysis are in bold.
To see monthly charts go here.
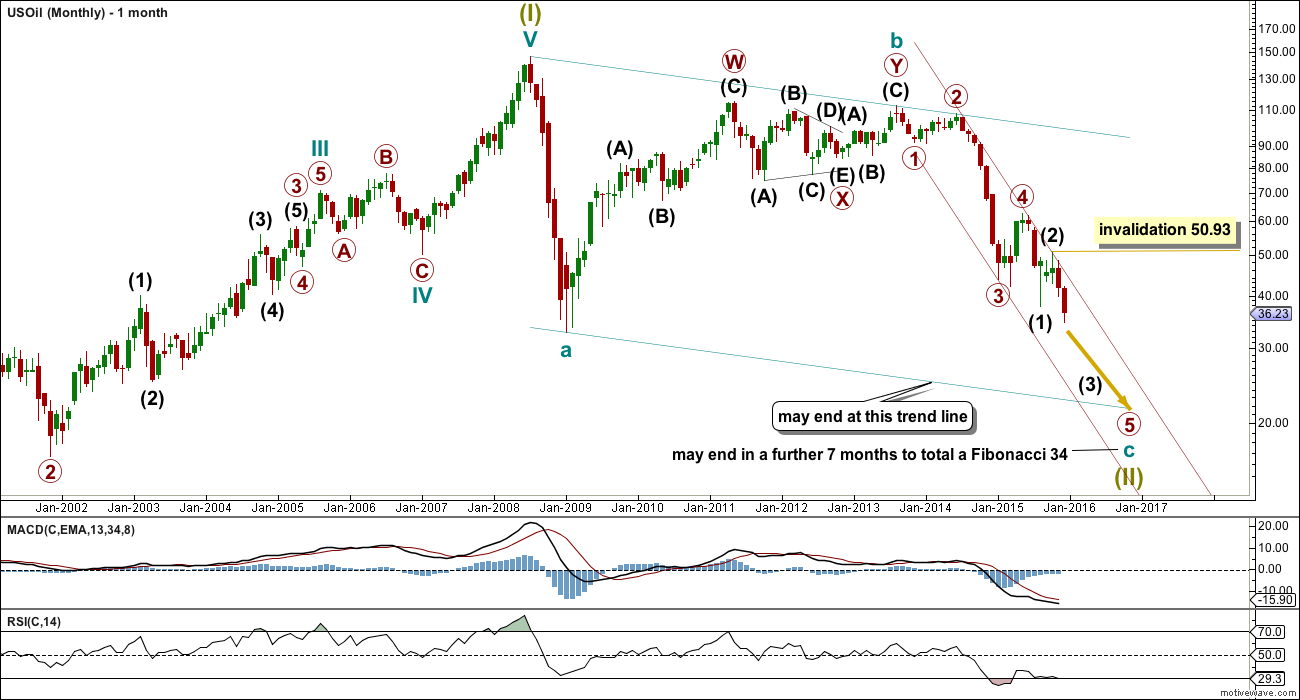
MONTHLY ELLIOTT WAVE COUNT
Click chart to enlarge.
US Oil has been in a bear market since August 2013. While price remains below the upper edge of the maroon channel drawn here and below the 200 day simple moving average it must be accepted that the bear market most likely remains intact. I will not publish a bull wave count while this is the case and while there is no technical confirmation of a trend change from bear to bull.
The structure of cycle wave c is incomplete.
This wave count sees US Oil as within a big super cycle wave (II) zigzag. Cycle wave c is highly likely to move at least slightly below the end of cycle wave a at 32.70 to avoid a truncation. Cycle wave c may end when price touches the lower edge of the big teal channel about this zigzag.
Within cycle wave c, primary wave 5 is expected to be extended which is common for commodities.
No second wave correction may move beyond the start of its first wave above 50.93 within intermediate wave (3).
Draw a channel about this unfolding impulse downwards. Draw the first trend line from the highs labelled primary waves 2 and 4 then place a parallel copy on the end of primary wave 3. Next push up the upper trend line slightly to contain all of primary waves 3 and 4. Copy this channel over to the daily chart. The upper edge should provide resistance.
DAILY ELLIOTT WAVE COUNT
Click chart to enlarge.
At 26.1 intermediate wave (3) would reach equality in length with intermediate wave (1).
Minor waves 1 and 2 are complete within intermediate wave (3).
Minor wave 3 is an incomplete impulse.
Minute waves i and ii are complete within minor wave 3. Minute wave iii would reach 1.618 the length of minute wave i at 30.05.
Draw a channel about this downwards movement. Draw the first trend line from the lows labelled minuette waves (i) to (iii), then place a parallel copy on the high labelled subminuette wave ii, so that all downwards movement is contained. Minuette wave (iv) may correct to about the 0.382 Fibonacci ratio at 37.70 and may find resistance at the upper edge of the channel.
TECHNICAL ANALYSIS
DAILY CHART
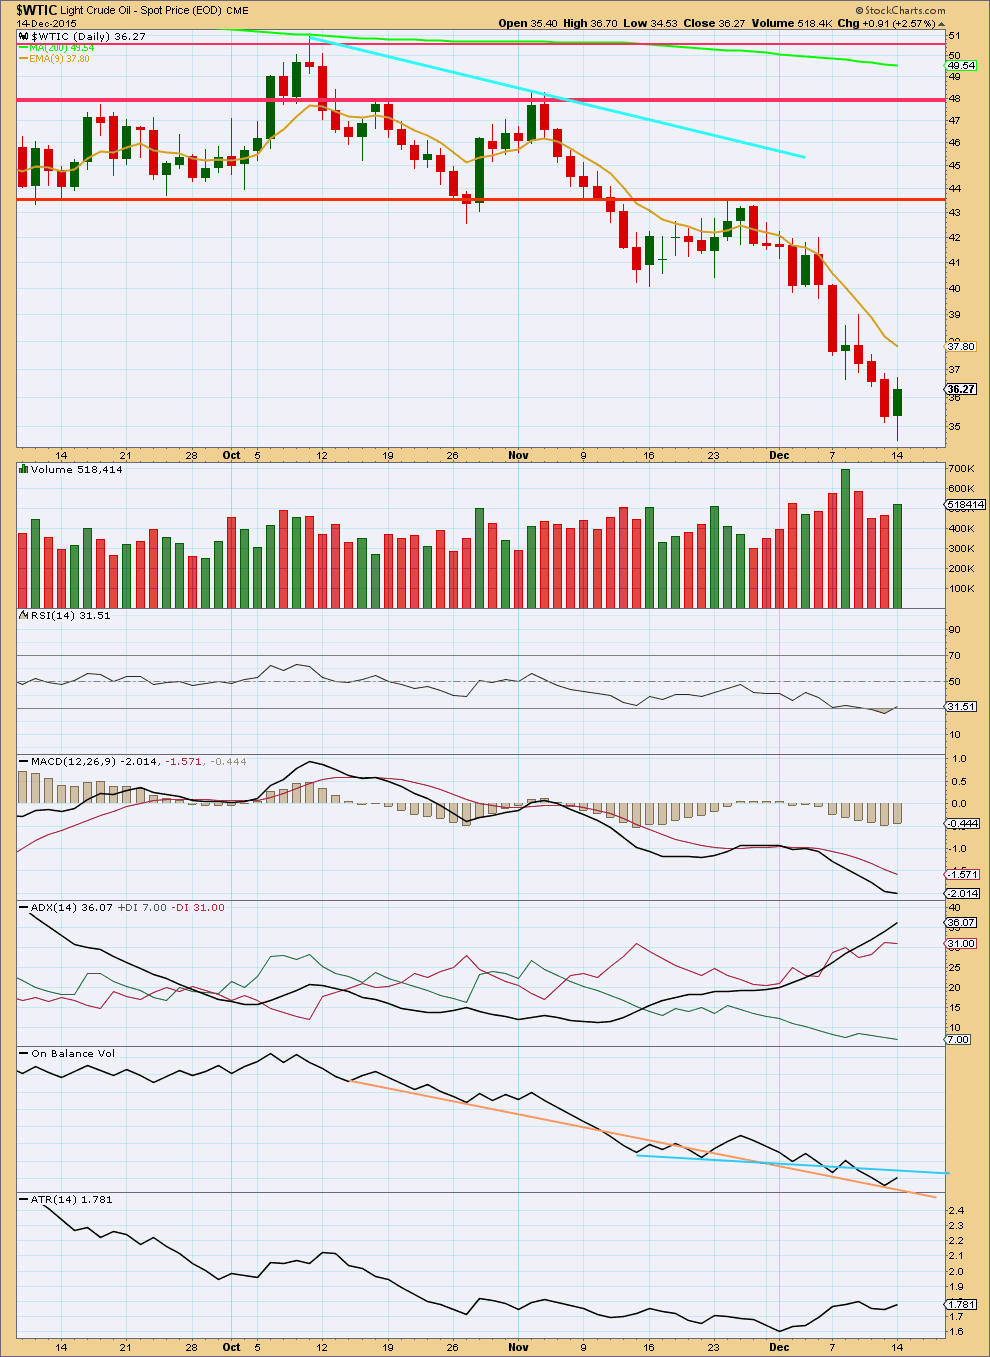
Click chart to enlarge. Chart courtesy of StockCharts.com.
ADX still indicates a trend is in place, but as it is above 30 a correction from an extreme should be expected.
Monday’s upwards day comes with some increase in volume. The rise in price was supported by volume, so this is unlikely to be a short lived correction within the downwards trend.
RSI is oversold and shows some bullish divergence today with the low of yesterday. While price made a new low RSI did not. This indicates weakness in downwards movement from price.
Taken together these three indicators strongly suggest that Monday’s upwards day is not the end of this current upwards correction; some more upwards movement may be needed. This is why the Elliott wave count expects more upwards movement for a small fourth wave correction today.
In trying to find a trend line which may be used on On Balance Volume to assist to show when upwards movement is complete, I have moved the blue line. If OBV comes up to touch this line, it may be when upwards movement from price ends.
ATR agrees that a trend is in place as it too is rising overall.
This analysis is published about 10:19 p.m. EST.
US Oil strong today. Bullish divergence with RSI and MACD.
Oil to run higher to 40-43 area????? may be.
What the Paris climate deal means for oil markets
Dec 14, 2015 6:06 a.m. ET
http://www.marketwatch.com/story/what-the-paris-climate-deal-means-for-oil-markets-2015-12-14?link=TDheadline_2
That’s interesting.
I recall a comment (not a member) several months ago when Oil was still close to $90 and my analysis had a big long arrow pointing down stating that I was stupid. Oil couldn’t possibly fall below the price of production.
And now here we have an explanation. Oil is on the way out because… climate change? And government legislation around climate change? I’m not buying it.
The Paris talks were just talk. Governments and big business won’t actually do anything different. Here in NZ our government signed deals to allow oil exploration in the Marlborough Sounds within a week of the Paris talks concluding.
When the price was close to $90 there was no talk about price falling because oil was on the way out. None that I saw anyway.
I expect price is falling because less are buying. Maybe it’s more a function of a decline in economic activity globally.
Lara your analysis is up to mark..thank you..
One concern..FED hike will consider that there is gradual development in Economy…positive for crude..
Elliott wave analysis is mutually exclusive to fundamental analysis.
Elliott wave theory states that it is social mood which moves markets, not Fed statements nor even interest rates.
Interest rates have been flat for a long time now yet the indices have moved higher. The relationships which have been noticed in the past, and have been assumed to still remain, have not continued. Those relationships just do not always persist.
So even though the Fed has finally raised rates that does not necessarily mean that Oil prices must follow.
And the Fed can consider that the economy may improve, and it may yet not do so. What they think will happen is not necessarily what will happen.
Hi Lara,
thank you very much for all your excellent and hard work in 2015. I wish you a merry Christmas and a happy, healthy and successful 2016 ,… enjoy your well earned holiday.
Can you please give a quick update on the unfolding correction on Oil?
Is it moving much higher today or are we nearly done?
This would be highly appreciated
Regards
Ursula
I see that price is finding resistance exactly at the upper edge of the trend channel.
I expect that minuette (iv) is complete and the next impulse down should now be underway.
Minuette (iv) may have been a shallow 0.382 correction, exhibiting alternation with minuette (ii) which was deep.
I wish you also a wonderful Christmas and New Years. I hope we all get a good rest, ready for the new year.
Lara
You suggested the correction ending around 37.7$…
Oil has fallen from 43.2 to 34.5..
Dont u think 50% retracement towards 39$ is achievable and a right level to go short.??
No I don’t.
The second wave was a deep correction and so the fourth wave may be shallow to exhibit alternation.
The channel is so far providing resistance at the 0.382 ratio.
Thanks Lara for a good report. Comments on the chart for wave duration and expected fib retracement provides additional clarity to EW counts.
Papudi the chart which u posted on oil last time is making sense…and its also matching with laras EW counts..i think correction will last till 40$
$45, for me is a 5 wave sequence from $51 to $34.50, with a 5th wave extension. And we are currently in a wave 2, correcting that first wave. A 61.8% retracement from $51 to $34.50 will take it to $44.70 or so. RSI in deep oversold level.