
An update to last analysis expected downwards movement to a target at 38.33. Price moved lower to reach 37.50 so far.
Summary: A diagonal structure may have just completed today, this indicates a sharp correction should unfold upwards before the downwards trend resumes. However, this week the regular technical analysis does not support the Elliott wave count. For this reason an upwards correction should not be assumed to have begun until a green daily candlestick is seen. The trend is down. Corrections are an opportunity to join the trend.
New updates to this analysis are in bold.
To see monthly charts go here.
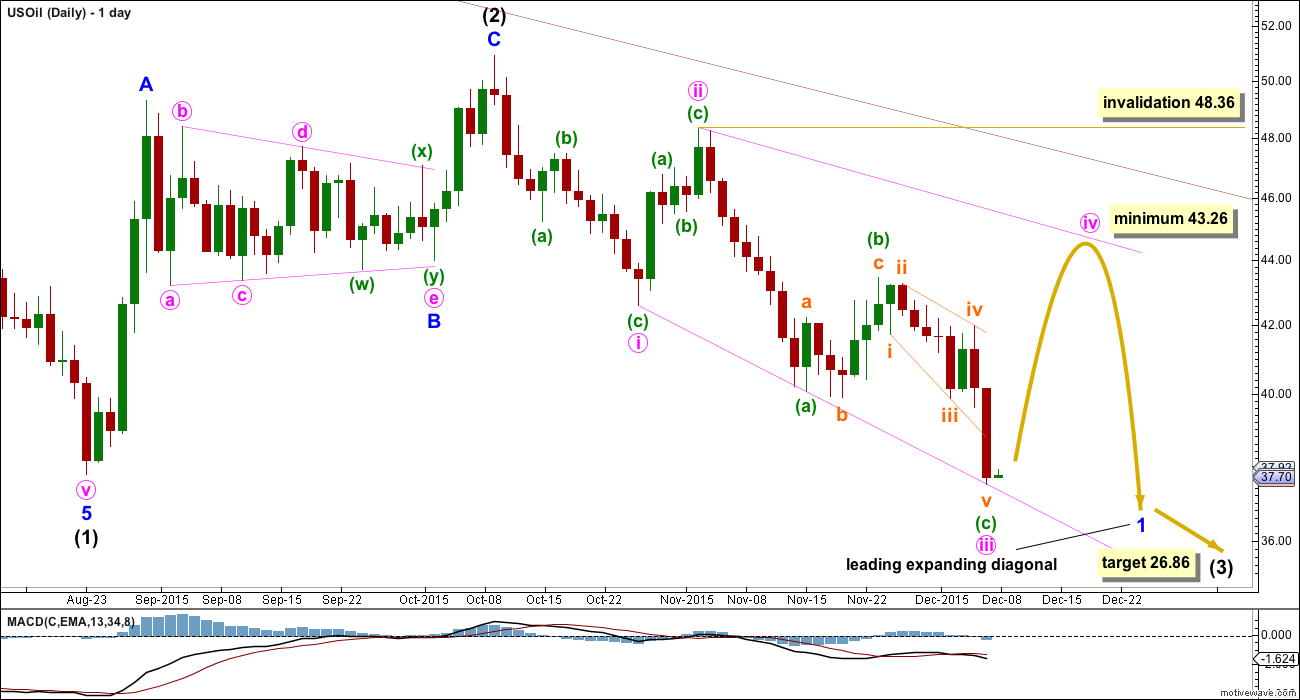
MAIN DAILY ELLIOTT WAVE COUNT
Click chart to enlarge.
US Oil has been in a bear market since August 2013. While price remains below the upper edge of the maroon channel drawn here and below the 200 day simple moving average it must be accepted that the bear market most likely remains intact. I will not publish a bull wave count while this is the case and while there is no technical confirmation of a trend change from bear to bull.
Intermediate wave (3) must subdivide as an impulse.
Within intermediate wave (3), minor wave 1 may be beginning as a leading diagonal. Minute wave iii is longer than minute wave i, so the diagonal would be expanding.
The first, third and fifth waves are most commonly zigzags within a leading diagonal, but sometimes they may also be impulses. This is why minute waves i and iii are labelled as zigzags.
Minute wave i lasted 12 days, one short of a Fibonacci 13. Minute wave ii lasted a Fibonacci 5 days. If minute wave iii is over at the low today, it would have lasted 24 days.
Minute wave iv should be longer than minute wave ii because the diagonal is expanding. The minimum for minute wave iv is 43.26. The diagonal trend lines must diverge.
Minute wave iv must overlap back into minute wave i price territory above 42.60. It may not move beyond the end of minute wave ii above 48.36.
Minute wave iv must subdivide as a zigzag.
At this stage, it looks likely that minute wave iii is complete and minute wave iv should begin. The lower diagonal trend line is tested three times now, so this line should offer strong support. However, there is no confirmation of a trend change and the end of minute wave iii yet. This wave count comes with the strong caveat that confirmation is required in the form of a green daily candlestick before confidence may be had that minute wave iv has begun.
At 26.86 intermediate wave (3) would reach equality in length with intermediate wave (1).
Intermediate wave (1) lasted 53 days, two short of a Fibonacci 55. Intermediate wave (2) lasted a Fibonacci 34 days. Intermediate wave (3) may now complete in a total Fibonacci 89 days (give or take up to two either side of this number).
ALTERNATE DAILY ELLIOTT WAVE COUNT
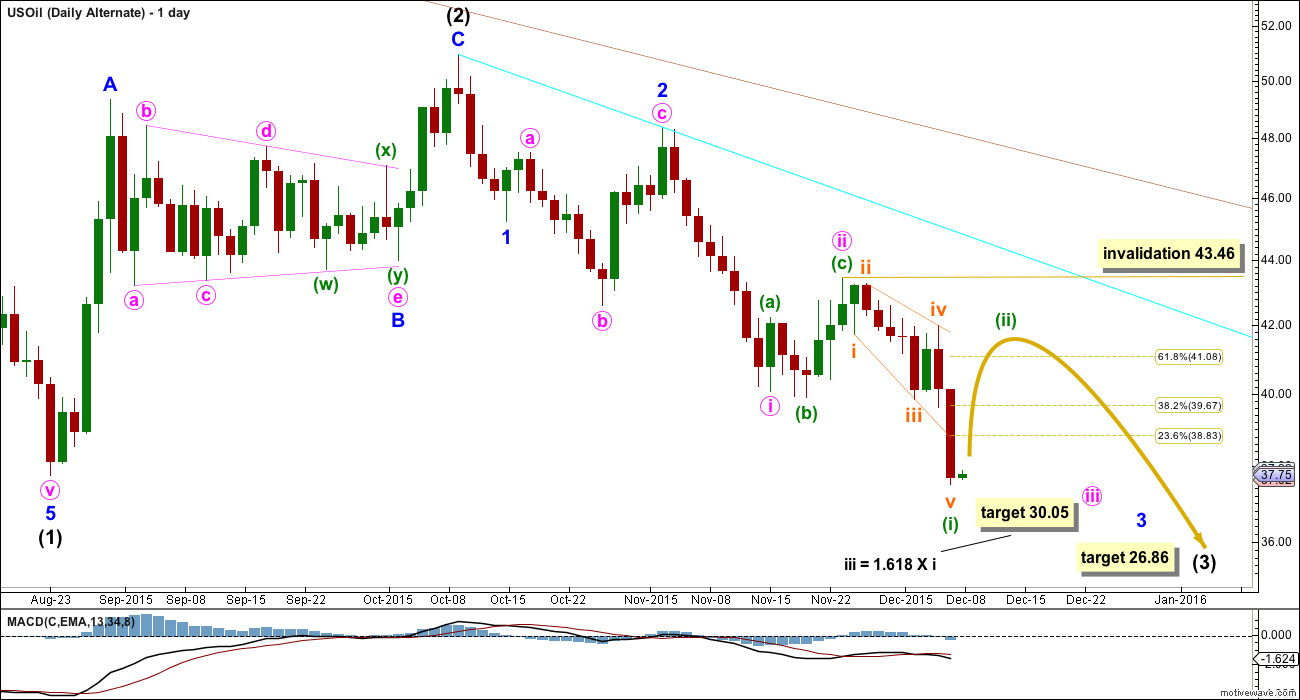
Click chart to enlarge.
The other structural possibility for the start of intermediate wave (3) down is an impulse. The subdivisions do not have as good a fit, particularly minute wave c within minor wave 2 (it looks like a three and this wave count must see it as a five). But apart from that, this wave count is entirely possible.
If downwards movement has begun with a series of overlapping first and second waves, then this wave count expects downwards movement to resume more quickly and to show a strong increase in momentum.
Minuette wave (i) subdivides as a leading expanding diagonal. Leading diagonals in first wave positions are normally followed by very deep second wave corrections. Minuette wave (ii) may be expected to reach at least to the 0.618 Fibonacci ratio of minuette wave (i) at 41.08, and very likely higher. It may not move beyond the start of minuette wave (i) above 43.36.
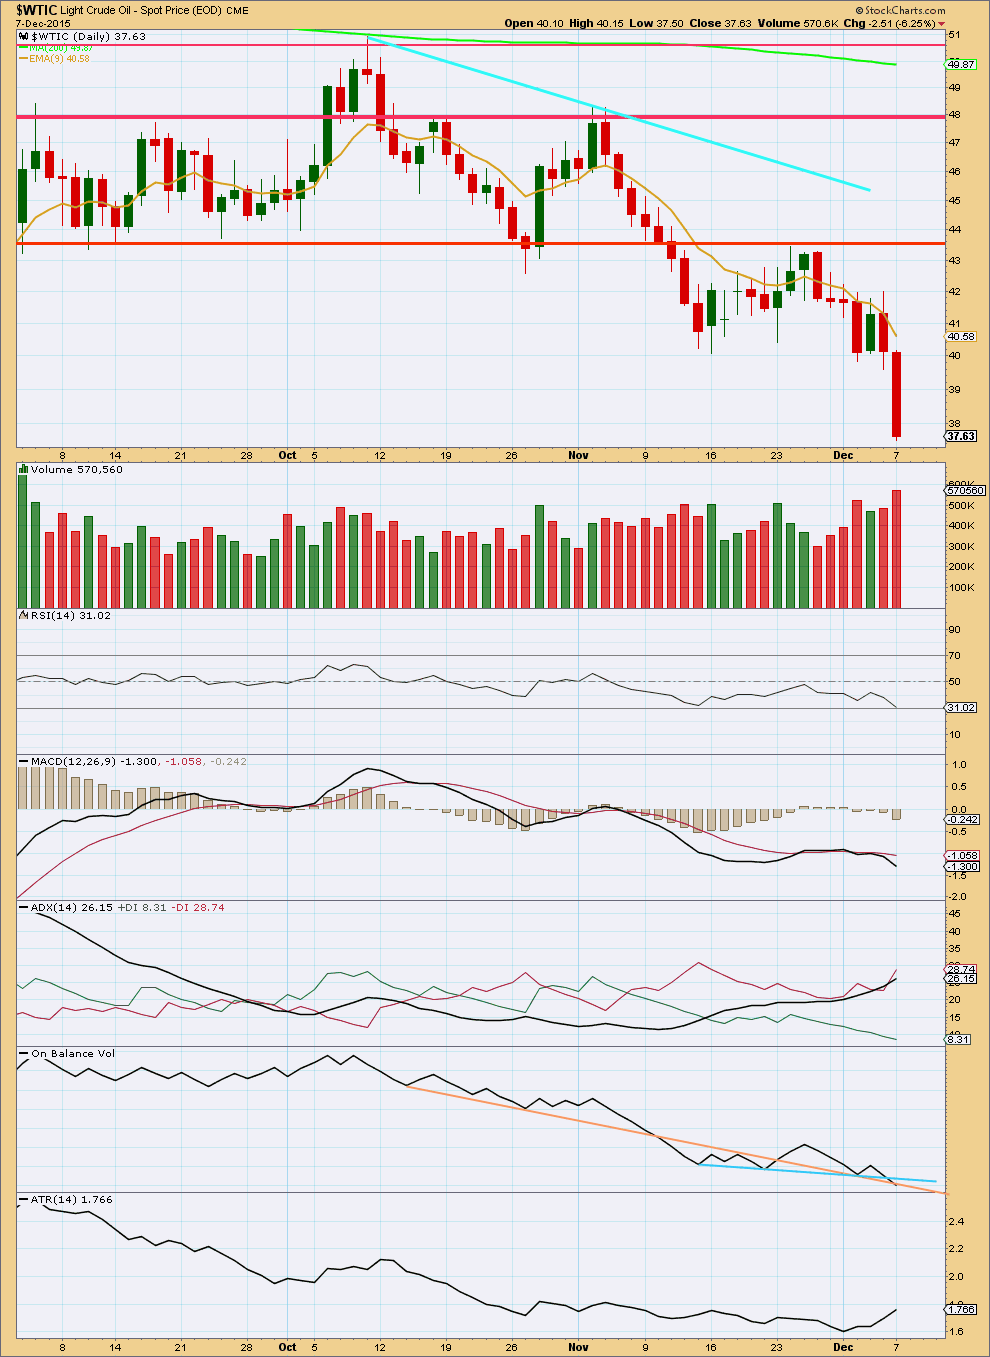
TECHNICAL ANALYSIS
DAILY CHART
Click chart to enlarge. Chart courtesy of StockCharts.com.
Price is falling on increased volume. ADX indicates a downwards trend is in place. This does not support the Elliott wave counts for the short term.
RSI is not oversold, no low is indicated.
ATR agrees with ADX, as it is increasing and indicating a new trend.
On Balance Volume has just broken below a short held support line (blue) and reached the next possible line of support (orange).
Because this regular technical analysis indicates more downwards movement, and there is no indication of a sharp correction to begin here, that is why the Elliott wave count comes with the strong caveat that a green daily candlestick is required for confirmation of a correction.
The trend is down. Corrections are an opportunity to join the trend.
This analysis is published about 02:54 a.m. EST on 8th December, 2015.
With Oil making new lows during the week neither wave count worked this week.
The alternate is updated.
Oil is probably in a third wave down. It’s not done, the structure is incomplete.
Strongest movement may still be ahead as Oil, typical of commodities, tends to have strongest fifth waves.
Short term target for minuette (iii) to end at 33.61. Within minuette (iii) subminuette wave iii is just 0.206 short of 1.618 X subminuette i.
Minuette (iv) should be relatively quick, over in one to three days.
When the orange channel is breached by upwards movement then minuette (iii) should be over and minuette (iv) should have begun. Minuette (iv) should be shallow, it can’t move into minuette (i) price territory above 41.72.
While price remains in the channel expect price to keep falling. Subminuette v may be sharp and strong to the downside. Look for price to find resistance at the upper edge of this small narrow orange channel.
If targets are wrong they may not be low enough.
Lara,
Your new alternate shows a succession of 1-2 1-2 waves within minute wave (iii).
If this is the case, my guess is minuette wave (i) must be a 5 wave structure.
I had a hard time seeing your minuette wave (i) as a 5 wave structure. Does the attached 15 minute chart (Nov 24th-25th) look right to you?
Lara : Is wave 3 going to be equal to wave 1??
US oil should have great support here.
is there a chance to hear Lara’s opinion:/
US oil keep hitting new lows everyday….
US Oil structure may complete at $35 trend line connection wave 3 and wave 1.
A 3 min video of oil EW. Going back to 1890!!!!
https://www.youtube.com/watch?v=b2cYCEW6KmA
Any updated views on oil today? Is that the correction over in a flash and back to downtrend?
It’s so hard to make any money in gold at the moment, I was hoping oil would be more obliging.
Mostly Oil has been easier to pick than Gold.
But this week I got it wrong.
Hopefully next week I’ll be back to getting it right. Because I too want to trade this wave down.
Yes Lara oil is going according your analysis..
Thank u again.. 🙂
Papudi posted a chart with a target of nearly 40$ for correction and your analysis says it must go somewhere near 42$..
Where you see this correction ending..??
On PM bull US oil made a new low. However the stockchart.com wtic chart shows a long legged doji inside the body of long red candle.
This is strange. Data feeds are different. I was expecting low for the and close near the close of yesterday.
Stockchart.com corrected the WTIC chart per my request.
Today has completed a green long legged doji. This is confirmation that an upwards bounce should continue from here.
If today completes a long legged red doji then that shall be adequate confirmation that we most likely have a short term low in place.
Once that’s done then both wave counts will be expecting a bounce.
The bounce should last a few days, maybe longer than a week.
Covered short position on the opening.
Thanks Lara. Now wait for wave iv to complete.
new low of 37.40. Could anybody please tell me what is the possible target to end this downwards movement?
Lara did not mention it.
On alt chart Lara noted target as $30.++ for int wave 3
Thanks.
Looks like that count should be the main one for now…
No. Both wave counts are still the same and both valid.
For both the new low today is the end of the fifth wave of the smaller diagonal structure; for the main count move the label for subminuette v to end minute iii down, for the alternate move the label for subminuette v to end minuette (i) down.
That was the most difficult part with the analysis; was the fifth wave of the diagonal over?
And that’s why I said it needed confirmation with a green daily candlestick.
But if today completes a red long legged doji then that shall be adequate confirmation that this wave down is over.
Thanks Lara.
Oil may bounce upto 39.84 resistance shown on huge consolidation on 4 hour chart.
The DWTI chart shows a gap break out yesterday similar to July 5 the BO.
Now it needs to consolidate here and let the 9ema avg line come closer. I am just comparing the action of July -Aug trending.
Lara :why there is a question whether wave ii is still not complete despite the price traded below last low???????
Because my regular TA didn’t find much bullishness.
And today price has moved lower. That was what I feared may happen.
I was trying to pick a low with the EW count and it wasn’t supported by regular TA.