Another downwards day on lighter volume fits the Elliott wave count.
Summary: The fourth wave correction is not over. Price should remain above 1,081.57. Within the correction, an upwards swing should now begin to reach resistance. It may make a new high above 1,112.19.
New updates to this analysis are in bold.
To see the last long term analysis with weekly charts click here.
MAIN ELLIOTT WAVE COUNT
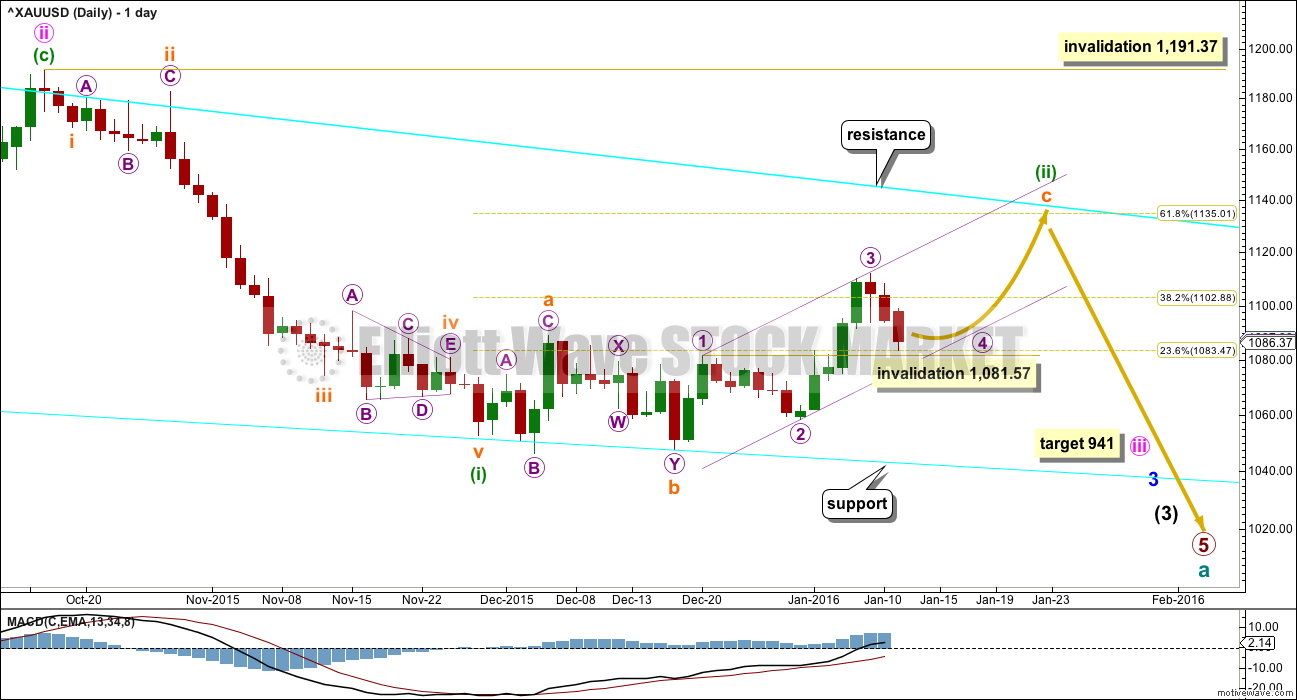
Gold has been in a bear market since September 2011. There has not yet been confirmation of a change from bear to bull, and so at this stage any bull wave count would be trying to pick a low which is not advised. Price remains below the 200 day moving average and below the cyan trend line. The bear market should be expected to be intact until we have technical confirmation of a big trend change.
That technical confirmation would come with a breach of the upper cyan trend line by at least one full daily candlestick above and not touching the line. A new high above 1,191.37 would provide full and final price confirmation.
The final line of resistance (cyan line copied over from weekly charts) is only overshot and not so far properly breached. Simple is best, and the simplest method to confirm a trend change is a trend line.
Minute wave ii is a complete zigzag and deep at 0.73 the length of minute wave i.
At 941 minute wave iii would reach 1.618 the length of minute wave i.
Minuette wave (i) is complete.
Minuette wave (ii) looks like a fairly typical expanded flat correction which may end about the 0.618 Fibonacci ratio at 1,135.
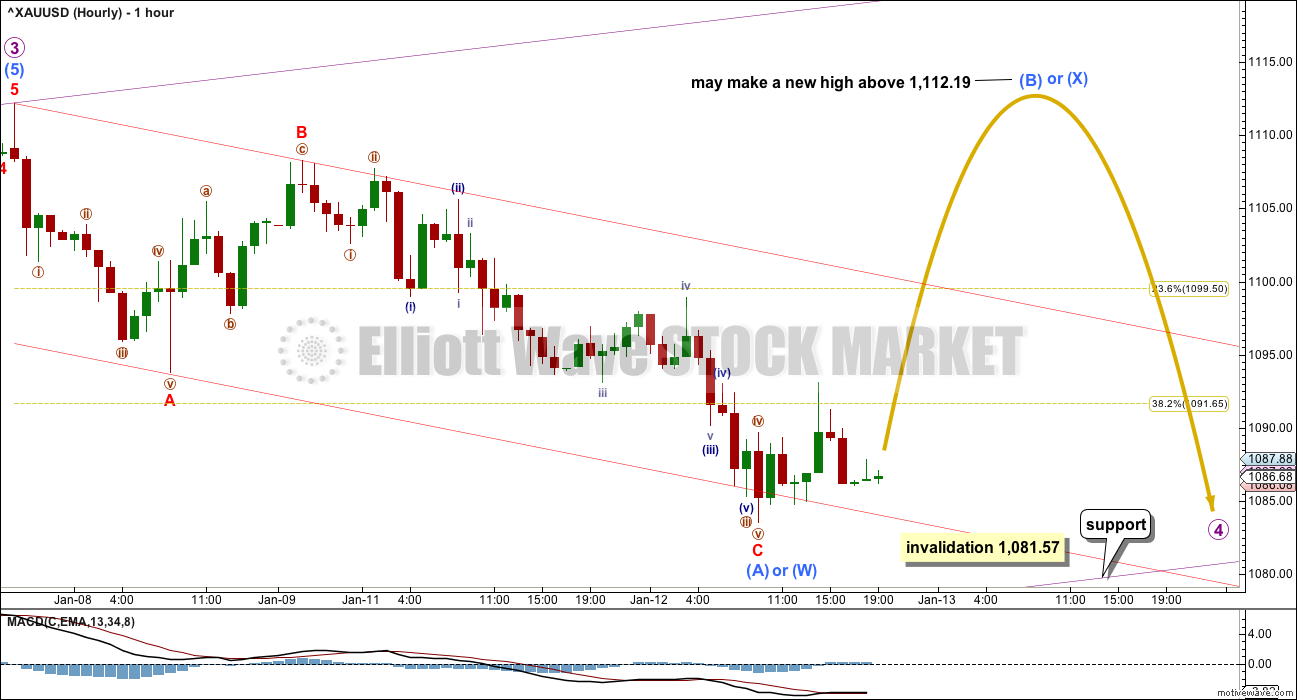
Draw a channel about subminuette wave c using Elliott’s first technique: draw the first trend line from the ends of micro waves 1 to 3, then place a parallel copy on the end of micro wave 2. Look for micro wave 4 to find support at the lower edge of the channel. Copy the channel over to the hourly chart.
There are still multiple structural possibilities that micro wave 4 may unfold as. I am labelling it so far as either a flat or combination, but it may also be a triangle. What that means in practical terms is it is impossible to predict the pathway price may take while this correction unfolds. The labelling on the hourly chart may change over the next few days.
Micro wave 2 was a deep zigzag. It is extremely unlikely that micro wave 4 is now complete as a zigzag because it would exhibit no alternation with micro wave 2. The structure of micro wave 4 is too brief. This is most likely just submicro wave (A) or (W) of a flat, combination or triangle.
The next most likely move within this fourth wave correction is a three wave structure up for a B or X wave.
Micro wave 4 may not move into micro wave 1 price territory below 1,081.57.
Micro wave 2 lasted seven days. Micro wave 4 so far can be counted as two daily candlesticks, so a further three or six to total a Fibonacci five or eight should be expected.
ALTERNATE DAILY WAVE COUNT
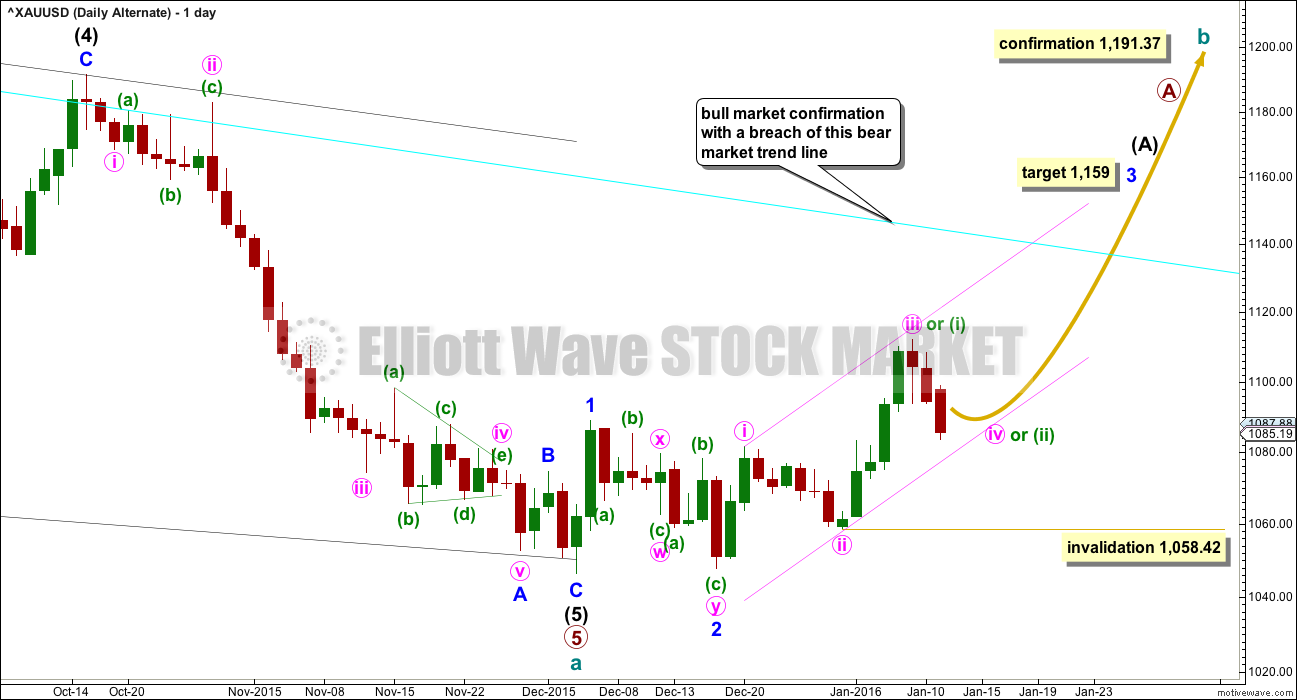
Everything is the same up to the end of the triangle for primary wave 4 (see weekly charts for this larger structure). Thereafter, primary wave 5 is seen as an ending contracting diagonal.
Within the ending contracting diagonal, it is not possible to see intermediate wave (2) as a zigzag and meet all Elliott wave rules. To see an explanation of why see this video at 10:25.
The same problem exists for the ending diagonal of primary wave 5 itself. Intermediate wave (3) is longer than intermediate wave (1) which would suggest an expanding diagonal, but intermediate wave (4) is shorter than intermediate wave (2) and the trend lines converge which suggests a contracting diagonal.
From “Elliott Wave Principle” by Frost and Prechter, 10th edition, page 88: “In the contracting variety, wave 3 is always shorter than wave 1, wave 4 is always shorter than wave 2, and wave 5 is always shorter than wave 3. In the expanding variety, wave 3 is always longer than wave 1, wave 4 is always longer than wave 2, and wave 5 is always longer than wave 3.”
This structure violates the rules for both a contracting and expanding variety. If the rules in Frost and Prechter are accepted, then this is an invalid wave count.
It may be that the rules need to be rewritten to add “sometimes a third wave may be the longest within a contracting or expanding diagonal”. But I have never seen Robert Prechter publish such a rule, I do not know that it exists.
I cannot reconcile this wave count from EWI with the rules in Frost and Prechter.
If this wave count is correct, then the diagonal is most likely over.
This wave count expects that the bear market from September 2011, has very recently ended and that Gold is in a new bull market to last one to several years. A trend change of that magnitude absolutely requires confirmation before it may be used with any confidence.
A new trend up at cycle degree must begin with a clear five wave structure at the daily chart level. So far only minor waves 1 and 2 are complete. Minor wave 3 would reach 2.618 the length of minor wave 1 at 1,159.
Minor wave 3 may only subdivide as an impulse. So far minute waves i, ii and now iii may be complete. Minute wave iv should unfold over 5 or 8 days as choppy overlapping sideways movement. It may not move into minute wave i price territory below 1,081.57.
The hourly chart for this bull wave count would be exactly the same as the bear, only everything would be moved up three degrees.
I want to remind members that last time Gold saw a reasonable upwards movement from 24th July, 2015, to 15th October, 2015, there were many people who expected that rise meant the bear market had ended and a new bull market had begun. It turned out that idea was premature: price turned around and made new lows. On 21st August I developed three bullish wave counts, partly in response to a demand from members, and one by one they have all been eliminated.
Now, again, price rises and there is a demand for bullish wave counts.
It is my strong view that this is premature. I will publish this wave count with that strong caveat.
Eventually the market will change from bear to bull, and when that change is confirmed that is the time to have confidence in a bull wave count. That time is not now.
Price remains below the 200 day moving average. Price has made a series of lower highs and lower lows down to the last recent low. There is not a clear five up on the daily chart. Price remains below the bear market trend line. While price remains below that line this wave count will be an alternate and comes with a strong warning that it is premature.
When the upwards impulse of minor wave 3 is complete, then how low the following correction goes will tell us which wave count, bull or bear, is correct. At that stage, minor wave 4 must remain above minor wave 1 price territory at 1,088.79 while the main wave count will expect new lows.
Minute waves i and ii are complete within minor wave 3.
If minute wave iii is complete at the last high, then minute wave iv may not move into minute wave i price territory below 1,081.57.
If price breaks below 1,081.57, then the degree of labelling within minute wave iii must be moved down one degree. It would be developing as a longer extension; it may be that minuette wave (i) was complete at the last high and the current correction is another second wave for minuette wave (ii). Minuette wave (ii) may not move beyond the start of minuette wave (i) below 1,058.42.
TECHNICAL ANALYSIS

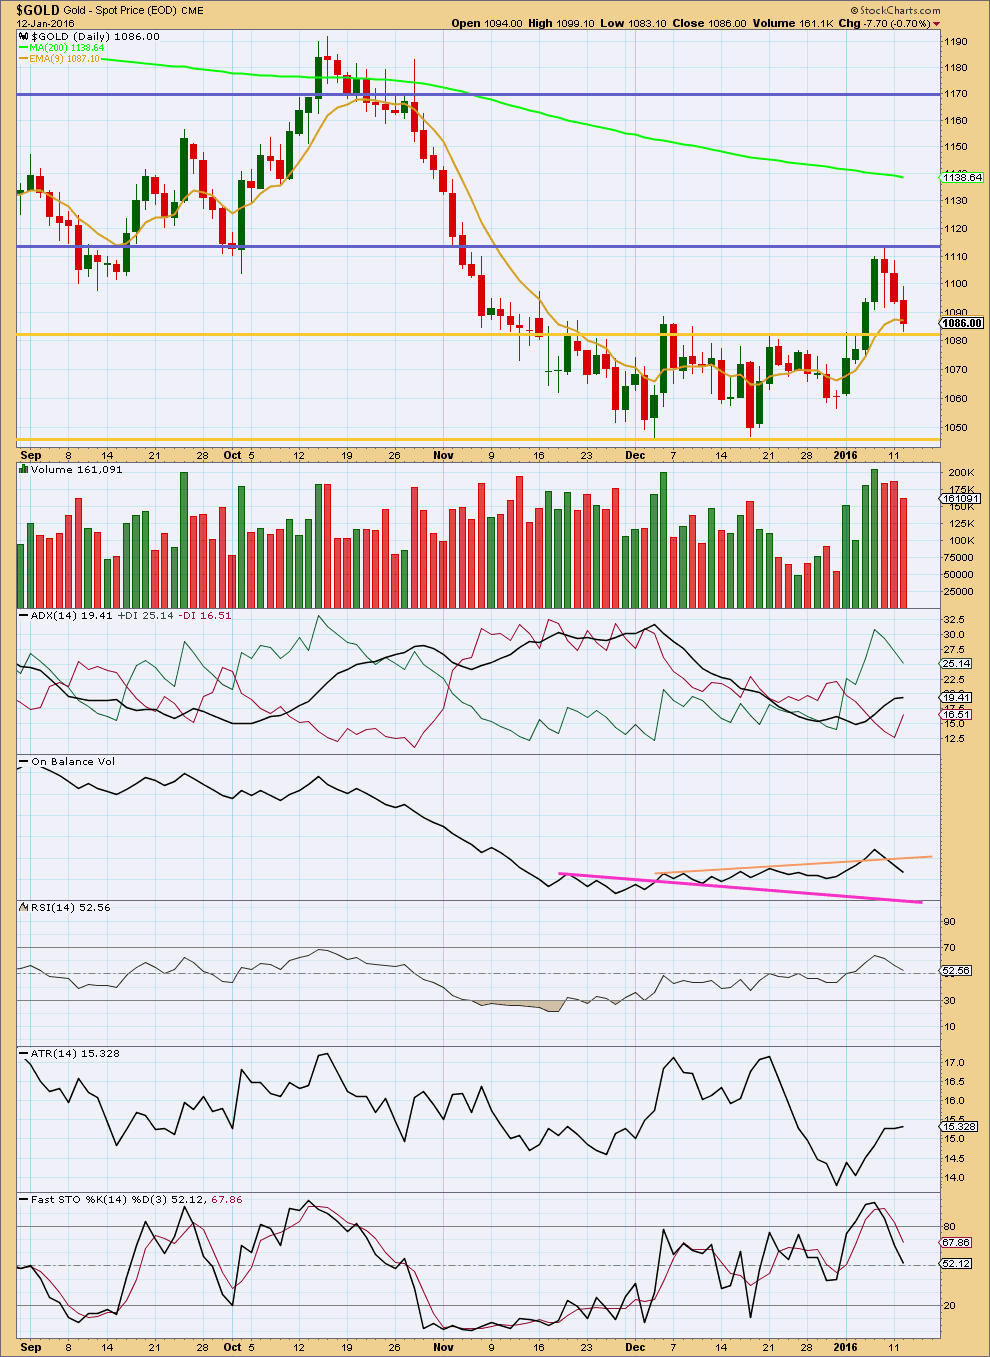
Click chart to enlarge. Chart courtesy of StockCharts.com.
As price falls, volume declines overall. The prior rise in price was supported by volume. The volume profile is bullish and supports the Elliott wave counts which expect this downwards movement is a correction against an upwards trend.
ADX still indicates there is a trend and it is up. ATR still agrees as it too is increasing. These two indicators are lagging as they are based on 14 day averages.
With volume declining while price falls, it looks like price is in the early stage of another consolidation. It may be expected to swing from resistance to support and back again, delineated by the blue and gold lines at the last high and about today’s low. These lines of support and resistance may be to be adjusted further outwards as the consolidation continues. We need to wait for a breakout, a move above resistance or below support on a day with higher volume. At that stage, the market would be again trending.
With Stochastics not yet oversold, a range bound approach to this market would expect a continuation of this downwards swing only to end when Stochastics reaches oversold. The Gold support line may stop price here though. Stochastics may not reach oversold before this downwards swing ends.
This analysis is published @ 08:38 p.m. EST.


Ive got my long GDX and GLD Options, and NUGT positions. Do or die time, seems like it is coming up.
why buy these gold options and nugt now since we are currently in bear wave down before later expected bull wave up? arent you a bit premature?
Check my comments from last week regarding COT.
I agree with you on COT, and I have been leaning bullish because of COT, but the recent weakness in the miners is bearish and confusing. I’m going to post 3 miner charts with Lara’s next post. I’d like to hear your thoughts. Thanks.
Gold does look good bullish even on pm bull hourly gold today hit a 5 day low support and see since start of year gold today hit support line since 2015 and also looking to go up?
http://www.pmbull.com/gold-price/
Lara, what would you say CHFUSD is doing, if you could take a look at it?
and weekly
It looks like it’s in a three down move on the monthly.
I’d expect a continuation of downwards movement.
I don’t trade that currency pair and I don’t have a wave count for it.
And I don’t expect I will do that in the near future.
The alternate wave count has now slightly increased in probability. This downwards movement is another second wave correction as per the green labels on that daily chart. Invalidation point 1,058.42.
The main daily wave count is going to change today. It will see minuette (ii) as a complete double combination. This downwards movement is the very start of a third wave down at four wave degrees. Confirmation point 1,058.42. Invalidation point 1,112.19.
Dreamer posted a chart a couple of days ago of another idea. I’ve charted it for Gold and Silver and spent some time checking the subdivisions at the daily chart level for it. I’ll publish it today because it works, and I’ll go over how it resolves many problems in a video today.
Expected direction for the bear wave count is now down, for the bull (alternate) is up.
Downwards movement is finding support at the channel on the daily and hourly charts. It looks like price is bouncing off that line. While price remains above that line it looks like an impulse is unfolding upwards getting ready for the middle of a third wave. That is my impression of this current movement at this stage anyway. But that fits the alternate wave count and it must come with the strong caveat that it is not confirmed. That’s a big trend change to call.
Thanks Lara.
Dreamer
Is Lara evaluating your idea of ending diagonal completed ??? OR the alternate wave count above is same idea?
My impression is that she is going to evaluate the ending diagonal idea with conclusion that PM wave 5 / cycle wave a is over.
I am confused????
Yes, I have.
Today’s analysis will change both wave counts. There will be a video.
The alternate wave count above also sees the ending diagonal over. So the new alternate wave count will have absolutely zero difference to expectations for direction, targets or invalidation points. But it does resolve many problems.
Lara, looking forward to your comments today if the main daily count can be altered and prove minuette ii correction upward is ongoing. (diagonal in c wave position as Matt has suggested below and yesterday)
Since last few days down have now touched .618 of the up move from Jan-4 I’m hoping so.
Really do appreciate your excellence in presenting the two different camps on where the bottom turns out to be located. Tough job!!
edit: Oh wow, my questions just got answered in the crossing of posting
Seasonal chart
Duplicate of chart below.
When I logged in I did not see the chart with my post. I thought I forgot to include the chart. Oh Well!!! Thanks.
Thanks for posting this. I hope everyone takes a long hard look at it. Gold is doing exactly what it should be doing at this time of year.
Both main daily and hourly wave counts were invalidated however I believe that Lara will make a new wave count for both the main daily and hourly as a Bear count can’t be fully invalidated if price goes below invalidation, we just need a new count for them.
“If price breaks below 1,081.57, then the degree of labelling within minute wave iii must be moved down one degree. It would be developing as a longer extension; it may be that minuette wave (i) was complete at the last high and the current correction is another second wave for minuette wave (ii). Minuette wave (ii) may not move beyond the start of minuette wave (i) below 1,058.42.”
I made some comments yesterday about a possible double combination for the main wave count.
I didn’t want to publish it because it has a low probability. But now its shown itself to be more possible, at least, if the bear wave count is still correct this is the best idea I can see for it at this time.
So that’s how that will change.
Another advantage for gold is that it is in seasonal time period.
From low of DEC-Jan low gold moves higher in FEB then down in March to low.
Below is a 34 yr/15yr seasonal chart.
Here’s what I think, and have thought for awhile. Gold is in a C wave up to complete a (final) correction within a bear market.
The 4th wave within the C wave could have either stayed above its 1st wave territory, or dropped below (in the case of a diagonal). It chose the latter.
I expect gold to now drop into the 1060s or so, but stay above the 1058 invalidation. There may be a slight bump up before it goes there, because this doesn’t have a clear three wave look to it yet….at least not to me. Thereafter, gold shoots up to the area of 1136 (or thereabouts). This lines up with the aqua line, the 0.618 retracement of the move from 1191, and the 200 day moving average.
When that’s done, gold plummets.
To sum it up visually, it is the main daily chart expect that the 4th wave dips to 1060s area.
Instead of 1136, I should have said 1135. However, in the end, it won’t be exactly that anyway.
My original calculation for this correction to end was Jan 25 – Feb 12. So far, so good.
Yes, a diagonal.
That’s possible. I’d expect the first and third waves to have clearer three wave looks to them though.
I’ll consider adding the idea, but I’d have to check subdivisions of first and third waves to see if they fit nicely as zigzags first.
And then the number of possibilities / charts is getting large. That may be confusing for some members, initiating paralysis by over analysis.
The diagonal should be expanding because 4 would be longer than 2 and 3 would be longer than 1. The trend lines should diverge, but so far they don’t. They converge slightly.
It could work if 4 moved lower and lasted longer, then the trend lines would diverge.
Strange, almost like the BOYS bought on lara,s 1081 stop out . Now going UP!
2:07pm
Gold climbs past $1,090/oz in electronic trading after Fed Beige Book
2:00 pm
Fed Beige Book shows continued modest pace of economic growth
Guess I’ll be the first…. 1081.57 (on my chart) has been exceeded. Wave count moves to we are in minuette ii down, perhaps just tagging a long term trendline I do not know. Per Lara
“Minuette wave (ii) may not move beyond the start of minuette wave (i) below 1,058.42.”
As I write this, Gold is around 1,180. Short term, I think the Bulls main option is now the Alternate Daily and we are now in another 2nd wave, green minuette (ii), with invalidation at 1,058.42. If this is the count, I would expect a turn to the upside soon though, otherwise things look pretty bearish.
For the Bears, the move up is likely complete now and there are two options. The Ending diagonal could still need one more low to complete cycle wave a, likely down to the 1,030 range. The other option is that the bear continues down to the 940 range to complete an impulse for primary 5 and cycle wave a.
Currently Lara has only the bear count. If alt is in play the invalidation is below 1058????