
Downwards movement has breached the invalidation point on the main Elliott wave count, but this was allowed for in the alternate.
Overall, a correction against a trend was expected to be continuing.
Summary: The main wave count is changed to see an ending diagonal continuing. With lighter volume for today’s upwards day, it looks like this market is still consolidating. The main wave count will expect some more choppy overlapping overall downwards movement to remain above 1,058.42. In the short term, a new high above 1,112.19 would indicate an upwards breakout and a big third wave up unfolding. The target is at 1,167 short term and 1,227 mid term.
New updates to this analysis are in bold.
It is time again to step back and look at weekly charts. At the end of this analysis I have a new idea for you.
MAIN ELLIOTT WAVE COUNT
Click chart to enlarge.
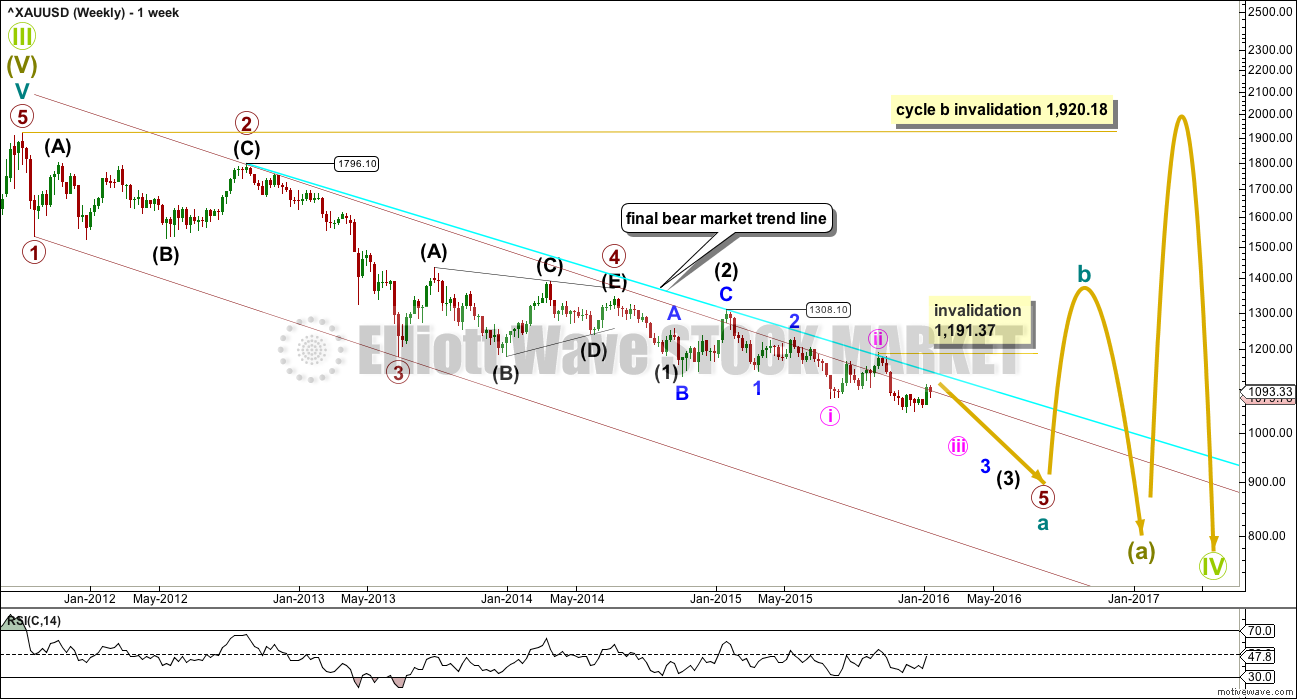
Gold has been in a bear market since September 2011. There has not yet been confirmation of a change from bear to bull, so at this stage any bull wave count would be trying to pick a low which is not advised. Price remains below the 200 day moving average and below the cyan trend line (copied over to the daily chart). The bear market should be expected to be intact until we have technical confirmation of a big trend change.
That technical confirmation would come with a breach of the upper cyan trend line by at least one full daily candlestick above and not touching the line. A new high above 1,191.37 would provide full and final price confirmation.
A five wave impulse is unfolding lower from the all time high. The subdivisions all fit perfectly.
It is not possible to see primary wave 1 ending any earlier because it must be a five. Primary wave 2 was a deep 0.68 running flat lasting 53 weeks. Primary wave 3 was a perfect impulse and 12.57 short of 1.618 the length of primary wave 1. Primary wave 4 was a shallow 0.27 regular contracting triangle lasting 54 weeks. There is perfect alternation in depth and structure between primary waves 2 and 4. There is almost perfect proportion also, which gives the wave count a textbook perfect look at the weekly chart level. It is the proportion between the corrections of an impulse which give it the “right look”.
Within primary wave 5, there is some concern that intermediate wave (2), minor wave 2, and now minute wave ii are all much bigger and time consuming than these corrections at these degrees normally are. The alternate wave counts are considered for this reason.
Click chart to enlarge.
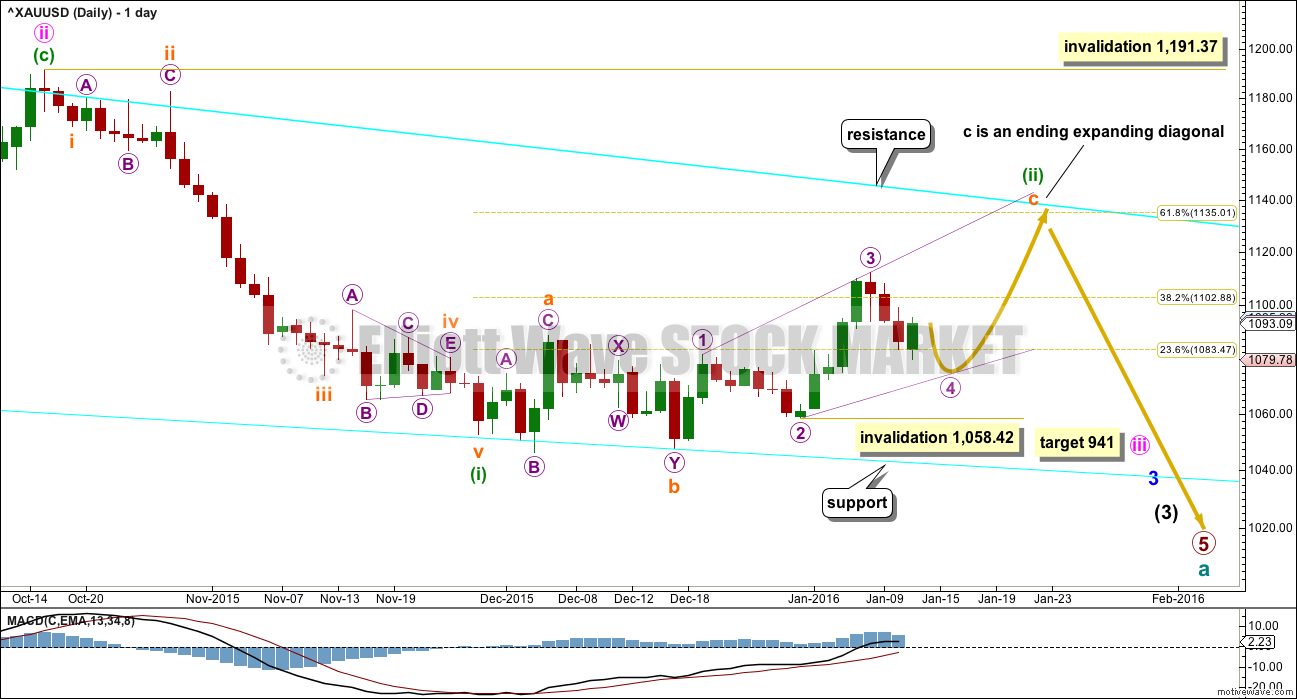
The final line of resistance (cyan line copied over from weekly charts) is only overshot and not so far properly breached. Simple is best, and the simplest method to confirm a trend change is a trend line.
Minute wave ii is a complete zigzag and deep at 0.73 the length of minute wave i.
At 941 minute wave iii would reach 1.618 the length of minute wave i.
Minuette wave (i) is complete.
Minuette wave (ii) looks like a fairly typical expanded flat correction which may end about the 0.618 Fibonacci ratio at 1,135.
There are two structural possibilities for a C wave within a flat correction: either an impulse or an ending diagonal. Because the impulse is now invalidated with the fourth wave overlap into first wave price territory, that leaves only one possible structure for subminuette wave c, an ending expanding diagonal.
All the subwaves must subdivide as zigzags within an ending diagonal. I have checked subdivisions on the hourly chart and both micro waves 1 and 3 can be seen as zigzags. The fourth wave must overlap back into first wave price territory within a diagonal. The rule for the end of the fourth wave is it may not move beyond the end of the second wave. Micro wave 4 may not move below 1,058.42.
The diagonal must be expanding because micro wave 3 is longer than micro wave 1, and micro wave 4 is longer than micro wave 2. The trend lines must diverge. If micro wave 4 is labelled as complete at today’s low, then the trend lines would slightly converge. This means micro wave 4 must move lower, so that the trend lines can diverge.
There is still the possibility that minuette wave (ii) could be labelled as complete at the last high. If it was over, then the only structure I can see which would fit is a double combination. But double combinations are sideways structures; they should not have a slope against the trend one degree higher. This correction has a clear slope. For that reason I still do not want to publish this idea because the probability is too low. I will only publish it if price breaks below 1,058.42.
Click chart to enlarge.
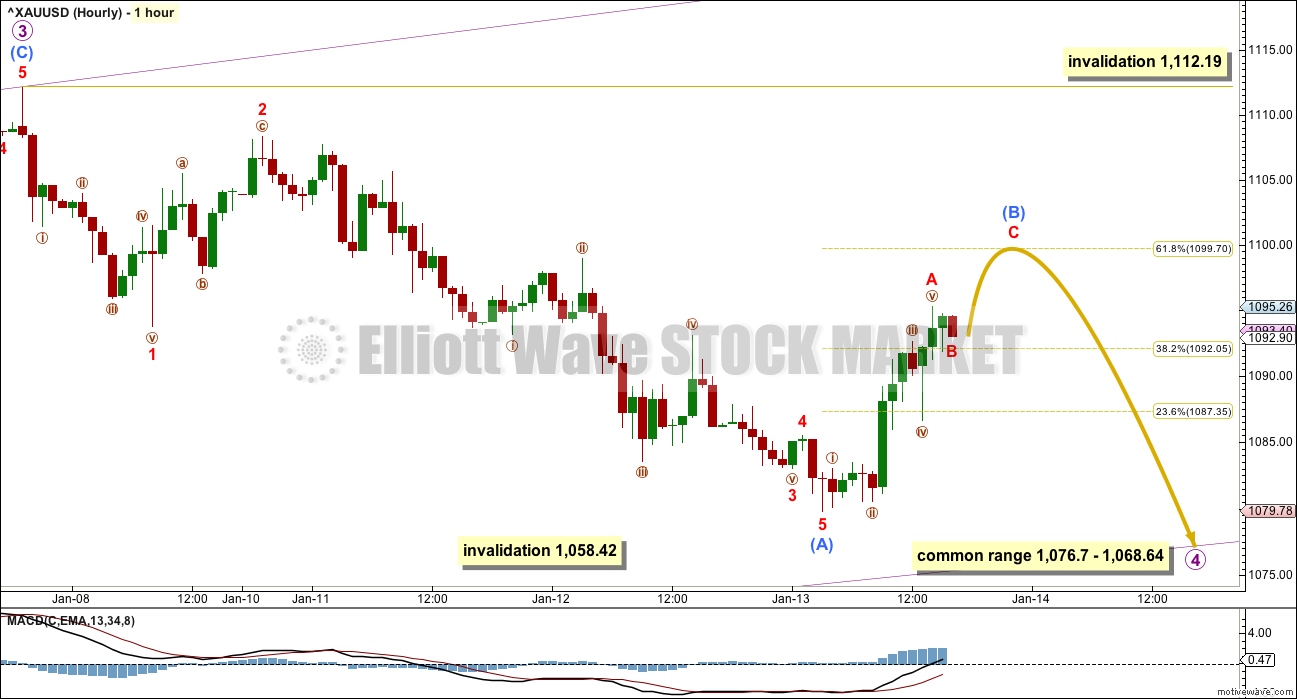
The fourth wave must subdivide as a zigzag within an ending diagonal. This fourth wave must move lower, so that the trend lines of the diagonal diverge.
Submicro wave (A) would be complete within the zigzag. This downwards wave is ambiguous; it will subdivide as either a zigzag or an impulse.
Within the zigzag, submicro wave (B) may not move beyond the start of submicro wave (A) at 1,112.19. Submicro wave (B) must subdivide as a three wave structure, most likely a zigzag, and it would most likely end about the 0.618 Fibonacci ratio of submicro wave (A) at 1,100.
The common depth for fourth and second waves within diagonals is between 0.66 to 0.81 the prior wave. This gives a target range for micro wave 4 between 1,076.7 and 1,068.64.
ALTERNATE WAVE COUNT

Click chart to enlarge.
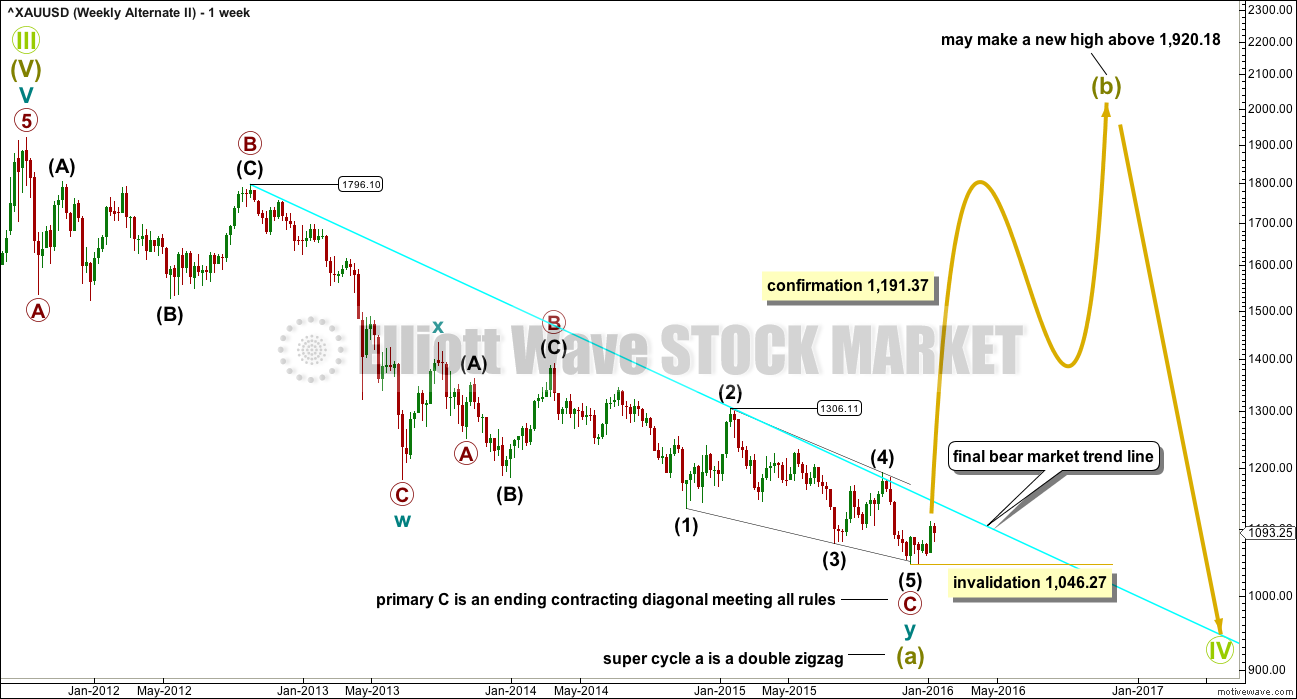
Everything is the same up to the end of the triangle for primary wave 4. Thereafter, primary wave 5 is seen as an ending contracting diagonal.
I have finally resolved the problem of intermediate wave (2). It is possible to see this upwards wave as a single zigzag. Today’s video will show how this is resolved at the daily chart level.
Intermediate wave (3) is longer than intermediate wave (1) which would suggest an expanding diagonal, but intermediate wave (4) is shorter than intermediate wave (2) and the trend lines converge which suggests a contracting diagonal.
From “Elliott Wave Principle” by Frost and Prechter, 10th edition, page 88: “In the contracting variety, wave 3 is always shorter than wave 1, wave 4 is always shorter than wave 2, and wave 5 is always shorter than wave 3. In the expanding variety, wave 3 is always longer than wave 1, wave 4 is always longer than wave 2, and wave 5 is always longer than wave 3.”
This structure violates the rules for both a contracting and expanding variety. If the rules in Frost and Prechter are accepted, then this is an invalid wave count.
It may be that the rules need to be rewritten to add “sometimes a third wave may be the longest within a contracting or expanding diagonal”. But I have never seen Robert Prechter publish such a rule, I do not know that it exists.
If this wave count is correct, then the diagonal is most likely over.
Because for this wave count cycle wave a is seen as a five wave structure, that means cycle wave b may not make a new high above the start of cycle wave a at 1,920.18.
Cycle wave b should last one to several years. It may be any one of 23 possible corrective structures. It must start with a clear five up at the daily chart level for a move of this degree. While that is incomplete, no second wave correction may move beyond its start below 1,046.27. Cycle wave b would be likely to end at either the 0.382 or 0.618 Fibonacci ratios of cycle wave a.
Click chart to enlarge.
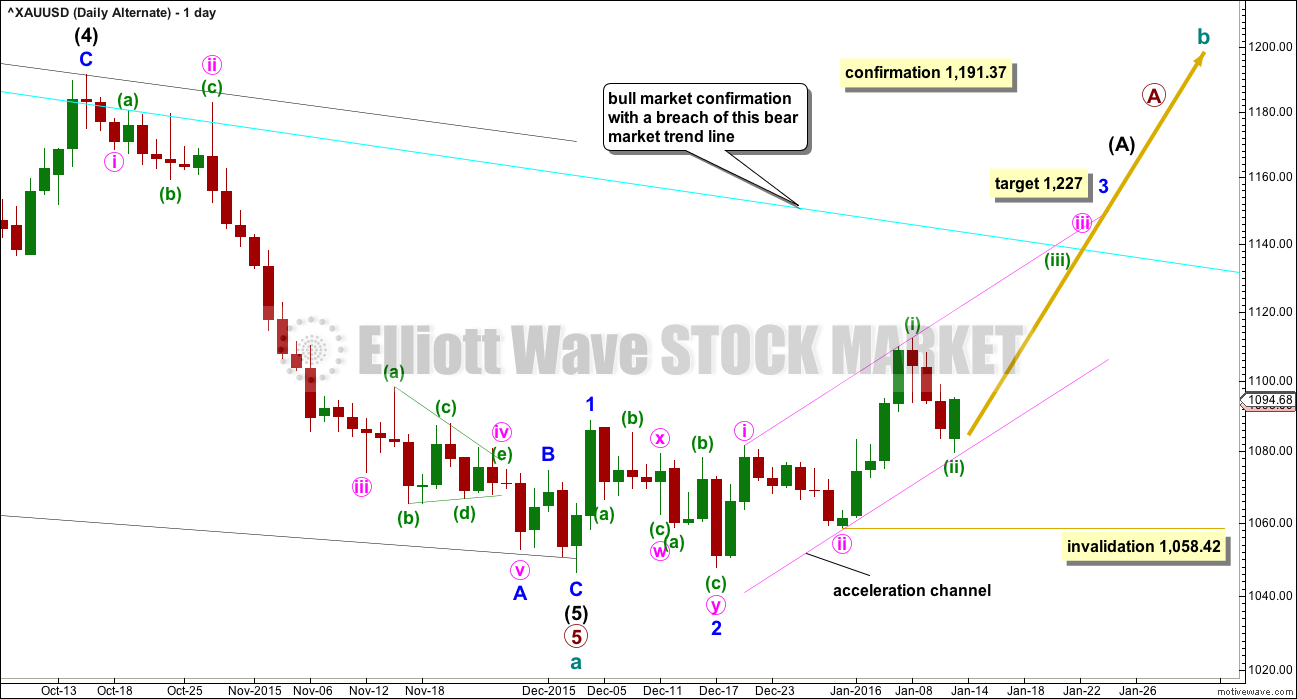
This wave count expects that the bear market from September 2011, has very recently ended and that Gold is in a new bull market to last one to several years. A trend change of that magnitude absolutely requires confirmation before it may be used with any confidence.
A new trend up at cycle degree must begin with a clear five wave structure at the daily chart level. So far only minor waves 1 and 2 are complete.
Minor wave 3 may only subdivide as an impulse. So far minute waves i and ii are complete within minor wave 3. Current downwards movement may not be minute wave iv as it has overlapped back into minute wave i price territory. This must be another second wave correction for minuette wave (ii).
The pink channel is an acceleration channel about this upwards movement. If this wave count is correct, then the lower edge of that channel should provide support. This means minuette wave (ii) should be over. This wave count now expects a third wave up at three degrees to be starting.
At 1,227 minor wave 3 would reach 4.236 the length of minor wave 1. This target is recalculated today to fit with the new target for minuette wave (iii).
I want to remind members that last time Gold saw a reasonable upwards movement from 24th July, 2015, to 15th October, 2015, there were many who expected that rise meant the bear market had ended and a new bull market had begun. It turned out that idea was premature: price turned around and made new lows. On 21st August I developed three bullish wave counts, partly in response to a demand from members, and one by one they have all been eliminated.
Now, again, price rises and there is a demand for bullish wave counts.
It is my strong view that this is premature. I will publish this wave count with that strong caveat.
Eventually the market will change from bear to bull, and when that change is confirmed that is the time to have confidence in a bull wave count. That time is not now.
Price remains below the 200 day moving average. Price has made a series of lower highs and lower lows down to the last recent low. There is not a clear five up on the daily chart. Price remains below the bear market trend line. While price remains below that line this wave count will be an alternate and comes with a strong warning that it is premature.
When the upwards impulse of minor wave 3 is complete, then how low the following correction goes will tell us which wave count, bull or bear, is correct. At that stage, minor wave 4 must remain above minor wave 1 price territory at 1,088.79 while the main wave count will expect new lows.
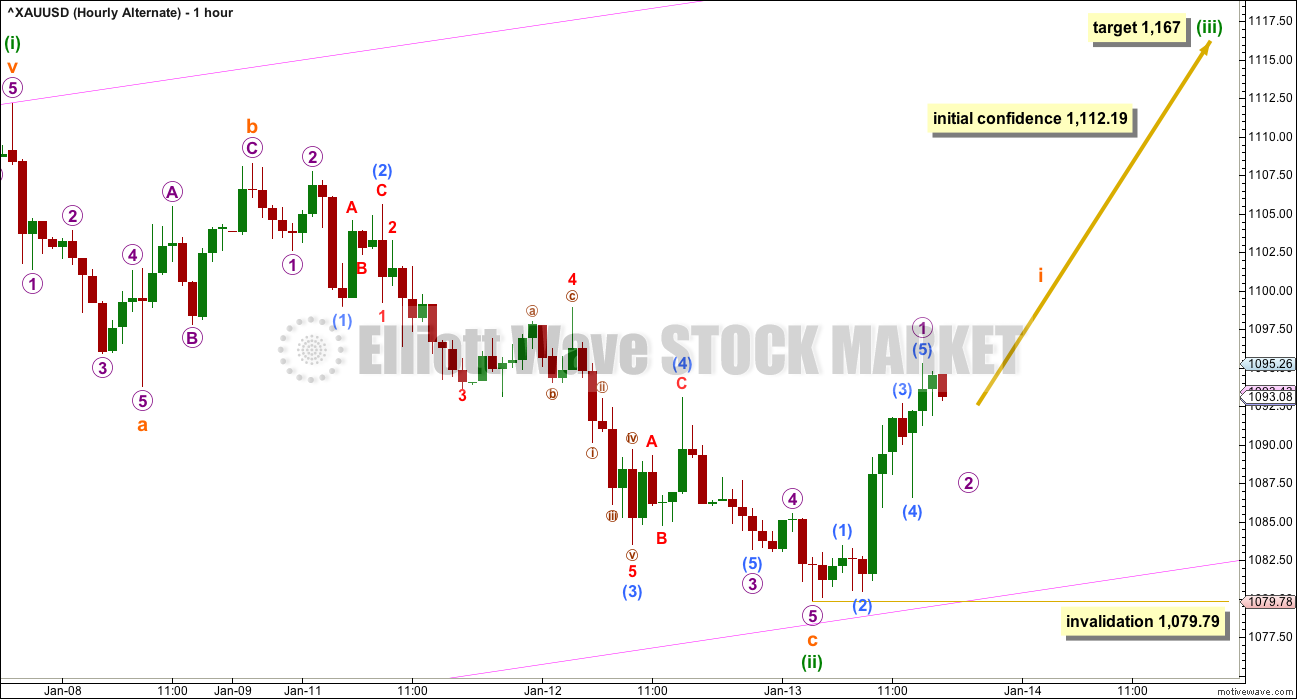
Click chart to enlarge.
Because the hourly charts for the main and alternate now diverge, I will publish an hourly chart for both.
Downwards movement labelled minuette wave (ii) is ambiguous. It will subdivide as either an impulse or a zigzag. This wave count sees it as a complete zigzag.
The pink channel is the acceleration channel copied over from the daily chart.
At 1,167 minuette wave (iii) would reach 1.618 the length of minuette wave (i).
Minuette wave (iii) may only subdivide as a five wave impulse. Within minuette wave (iii), subminuette wave ii may not move beyond the start of subminuette wave i below 1,079.79.
SECOND ALTERNATE WAVE COUNT
Click chart to enlarge.
Thank you to our member Dreamer for posting a chart of this idea.
I have checked all the subdivisions and it will fit. This idea resolves the problem that the first alternate has of the ending diagonal not meeting all the rules.
If downwards movement is a double zigzag, then this would most likely be super cycle wave (a) within Grand Super Cycle wave IV.
This wave count must ignore what looks like a triangle from June 2013 to July 2014. But apart from that problem it all fits very well. It also works perfectly for Silver on cash data.
If this is a double zigzag, then within the first zigzag there is still a good Fibonacci ratio of 1.618 between primary waves A and C.
Within the second zigzag, the ending diagonal now begins earlier. This means that within it intermediate wave (3) is now shorter than intermediate wave (1). All the rules for an ending contracting diagonal are met. The structure looks complete at the weekly and daily chart level. I have learned the hard way (on the S&P500 analysis) to expect a contracting diagonal is complete as soon as there is an overshoot of the 1-3 trend line and price reverses from there. Because on the daily chart the overshoot is clear (even though it is small), I will follow this lesson and expect the structure is complete.
On all weekly and daily charts the final bear market trend line is drawn from exactly the same two price points as marked. It is essential that this trend line is breached before any confidence at all may be had in a major trend change. These two bull wave counts come with that strong caveat.
When an A wave subdivides as a three, then the larger structure may be either a flat or triangle. The B wave may make a new price extreme beyond the start of the A wave within flats and triangles. Here, super cycle wave (b) may move above 1,920.18 as in an expanded flat or running triangle.
When the first move of a larger correction subdivides as a multiple (w-x-y), then a combination may be eliminated. Combinations may not have multiples within multiples, because that would increase the number of corrective structures within a multiple beyond three and violate the rule.
If we get bull market confirmation with a breach of the bear market trend line, then I will have two weekly wave counts: this idea and the other idea presented in this analysis as “Alternate Wave Count”.
TECHNICAL ANALYSIS
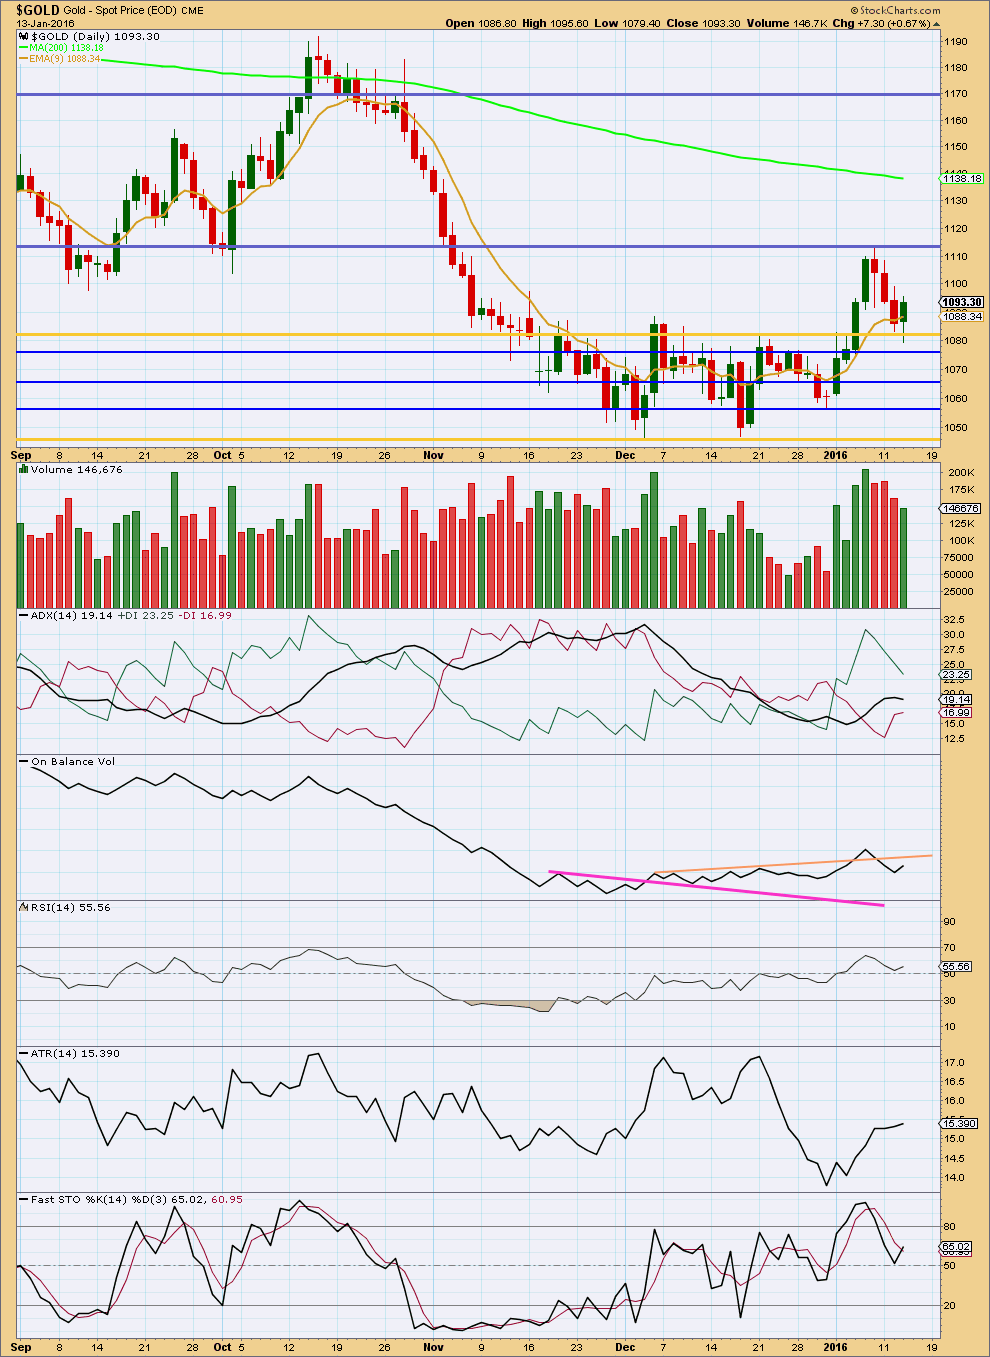
Click chart to enlarge. Chart courtesy of StockCharts.com.
Volume continues to decline. Importantly, today’s green candlestick comes on declining volume also. The upwards move in price was not supported by volume. This makes the last three days look typically corrective.
ADX finally is beginning to agree. The black ADX line is now flat indicating the market is not trending but consolidating. ATR is still increasing, but the upwards slope is declining.
It may now be expected that price will swing from resistance to support and back again. We need to wait for a breakout. With Stochastics not reaching oversold, it would be expected that price may continue overall lower until Stochastics is oversold and price finds support at the same time.
The consolidation is immature. The extent of support and resistance may not yet be determined. I have added three new blue horizontal lines below the gold horizontal lines. When Stochastics reaches oversold on a downwards swing, then the support line reached may then delineate the lower edge of this consolidation. At this stage, it looks like the gold line is not low enough.
More trend lines may be used with On Balance Volume to indicate a breakout direction as the consolidation matures.
This analysis is published @ 07:45 p.m. EST.
Inside week so far H 1113 / L 1062… Would like to see 1062 taken out Friday lol….With the lower band at 1051-50, there appears plenty of room to the downside, does that threaten a break below invalidation 1058.42 I wonder. Alas Gold price did not get a break below 1071 today…
Y cant i open silver and crude analysis…:((..what happend..??
Cesar will email you with regards to your question.
Hmmm….this is not done…:(
Anyways thanks for reply…:)
You have signed up for Gold only. And that is why you have access to Gold only.
I do not think it is appropriate to comment further on your membership in a semi public forum.
Cesar will email you.
Check your account profile.
A notice to all members: I was advised yesterday by the MTA that I’ve been awarded CMT.
So now its official. You have a recognised qualified person doing your analysis for you 🙂
That is super Lara, CMT
Congratulations on your awesome accomplishment.
Congrats! You earned it and we appreciate your efforts ??
Congrats!!!!!
Great achievement for you and all of us here.
Thanks for hard and sincere work.
Thank you very much everybody.
I highly recommend the CMT course actually. I have learned an enormous amount, have a good library of technical analysis books and have much more confidence in my trading. It has made a huge difference!
Contratulations Lara.
If I were feeling weller (??) I’m sure I’d have more to say right now.
Keep smiling/shining. 🙂
Lara, congratulations on being awarded CMT. Bravo~!
Congrats!
For the bear / main wave count:
Micro wave 4 is closing in on the target range. This must be a zigzag. At 1,067 (C)=(A). Just below the common range.
Once that is done then the upwards trend should resume.
For the bull / alternate wave count:
Minuette (ii) is continuing lower as either a single or double zigzag. The acceleration channel should be removed. A base channel about minute i and ii drawn. The lower edge of this is a more conservative line which should provide support if this wave count is correct.
For both bull and bear on the hourly chart this downwards move is not done yet. The middle of a small third wave has just passed. Now a series of two or three fourth wave corrections followed by fifth waves down must unfold to complete the structure downwards.
Volume so far is light and declining overall while price falls for these last few days. The volume profile looks corrective. Support lines on the TA chart next are about 1,065 and then 1,056.
The invalidation point for both wave counts for this downwards move will remain the same at 1,058.42.
Thanks Lara, and congratulations!
Thank you for commenting early today, and by-the-way, great video last night- I think you had lots of syncopation and had appropriate time distribution to the subject matter (weekly v. daily/hourly explanation). You’ve made improvements (IMHO).
Gold Pressured By Rebound In U.S. Stock Market, Firmer U.S. Dollar
Thursday January 14, 2016 13:02
http://www.kitco.com/news/2016-01-14/Gold-Pressured-By-Rebound-In-U-S-Stock-Market-Firmer-U-S-Dollar.html
Gold just made another low 1076.16 at 1:20 pm.
Stock market up 1.5%+ today and US dollar up and gold down.
NUGT has wild range on the way down to lowest in over a month. GDX lowest in over a month.
Looking for Lara’s comments before bottom feeding on GDX.
Bull hourly was just invalidated below 1079.79 at 12:24 pm Gold now hit low of 1076.80 at 12:32 pm.
Hit top of Micro wave 4 target range 1076.70 – 1068.64
I was looking to buy some GDX, however perhaps I might wait for Lara’s comments as gold not following analysis, way too bearish.
Any wave counts?
Ditto. I’m hoping not to wait for a) end of day analysis or b) 1058.42 invalidation that someone can put worst fears (that we started waterfalling) to rest.
Gold continues to make new lows for the day, which is a bearish sign.
Just hit low of 1080.54 at 12:06 pm, which is lower than expected today. Bull hourly invalidation at 1079.79. I think something is not as per analysis?
Elliott Wave question…
Lara, can you confirm this rule: Wave B never goes beyond the start of Wave A(zig zag) . (in main hrly) regarding can miniscule B travel below the start of miniscule A?
That’s correct. Within a zigzag (because A subdivides as a five) B may not move beyond the start of A.
Today is more bearish gold than I expected as per Wed analysis.
Are we about any minute now begin heading towards 1100 area or it looks almost like gold might be heading to test lower bull hourly trend line near 1181 or maybe even 1079.79 bull invalidation?
For the bear count on the hourly chart the bit that was wrong was expecting some upwards movement before price turned around to make new lows.
But overall this downwards movement to complete a zigzag for micro 4 fits. Price is close now to the target range.
If a trend line is drawn between the lows of Dec 17th and 31st, and then extended outward, it may provide support for gold around the 1070 area. If so, it would fit nicely into the common range of a 4th wave within a diagonal.
1070 would change a lot about the analysis if gold came close to that support.
I hope Gold may come back down soon today to test low of 1083.04 from 9:22 am then I buy some GDX and or NUGT.
Was it a count of 5 already up to 1088.94 at 10:04 am from 1083.04?
I’m watching too — actually GG which is showing weaker. Is this a buyin or a downward breakout. How do you determine? Using 1079.79 invalidation pt on XAU for alt, but main hrly has lower lows possible? Are you buying?
If 1081.60 holds I will buy a little GDX and it may be tested very soon or just was?
Also Looking for a double bottom any minute on GDX or NUGT to buy GDX.
Avi Gilburt – Corrective Rally Continues Wednesday January 13, 2016 11:18
First published Sat Jan 9
GDX and GLD
http://www.kitco.com/commentaries/2016-01-13/Corrective-Rally-Continues.html
Just to play devil’s advocate…..
Couldn’t (or shouldn’t) the final 5th wave of the 2nd alternate move lower still? The idea isn’t bad, it just appears incomplete.
To me it looks like the 2nd of the 3 waves of this 5th wave diagonal is getting close to completion, but there is still one final leg down to go.
Any way that I look at gold, it needs to make a new low.
GDX for Wednesday January 13th 2016 – EW
Market Vectors Gold Miners ETF (GDX) should be in a 4th wave bounce within wave i of (c) in blue, still needing one more low to complete 5 down before a corrective bounce in blue wave ii.
Resistance above for this 4th wave is 13.88, so as long as we do not exceed that level on this bounce, we should see one more low near 13.19 to complete blue wave i.
https://www.elliottwavetrader.net/scharts/Charts-on-FRC-IBB-GDX-201601131053.html
click on GDX EW chart to enlarge it.
Lara, now we are totally confused, lol! This is a really great post! We should have more clarity soon.
Maybe you can add it to Gold Historical?
Also, would appreciate a GDX update when you have time. Thanks!
Dreamer
What is the difference between alt i and alt ii??
Both at ending contracting diagonals.
Both expect that Cycle wave a is complete and that we are entering a bull Cycle wave b that could last over a year. The difference is that Alt 1 sees Cycle wave a as a “5” and Alt 2 sees Cycle wave a as a “3”. The structure of Cycle wave a determines the options for the overall structure of Supercycle wave IV. Alt 1 means that Cycle wave b will likely be a zig-zag “3” that cannot make a new high above 1,920.18 and Alt 2 also means that Cycle wave b will also likely be a zig-zag “3”, but it could go much higher and could make a new high above 1,920.18. Under the Alt 1 Scenario, Supercycle wave IV will likely be a zig-zag 5-3-5 structure and in the Alt 2 scenario, Supercycle wave IV will likely be a flat 3-3-5, an expanded flat 3-3-5, or a triangle 3-3-3-3-3. Each wave within the Supercycle is at Cycle degree, so you can see that a triangle could last many years. A combination has been ruled out as Lara states above. I hope this makes sense and I got it right. Lara or others, feel free to correct.
Well done!
Do you want my job? 🙂
I notice you’ve assumed that both wave counts are seeing super cycle (a) complete at this low or still to complete (bear). I actually have the degree of labelling different. I think I may need to move the degree of labelling for the bear up one degree.
The only thing that I would change about your comment is the mention that cycle b should be a zigzag.
Nope.
B waves are the absolute worst. There really are 23 possible structures it can be. A zigzag or zigzag multiple are only three of the possible 23.
And it can be any one. None should be preferred over another, none are more likely. Only a few (running flats, expanding triangles and triple combinations) are unlikely.
Thanks Dreamer/Lara for nice explanation. It is nice of Lara that other alternate waves are also published for us to see and decide which way gold is to behave.
Thanks.
Dreamer, I’m very impressed in your summary.
Thanks Richard.
I’ve been leaning bullish lately with:
1) Bullish COT for several weeks
2) Miner bullish divergence with Gold [Miners (GDX, $HUI) bottomed on Sep 11 and Gold bottomed on Dec 3], although Silver miners (SIL) just made a new low adds a ?
3) Possibility that Cycle wave a is complete with the ED scenario
but, the recent miner weakness is really confusing. Miners stopped leading the way up and some of their charts are leaning bearish. We should have an answer soon. Any thoughts?
GDXJ:
SIL looking very weak
To me, the recent weakness in miners compared to gold makes sense for a bottom and fits with the alternates. Both gold and gdx could be setting up for a series of 1-2s up or down. I am watching 1 min, 5 min, 15 min, and 60 min charts on gold and everything I am counting is 5 up 3 down, but I am not an expert (why I am here). My COT analysis shows that Swaps don’t lose money when they build a big position, in this case they are long and built that position 7 to 10 weeks ago in the 1060-1085 range. So I feel good being long right now because I think there is a floor in that region. Now, the caveat is if the swaps are positioning for the turn from bear to bull. In 2011, it took them a while and the COT data when dramatically from one extreme to the other and appeared to be inverted in some ways (my data anyway did). This could be all part of that process, in that case the swaps may give up another low in gold soon in order to build a significant long position (they are net long 23K contracts or so as of last COT).
My positions are swing, designed to look out a few months. A break below 1058 and I will probably choose to sell them and reposition further out in time.
Thanks
Then again….maybe not.