
Upwards movement continues as expected.
Summary: The target for the bear wave count remains at 1,135, which may be met in a further seven trading days. The target for the bull wave count is at 1,227 mid term, which may be met in a further nine or thirty trading days. More confidence may be had in these expectations with a new high above 1,109.31.
New updates to this analysis are in bold.
Last published weekly charts with the bigger picture are here.
MAIN BEAR ELLIOTT WAVE COUNT
Click chart to enlarge.
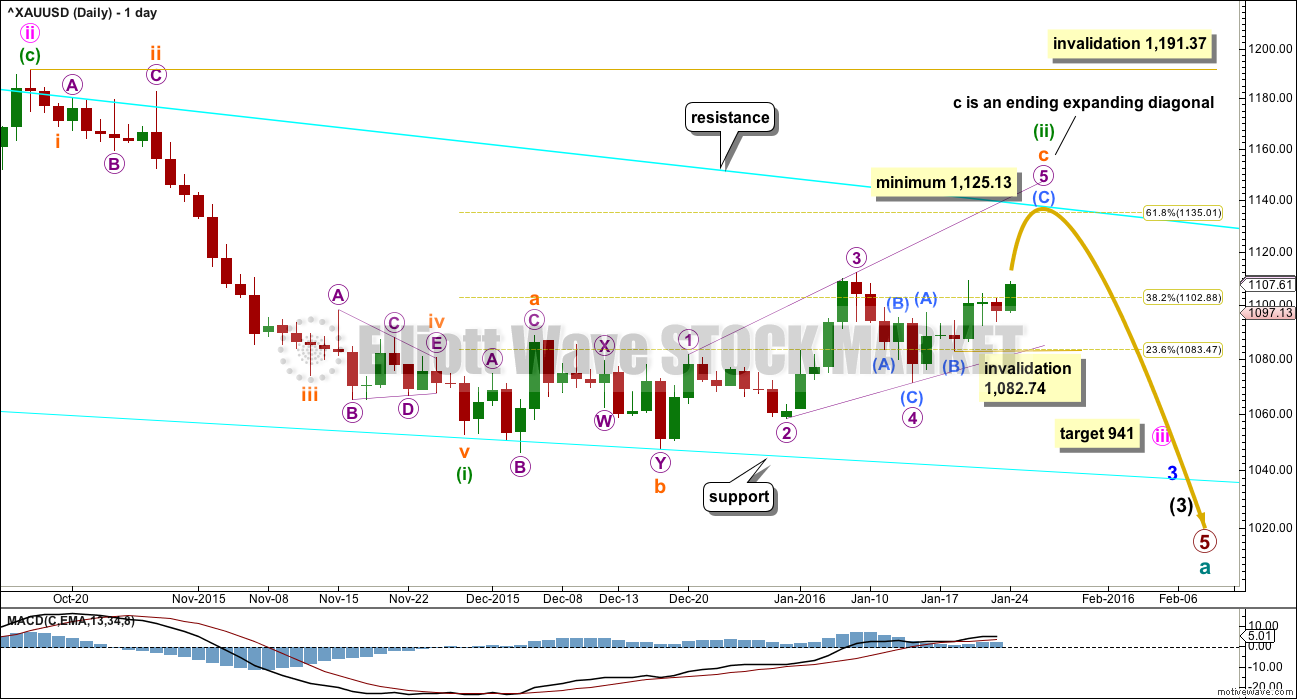
Gold has been in a bear market since September 2011. There has not yet been confirmation of a change from bear to bull, so at this stage any bull wave count would be trying to pick a low which is not advised. Price remains below the 200 day moving average and below the cyan trend line. The bear market should be expected to be intact until we have technical confirmation of a big trend change.
That technical confirmation would come with a breach of the upper cyan trend line by at least one full daily candlestick above and not touching the line. A new high above 1,191.37 would provide full and final price confirmation.
The final line of resistance (cyan line copied over from weekly charts) is only overshot and not so far properly breached. Simple is best, and the simplest method to confirm a trend change is a trend line.
Minute wave ii is a complete zigzag and deep at 0.73 the length of minute wave i.
At 941 minute wave iii would reach 1.618 the length of minute wave i.
Minuette wave (i) is complete.
Minuette wave (ii) looks like a fairly typical expanded flat correction which may end about the 0.618 Fibonacci ratio at 1,135.
Subminuette wave c may be unfolding as an ending expanding diagonal. Ending diagonals require all subwaves to subdivide as zigzags. No second wave correction may move beyond the start of its first wave at 1,082.74 within submicro wave (C).
The diagonal must be expanding because micro wave 3 is longer than micro wave 1, and micro wave 4 is longer than micro wave 2. The trend lines diverge. Micro wave 5 must be longer than micro wave 3, so it must end above 1,125.13.
There is still the possibility that minuette wave (ii) could be labelled as complete at the last high. If it was over, then the only structure I can see which would fit is a double combination. But double combinations are sideways structures; they should not have a slope against the trend one degree higher. This correction has a clear slope. For that reason I still do not want to publish this idea because the probability is too low. I will only publish it if price breaks below 1,071.36.
Click chart to enlarge.
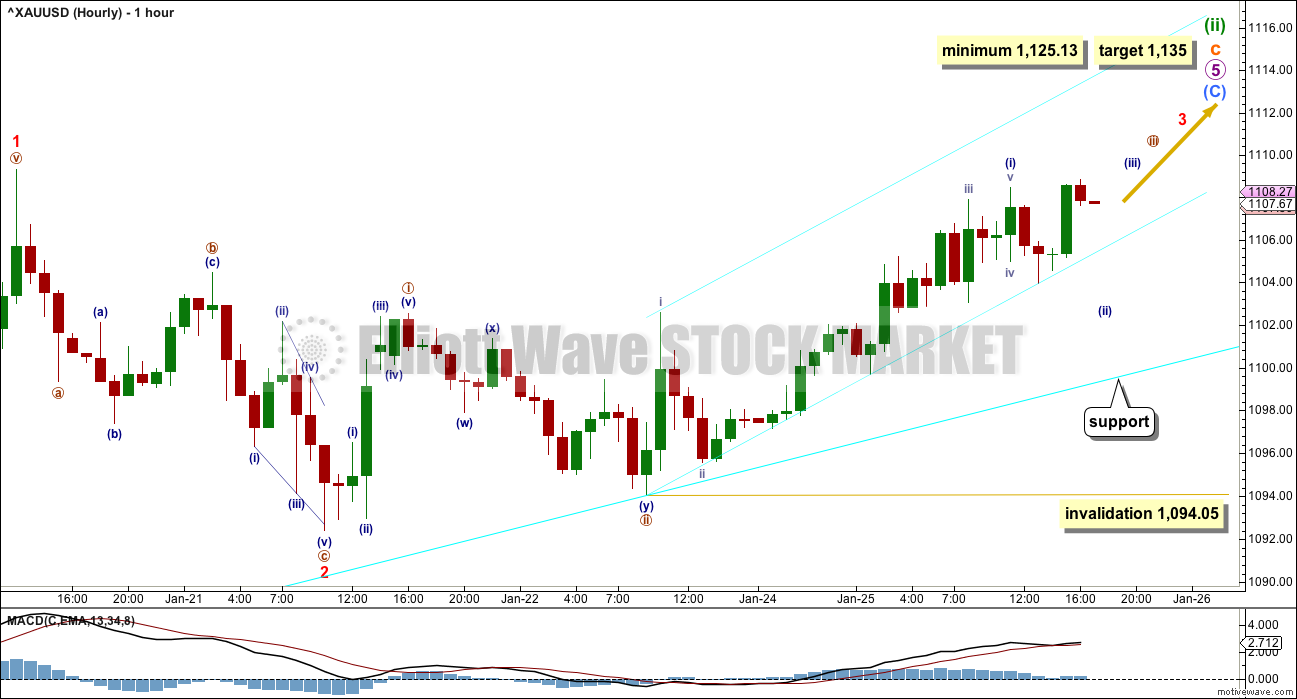
Micro wave 5 upwards is underway and must subdivide as a zigzag.
The diagonal is expanding, so micro wave 5 must be longer than micro wave 3. Micro wave 5 would reach equality with micro wave 3 at 1,125.13. It must end above this point.
The target will remain the 0.618 Fibonacci ratio at 1,135. The cyan line, the final bear market trend line on the daily chart, should provide strong resistance for this wave count.
Submicro waves (A) and (B) are complete within micro wave 5. Submicro wave (C) is underway and must subdivide as a five wave structure.
So far minuscule waves 1 and now 2 are most likely complete. Minuscule wave 3 must move above the end of minuscule wave 1 at 1,109.31, and it should show an increase in upwards momentum.
So far subminuette wave c in its entirety has lasted 24 days. If it exhibits a Fibonacci number, it may complete in a total 34 days which would see it continue now for a further 7 trading days. This is a rough expectation only; it may not exhibit a Fibonacci number.
Upwards movement from the end of nano wave ii (brown circle) so far fits into a best fit cyan channel. If this channel is breached to the downside, it would be another second wave correction most likely. If the channel is breached to the upside, then the middle of a third wave should be taking off. No second wave correction may move beyond the start of its first wave below 1,094.05 within nano wave iii.
ALTERNATE BULL WAVE COUNT
Click chart to enlarge.
This was published here as a second alternate wave count. I will use it as the only regular alternate bull wave count because it is the only bull wave count to meet all Elliott wave rules.
I want to remind members that last time Gold saw a reasonable upwards movement from 24th July, 2015, to 15th October, 2015, there were many who expected that rise meant the bear market had ended and a new bull market had begun. It turned out that idea was premature: price turned around and made new lows. On 21st August I developed three bullish wave counts, partly in response to a demand from members, and one by one they have all been eliminated.
Now, again, price rises and there is a demand for bullish wave counts.
It is my strong view that this is premature. I will publish this wave count with that strong caveat.
Eventually the market will change from bear to bull, and when that change is confirmed that is the time to have confidence in a bull wave count. That time is not now.
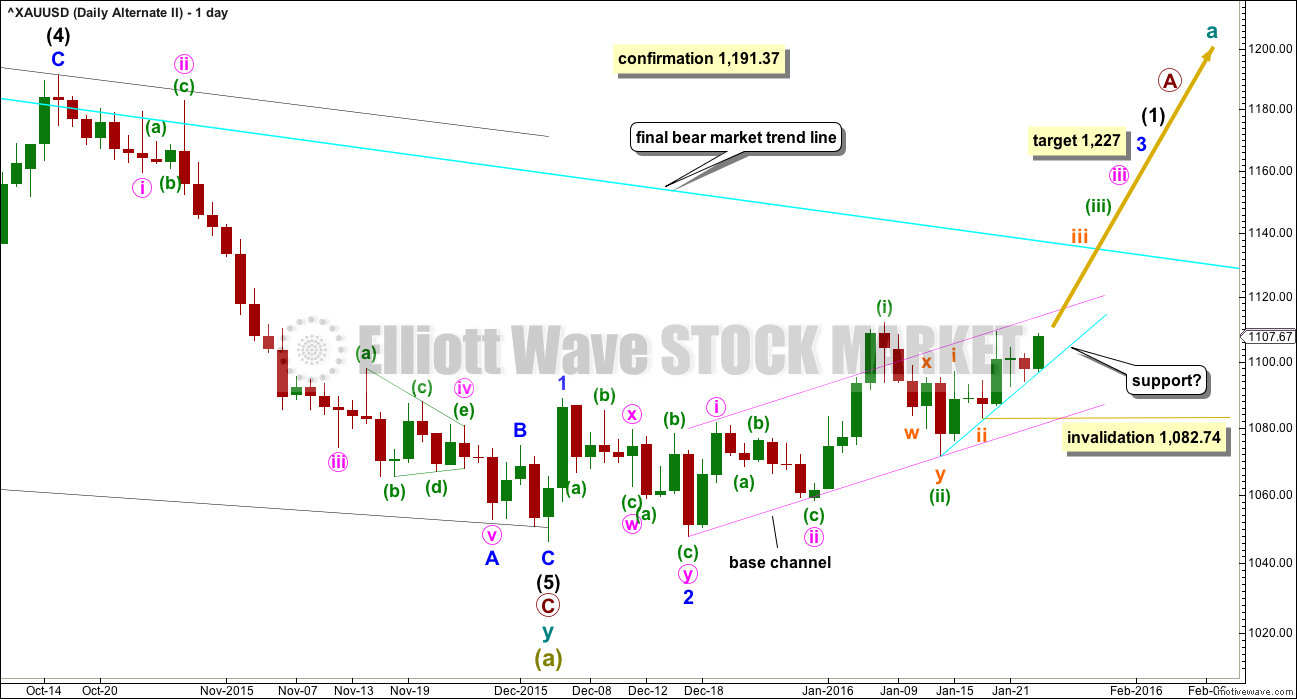
Price remains below the 200 day moving average. Price has made a series of lower highs and lower lows down to the last recent low. There is not a clear five up on the daily chart. Price remains below the bear market trend line. While price remains below that line this wave count will be an alternate and comes with a strong warning that it is premature.
Downwards movement from the all time high for this bull wave count is seen as a big double zigzag which would most likely be complete at super cycle degree for an A wave.
When an A wave subdivides as a three, then the larger structure may be either a flat or triangle. The B wave may make a new price extreme beyond the start of the A wave within flats and triangles. Here, super cycle wave (b) may move above 1,920.18 as in an expanded flat or running triangle.
When the first move of a larger correction subdivides as a multiple (w-x-y), then a combination may be eliminated. Combinations may not have multiples within multiples, because that would increase the number of corrective structures within a multiple beyond three and violate the rule.
A new wave up at super cycle degree must begin with a clear five up on the daily chart (and probably the weekly as well). So far only minor waves 1 and 2 are complete. At 1,227 minor wave 3 would reach 4.236 the length of minor wave 1.
Minute waves i and ii are complete within minor wave 3. The acceleration channel is not working, so a more conservative base channel is drawn about these two waves. Copy it over to the hourly chart. A lower degree second wave correction for minuette wave (ii) should not breach a base channel drawn about a first and second wave one or more degrees higher. The lower pink line should provide support, if this wave count is correct. The daily chart is on a semi-log scale and the hourly chart is on an arithmetic scale. This means channels sit slightly differently between these charts. On the hourly chart, when the channel is drawn in the same way it is now providing resistance to upwards movement. This may be holding price down. When that resistance is breached, then price may accelerate upwards.
There should now be a third wave up of at least five degrees in progress for this bullish wave count. No second wave correction may move beyond the start of its first wave below 1,082.74 within subminuette wave iii. This wave count expects to see a new high above 1,112.19 as minuette wave (iii) must move above minuette wave (i). Momentum should increase as price moves higher.
For the short term, along the way up, for this wave count downwards corrections may find some support at the cyan trend line.
Click chart to enlarge.
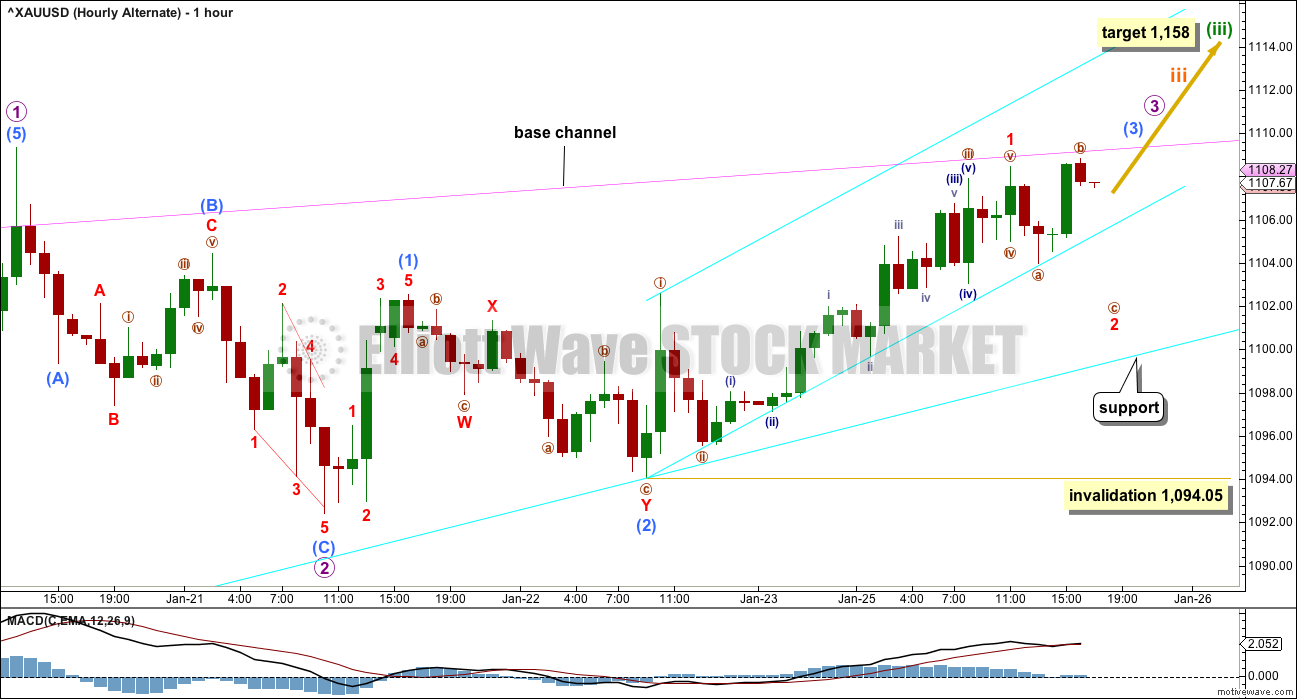
Both hourly charts will see recent movement in the same way today.
At 1,158 minuette wave (iii) would reach 1.618 the length of minuette wave (i). Minuette wave (iii) must move above the end of minuette wave (i) at 1,112.19. It must move far enough above this point to allow for the following correction of minuette wave (iv) to unfold and remain above minuette wave (i) price territory.
At the hourly chart level, minuette wave (iii) should show an increase in upwards momentum beyond that seen for minuette wave (i). That has not been achieved at this stage, so a further increase in upwards momentum would be expected if this wave count is correct.
Minuscule wave 2 may not move beyond the start of minuscule wave 1 below 1,094.05 within submicro wave (3).
TECHNICAL ANALYSIS
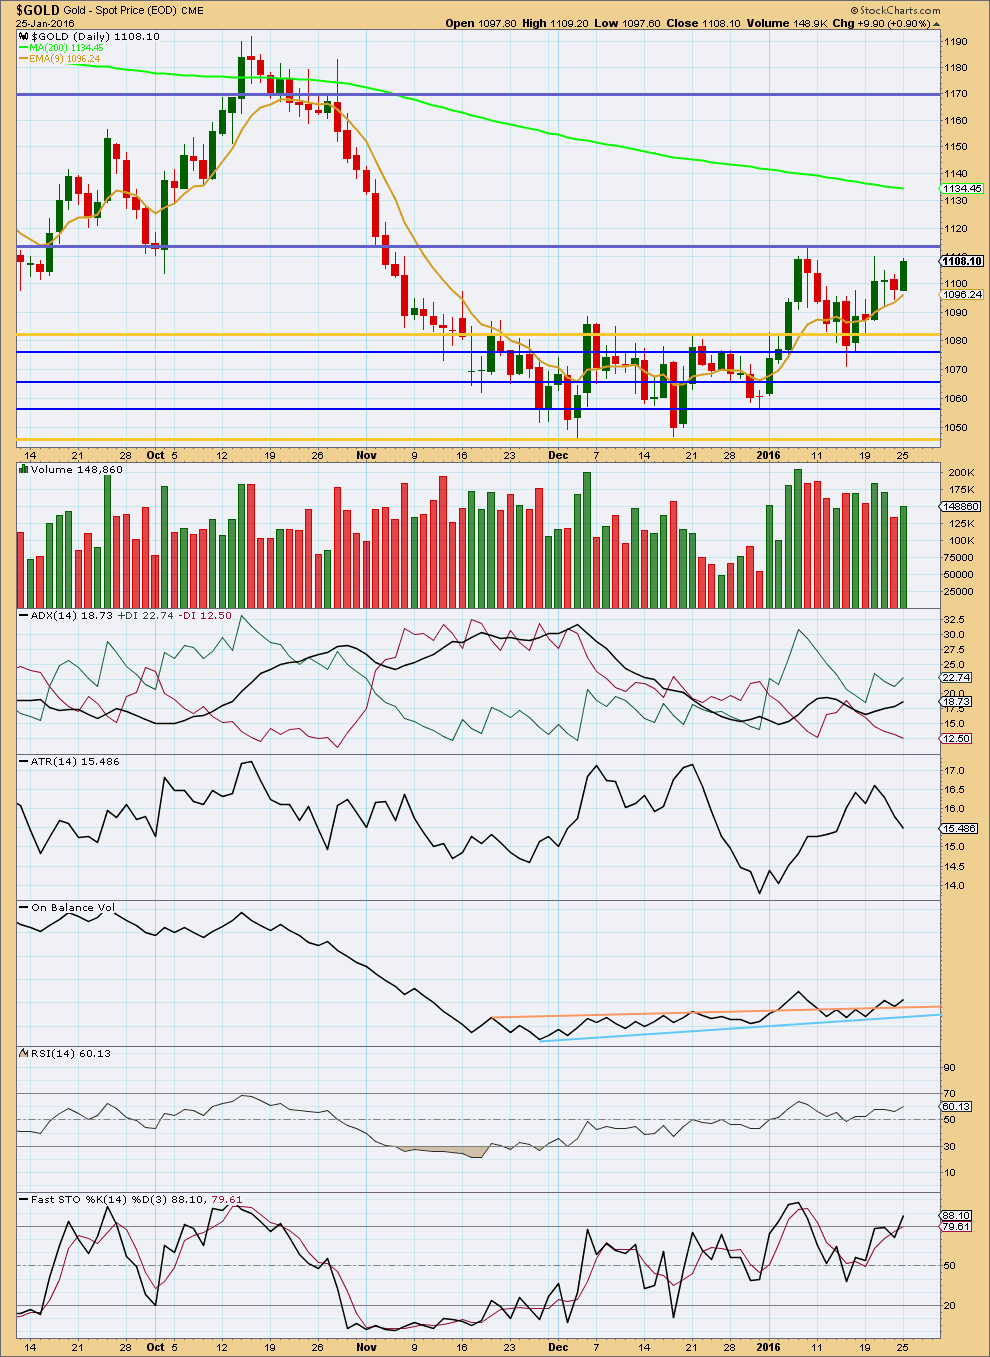
Click chart to enlarge. Chart courtesy of StockCharts.com.
Monday’s upwards day comes on lighter volume which is concerning. The rise in price was not supported by volume. A break above resistance at 1,113 on a day with an increase in volume would be required for confidence in the Elliott wave counts.
ADX still indicates price is in the early stages of an upwards trend. ATR disagrees as it is declining. If ATR turned upwards, then more confidence would be had in the trend. For now a declining range is a concern.
On Balance Volume is at least short term bullish. The break above the peach trend line has been reinforced.: OBV came back down to test the line and it held then OBV has bounced up from there. OBV tends to work best with trend lines. The upwards breakout may precede an upwards breakout from price.
If the market is trending as ADX indicates, then RSI and particularly Stochastics may remain extreme for reasonable periods of time. They are most useful to indicate a correction within a trend, when they show divergence. Today neither exhibit divergence with price.
This analysis is published @ 06:45 p.m. EST.
Looking good. Took some profits on my GLD calls today.
Good to hear took profits.
Up 50%, got to get some of that in the bank. 🙂
Really funny.
And you’ll be laughing all the way to the bank, of course.
The GLD calls are working out significantly better than the GDX calls.
We have an upwards breakout. If today closes with higher volume that would be a very strong bullish signal from Gold.
That cyan channel about this piece of upwards movement on the hourly chart should be useful. Each time price touches the lower edge expect it to bounce up from there. If that channel is breached then a longer deeper correction should be underway.
The trend is up.
For the bear wave count this is micro 3. The middle should be passing or passed now. When micro 3 is far enough above the end of micro 1 then a correction for micro 4 should unfold sideways which may not move back into micro 1 price territory; in other words, more upwards movement for now then a sideways correction that must remain above 1,109.31.
For the bull wave count the next correction is probably a few days away. More upwards movement from here before a sideways correction which again must remain above 1,109.31.
I will be looking to add to my position if price comes down to touch the lower edge of the cyan channel. And I’ll be planning on adding again at the end of the correction… when it arrives.
I will buy miners again at that lower cyan support / correction level as well.
Lara, please excuse my begging the obvious, but what position would you be adding to?
Buy.
Lara I just asked for disclosure purposes. I don’t know what you trade. I do know you can’t trade and index such as XAUUSD. Perhaps you made yourself clear somewhere else and I missed it.
Amazing gold got this high so fast, I’d expect some retracements before hitting 1,125.13 minimum bear target.
Also China has a huge loss of 6.4% at close this morning, which helped gold.
Lara:”More confidence may be had in these expectations with a new high above 1,109.31.”
Gold made new high at 1117.
FED FOMC 2:00 PM EST Wednesday 27th.
Not sure which way that may send gold with Lara’s bear target 7 trading days away.
Personally afraid of going long in gold..:))..
Waiting for a gudd breakout to join the trend..and a clear buy signal from LARA..May be aftr FED…
I don’t give signals, so you’d be waiting a rather long time.
I am not a registered investment advisor, yet. And so I cannot offer trading advice.
What I can do is give you my analysis and tell you what price should do next and how confident I am in that prediction. Invalidation points are where price should not go. I often use them as stops.
In other words, this is an analysis service. Not a signal service.
Its also a great little community where we can share technical analysis and trading techniques.
Took a shot at NEM this morning. Will we see
Looks good. ABX showing strength also. Other components of GDX, such as GG are weak and are holding the index back. Overall, many miners are showing strength.
GDX MACD Daily became a BUY today for the first time since January 7th. That is a strong signal. Bottomed Jan 19th when GDX 5+ year low of 12.40.
Monday night at 10:22 pm EST gold exceeded 1,112.19.
“There should now be subminuette wave iii up. Minuette wave (iii) must move above the end of minuette wave (i) at 1,112.19. It must move far enough above this point to allow for the following correction of minuette wave (iv) to unfold and remain above minuette wave (i) price territory.”
MY guess is Minuette wave (i) ended at 1,113.29 January 8th.
Monday night at 8:07 pm EST a new high above 1,109.31, has already provided more confidence in the analysis expectations.
Nice move today in gold. Let’s keep it going. Not sure if that is a perfect cup and handle on the daily, but it sure looks like a nice pattern to breakout to the upside.
Good trading all,
M