
More upwards movement was expected.
Summary: Both wave counts now expect some sideways / downwards movement for a small fourth wave to most likely end about 1,114. Thereafter, at least one more push up to 1,135 is expected. That is the point where the wave counts would then diverge. If price finds strong resistance and bounces off the cyan trend line, then the main wave count would be more likely. If the cyan trend line on the daily chart is breached, then that would strongly favour the alternate wave count.
New updates to this analysis are in bold.
Last published weekly charts with the bigger picture are here.
MAIN BEAR ELLIOTT WAVE COUNT
Click chart to enlarge.
Gold has been in a bear market since September 2011. There has not yet been confirmation of a change from bear to bull, so at this stage any bull wave count would be trying to pick a low which is not advised. Price remains below the 200 day moving average and below the cyan trend line. The bear market should be expected to be intact until we have technical confirmation of a big trend change.
That technical confirmation would come with a breach of the upper cyan trend line by at least one full daily candlestick above and not touching the line. A new high above 1,191.37 would provide full and final price confirmation.
The final line of resistance (cyan line copied over from weekly charts) is only overshot and not so far properly breached. Simple is best, and the simplest method to confirm a trend change is a trend line.
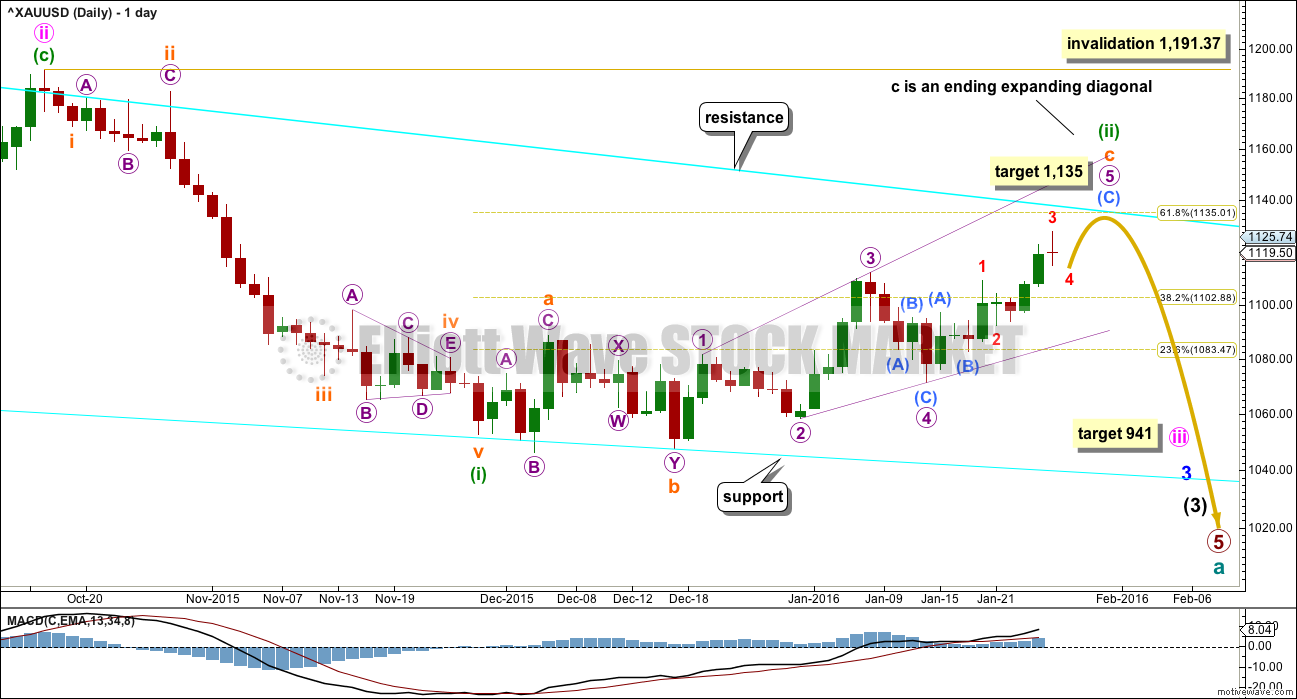
Minute wave ii is a complete zigzag and deep at 0.73 the length of minute wave i.
At 941 minute wave iii would reach 1.618 the length of minute wave i.
Minuette wave (i) is complete.
Minuette wave (ii) looks like a fairly typical expanded flat correction which may end about the 0.618 Fibonacci ratio at 1,135.
Subminuette wave c may be unfolding as an ending expanding diagonal. Ending diagonals require all subwaves to subdivide as zigzags. No second wave correction may move beyond the start of its first wave at 1,082.74 within submicro wave (C).
The diagonal must be expanding because micro wave 3 is longer than micro wave 1, and micro wave 4 is longer than micro wave 2. The trend lines diverge. Micro wave 5 is now slightly longer than micro wave 3. This diagonal structure could end at any stage and meet all Elliott wave rules for it. The daily invalidation point is removed for this reason. At this stage, a new low below 1,109.31 would be a strong bearish indication.
There is still the possibility that minuette wave (ii) could be labelled as complete at the last high. If it was over, then the only structure I can see which would fit is a double combination. But double combinations are sideways structures; they should not have a slope against the trend one degree higher. This correction has a clear slope. For that reason I still do not want to publish this idea because the probability is too low. I will only publish it if price breaks below 1,071.36.
How price behaves when it comes up to touch the cyan trend line will indicate which wave count is correct. For both some resistance should be expected at that line. If the line is properly breached, then this main bearish wave count would reduce in probability.
Click chart to enlarge.
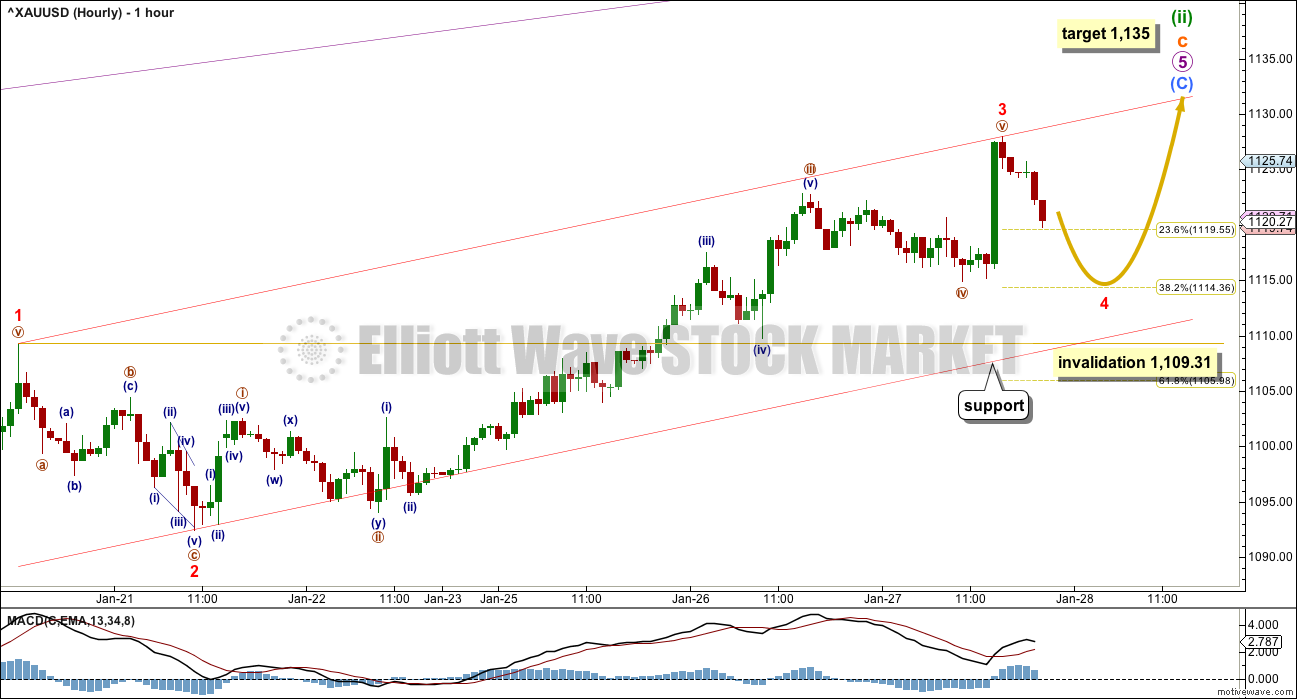
Micro wave 5 has passed equality in length with micro wave 3 and is now longer. All the rules for an ending expanding diagonal are met.
The hourly wave count still expects to see a final fourth wave and fifth wave to complete the structure. If my analysis is wrong, it may be that micro wave 5 could possibly be over already. A new low below 1,109.31 could not be a fourth wave correction, so at that stage the structure would have to be over.
What looks more likely though is minuscule waves 4 and 5 have yet to complete. The target remains 1,135 where minuette wave (ii) would end at the 0.618 Fibonacci ratio of minuette wave (i). These two final waves may take only one to three days at the most to complete.
Minuette wave (ii) should not move substantially above the cyan trend line on the daily chart; the target does not expect this. How price behaves when it gets to that trend line should indicate which wave count is correct. If that line provides strong resistance, that shall favour the bear wave count. If the line is breached, that shall favour the bull wave count.
Minuscule wave 2 was a deep 0.63 zigzag and shows up on the daily chart as one green doji. Minuscule wave 4 may be expected to be shallow, to end about the 0.382 Fibonacci ratio at 1,114. It may be a flat, combination or triangle. It should overall be a sideways movement. I would expect it to be over within the next 24 to 48 hours.
ALTERNATE BULL WAVE COUNT
Click chart to enlarge.
This was published here as a second alternate wave count. I will use it as the only regular alternate bull wave count because it is the only bull wave count to meet all Elliott wave rules.
I want to remind members that last time Gold saw a reasonable upwards movement from 24th July, 2015, to 15th October, 2015, there were many who expected that rise meant the bear market had ended and a new bull market had begun. It turned out that idea was premature: price turned around and made new lows. On 21st August I developed three bullish wave counts, partly in response to a demand from members, and one by one they have all been eliminated.
Now, again, price rises and there is a demand for bullish wave counts.
It is my strong view that this is premature. I will publish this wave count with that strong caveat.
Eventually the market will change from bear to bull, and when that change is confirmed that is the time to have confidence in a bull wave count. That time is not now.
Price remains below the 200 day moving average. Price has made a series of lower highs and lower lows down to the last recent low. There is not a clear five up on the daily chart. Price remains below the bear market trend line. While price remains below that line this wave count will be an alternate and comes with a strong warning that it is premature.
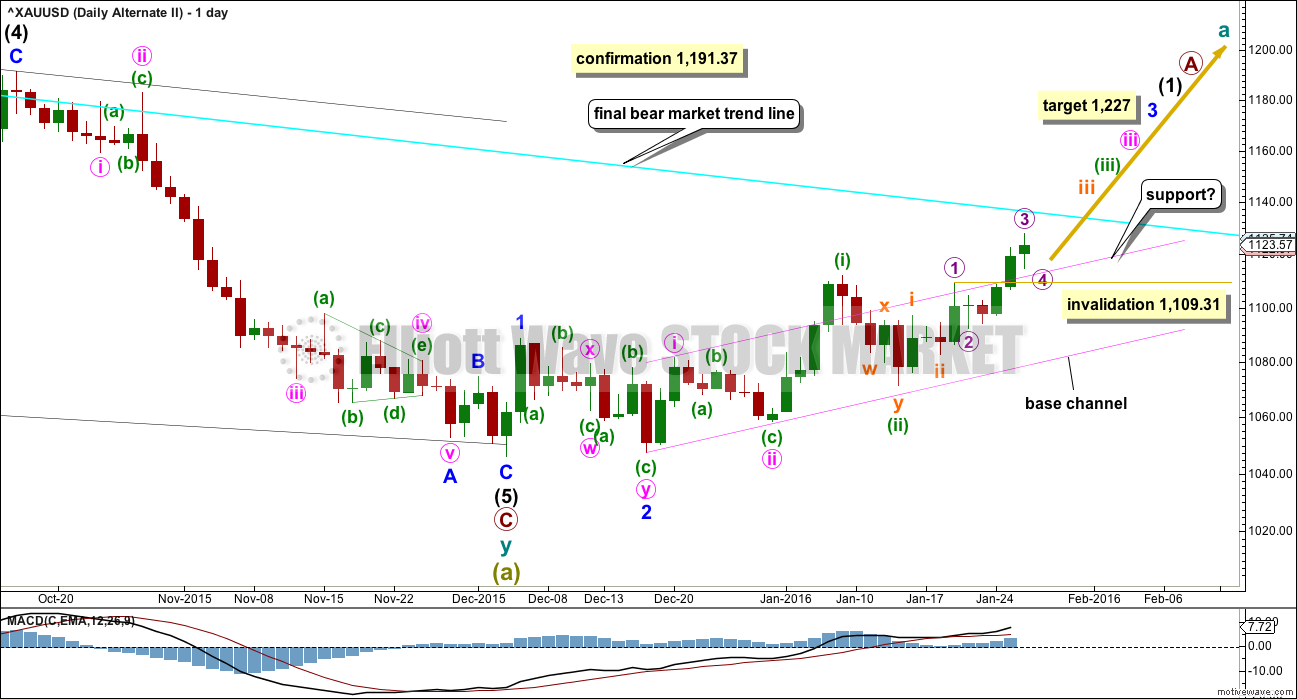
Downwards movement from the all time high for this bull wave count is seen as a big double zigzag which would most likely be complete at super cycle degree for an A wave.
When an A wave subdivides as a three, then the larger structure may be either a flat or triangle. The B wave may make a new price extreme beyond the start of the A wave within flats and triangles. Here, super cycle wave (b) may move above 1,920.18 as in an expanded flat or running triangle.
When the first move of a larger correction subdivides as a multiple (w-x-y), then a combination may be eliminated. Combinations may not have multiples within multiples, because that would increase the number of corrective structures within a multiple beyond three and violate the rule.
A new wave up at super cycle degree must begin with a clear five up on the daily chart (and probably the weekly as well). So far only minor waves 1 and 2 are complete. At 1,227 minor wave 3 would reach 4.236 the length of minor wave 1.
Minute waves i and ii are complete within minor wave 3. The acceleration channel is not working, so a more conservative base channel is drawn about these two waves. Copy it over to the hourly chart. A lower degree second wave correction for minuette wave (ii) should not breach a base channel drawn about a first and second wave one or more degrees higher.
The daily chart is on a semi-log scale and the hourly chart is on an arithmetic scale. This means channels sit slightly differently between these charts. The base channel has been breached now by upwards movement on both charts. The upper edge should now provide support.
Micro wave 3 may now be a compete impulse; the structure on the hourly chart is complete. Micro wave 4 may not move into micro wave 1 price territory below 1,109.31.
Gold often exhibits swift strong fifth waves, particularly the fifth waves to end its third wave impulses. Be aware of this tendency, because it could mean that any one of or more than one of micro wave 5, subminuette wave v, minuette wave (v) and minute wave v could be very strong upwards movements. If this is the case, then for this wave count it would take price comfortably above the final bear market trend line. If that happens, then this wave count would be the preferred wave count.
Click chart to enlarge.
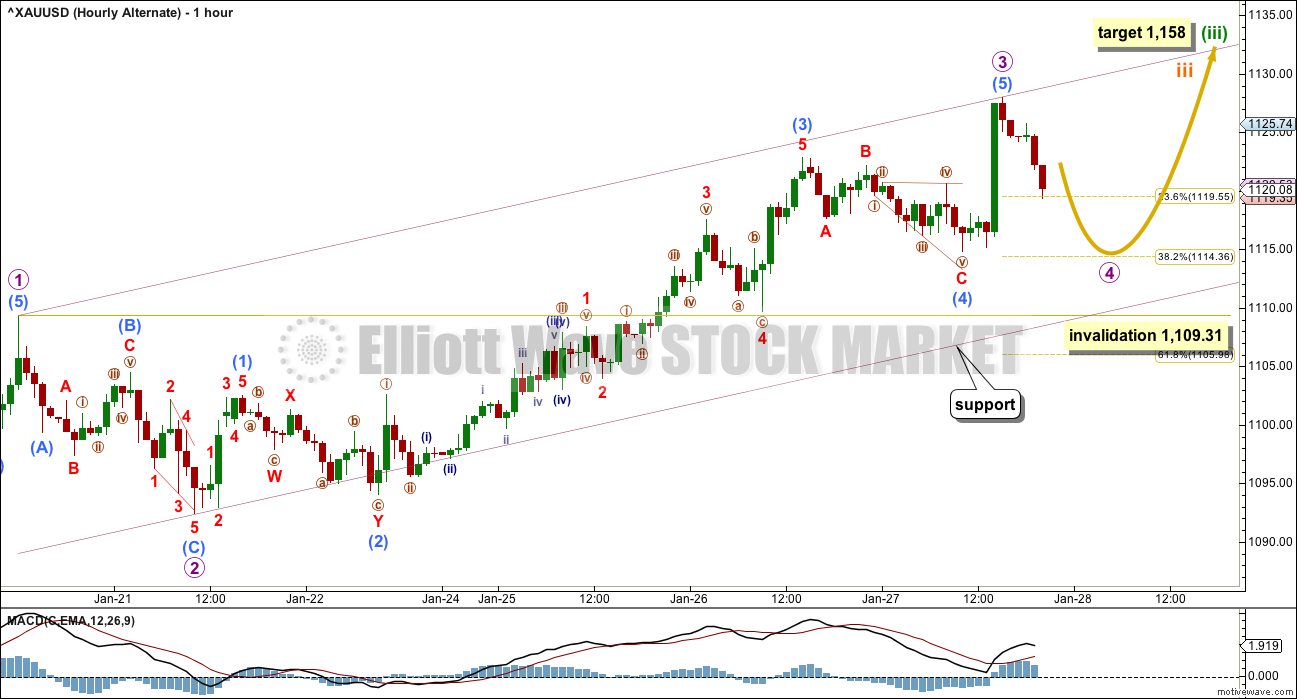
Both hourly charts are labelled in the same way, but this alternate has all labelling moved up two degrees.
Micro wave 3 may now be complete. It did not reach the target at 1,135, but the structure is complete. Micro wave 3 has no Fibonacci ratio to micro wave 1, but it is longer. This means that there is no limit to the length of micro wave 5 when it arrives.
Ratios within micro wave 3 are: submicro wave (3) is 2.19 longer than 2.618 the length of submicro wave (1), and there is no Fibonacci ratio between submicro wave (5) and either of (3) or (1).
Micro wave 4 is likely to be shallow, so the most likely target for it to end is the 0.382 Fibonacci ratio at 1,114. This would also see it end within the price territory of the fourth wave of one lesser degree; submicro wave (4) has its range from 1,112.81 to 1,114.84.
Draw a channel about the middle of this third wave. Draw the first trend line from the ends of micro waves 1 to 3, then place a parallel copy on the end of micro wave 2. If micro wave 4 is time consuming enough, then expect it to find support at the lower edge of that channel.
Micro wave 4 may not move into micro wave 1 price territory below 1,109.31.
TECHNICAL ANALYSIS
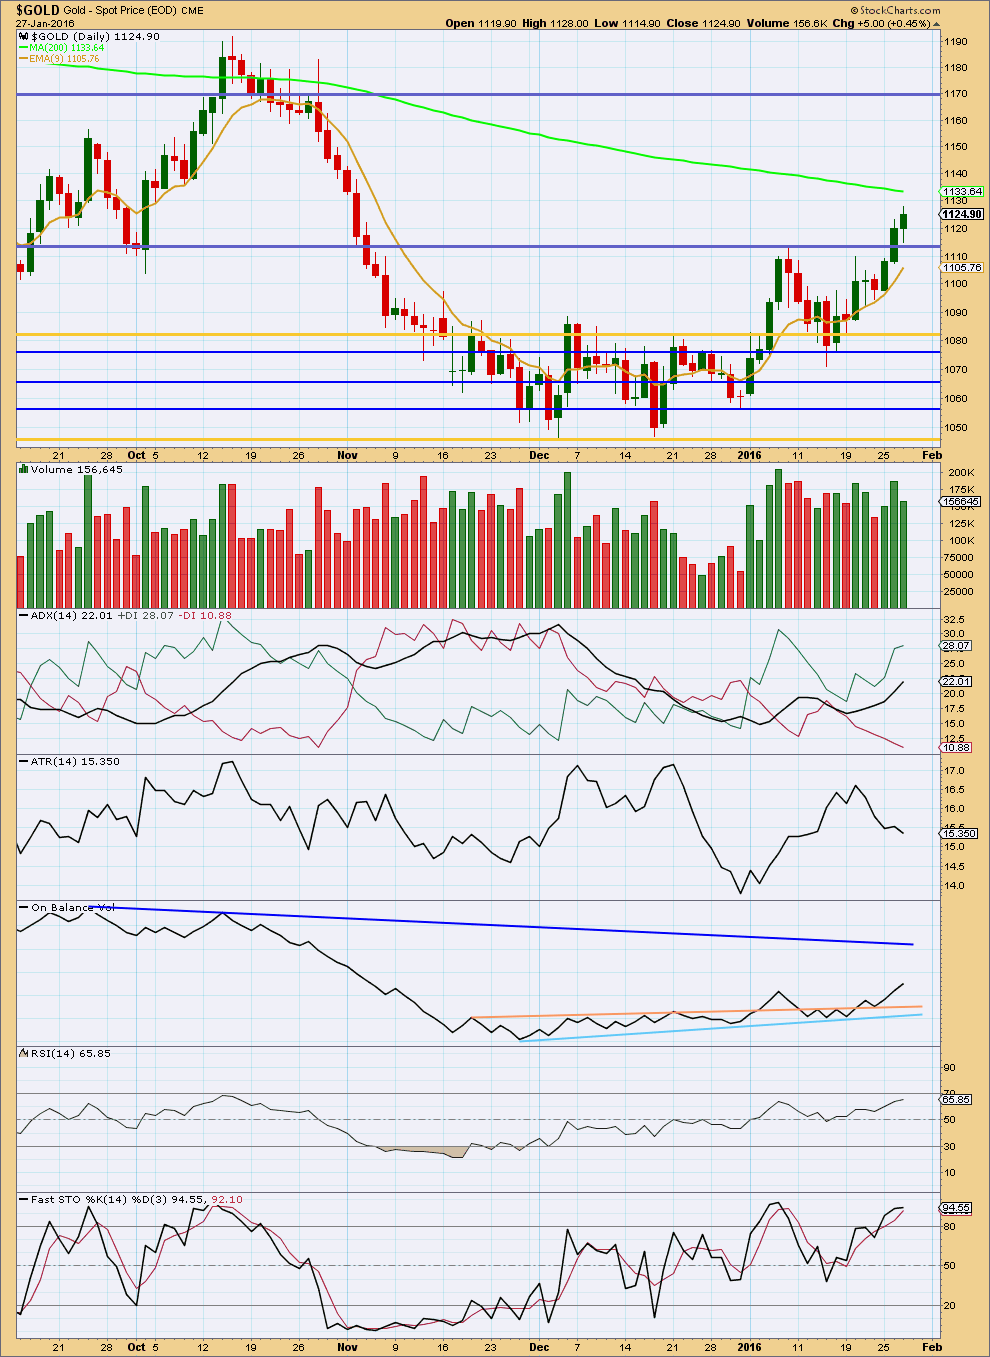
Click chart to enlarge. Chart courtesy of StockCharts.com.
Price moved higher for Wednesday but did not show an increase in volume. This is concerning for the alternate Elliott wave count, but not so much for the main Elliott wave count.
Now that price has broken above resistance at 1,113, this may now provide support. The next line of resistance for price may be the 200 day SMA.
ADX still indicates there is a trend, and it is up. ATR disagrees; it is declining. Again, for the main Elliott wave count this is not so much of a concern as that wave count expects upwards movement is the end of a correction for a second wave. But for the alternate wave count this is a concern. If Gold is in the early stages of a third wave up at several degrees, then ATR should be increasing as well as volume.
On Balance Volume remains bullish. A new dark blue trend line is drawn which may be the next line of resistance for OBV.
Neither RSI nor Stochastics are overbought and neither show divergence with price.
This analysis is published @ 09:28 p.m. EST.
At 11:30 am I estimated .618 retrace target of 1113.55 which is .618 the difference between the 9:14 am low of 1111.41 and 10:29 am market hours high of 1117.02 .
At 3:56 pm gold hit my 1113.55 retrace target and 3:57 pm dropped to market hours low of 1113.38.
I bought GDX at 3:59 pm at 13.85 after Lara’s comment that target 1135 still in play for both wave counts.
For the main wave count (bear):
Minuscule wave 4 should now be over. It’s reached down to almost touch the channel and bounced up a little from there. My concern here is there is no alternation between minuscule wave 4 and 2. If minuscule wave 4 continued sideways for another day as a triangle or combination that would provide alternation. Sideways, not lower movement, would fit that. So that is a possibility.
When 4 is over then 5 up should unfold, make a new high above 3 at 1,127.94 to avoid a truncation, and come up to touch the cyan line on the daily chart about 1,135.
And for the main count, that should be the end of the upwards trend.
For the alternate (bull) count:
I am considering moving the middle of the third wave down one degree. Unless a swift strong fifth wave takes off, I notice that on the hourly chart so far this third wave is weaker (MACD) than the first. That doesn’t actually look right.
So today I will have to move the invalidation / confirmation point lower to the start of micro wave 3 for the alternate at 1,092.40.
The lower edge of the channel still should provide support, it is about where a base channel for micro waves 1 and 2 would be and a lower degree correction for submicro (2) shouldn’t breach that line.
This resolves the problem of a lack of alternation between a possible fourth wave and its second wave counterpart; if they’re both second waves they’re both zigzags, no problem.
Conclusion: both wave counts see the correction as either over here or maybe to move sideways for another day or so. Both wave counts then expect more upwards movement. How high the next wave goes is important; the main expects it to stop about the cyan line, the alternate expects it to slice through easily.
Lara,
If we break 1109.31, can chart pattern be consistent with a diagonal and not obviate further new highs?
Lara sounded very concerned several times in the analysis if gold goes below 1109.31 so further highs would be out of the forecast.
I’d be looking for DUST and not GDX if that happened.
An ending diagonal to end an ending diagonal… it is technically possible, but the probability is so low.
What would be more likely would be my analysis of submicro wave (C) would be wrong and downwards movement would be a new bear trend.
For the bull though I have considered that maybe if my analysis is wrong there it may be that this is yet another first and second wave, that the middle of a third wave has still not passed.
And so for the bull I really need to have the final invalidation point at 1,092.40.
Gary Wagner EW video thinks gold could move up to 1,160.
http://thegoldforecast.com/video/gold-traders-take-notice-fed-sits-lazily-and-speaks
If history repeats, it may be important to know the order that these assets bottomed during the last major bear…
Gold/GDX, then Oil, then SPX
If the main count pays out, Gold and Oil may both turn down within the next 48 hours. Coincidence or not?
Gold one to three days at most to 1,135 for Bear. Unless invalidated.
Excellent. Loving the main count Lara. Gold will probably extend above just to fool us like it always does….
Have a great night,
Ben
Lara your 2016 forecasting is worth it’s weight in Gold, thank you.
Even the US Fed agrees with it.
Thanks Richard!
Yes, so far so good.