
Yesterday’s analysis expected sideways / downwards movement to a short term target about 1,114.
Price has moved lower as expected to reach to 1,111.76 so far.
Summary: The correction should be over here and should be followed by upwards movement to new highs. The main wave count has more support from classic technical analysis; a final fifth wave up to 1,135 should see price find strong resistance at the cyan trend line on the daily chart. The alternate expects upwards movement to be very strong; if this wave count is correct, the cyan line should be breached clearly within a few days.
New updates to this analysis are in bold.
Last published weekly charts with the bigger picture are here.
MAIN BEAR ELLIOTT WAVE COUNT
Click chart to enlarge.
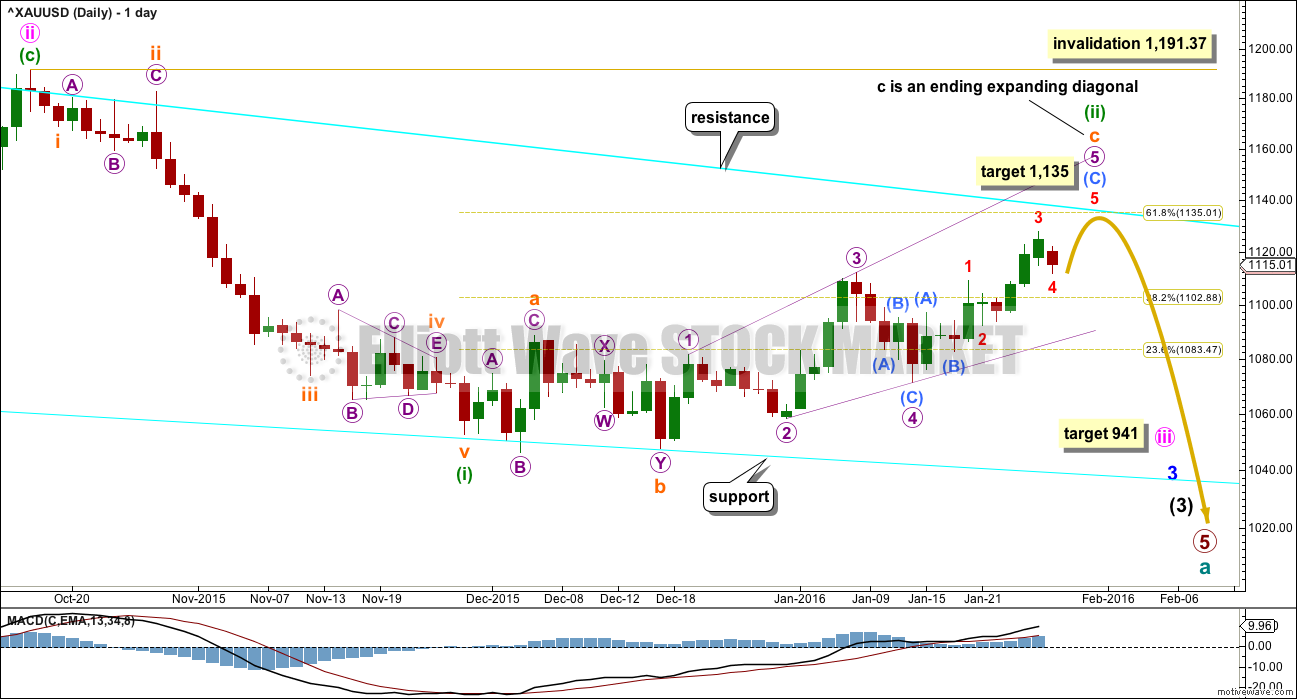
Gold has been in a bear market since September 2011. There has not yet been confirmation of a change from bear to bull, so at this stage any bull wave count would be trying to pick a low which is not advised. Price remains below the 200 day moving average and below the cyan trend line. The bear market should be expected to be intact until we have technical confirmation of a big trend change.
That technical confirmation would come with a breach of the upper cyan trend line by at least one full daily candlestick above and not touching the line. A new high above 1,191.37 would provide full and final price confirmation.
The final line of resistance (cyan line copied over from weekly charts) is only overshot and not so far properly breached. Simple is best, and the simplest method to confirm a trend change is a trend line.
Minute wave ii is a complete zigzag and deep at 0.73 the length of minute wave i.
At 941 minute wave iii would reach 1.618 the length of minute wave i.
Minuette wave (i) is complete.
Minuette wave (ii) looks like a fairly typical expanded flat correction which may end about the 0.618 Fibonacci ratio at 1,135.
Subminuette wave c may be unfolding as an ending expanding diagonal. Ending diagonals require all subwaves to subdivide as zigzags. No second wave correction may move beyond the start of its first wave at 1,082.74 within submicro wave (C).
The diagonal must be expanding because micro wave 3 is longer than micro wave 1, and micro wave 4 is longer than micro wave 2. The trend lines diverge. Micro wave 5 is now slightly longer than micro wave 3. This diagonal structure could end at any stage and meet all Elliott wave rules for it. The daily invalidation point is removed for this reason. At this stage, a new low below 1,092.4 would be a strong bearish indication.
How price behaves when it comes up to touch the cyan trend line will indicate which wave count is correct. For both some resistance should be expected at that line. If the line is properly breached, then this main bearish wave count would reduce in probability.
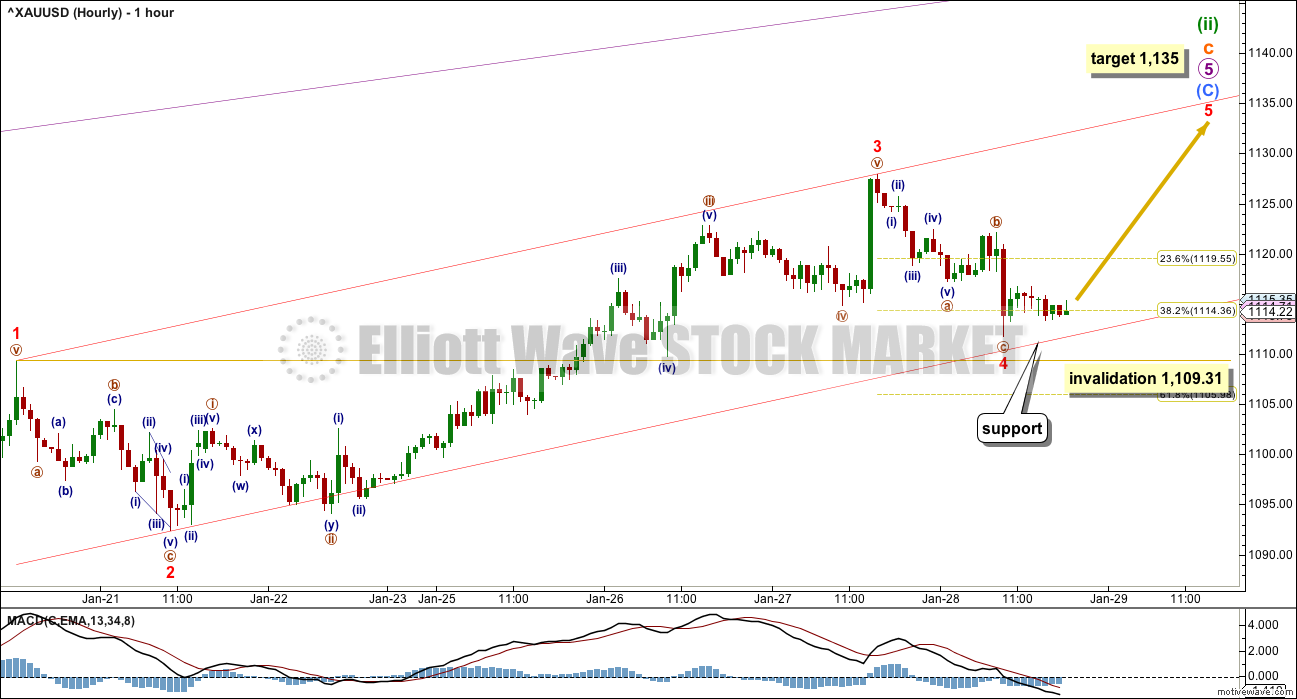
Click chart to enlarge.
Micro wave 5 has passed equality in length with micro wave 3 and is now longer. All the rules for an ending expanding diagonal are met.
The hourly wave count still expects to see a final fifth wave to complete the structure. If my analysis is wrong, it may be that micro wave 5 could possibly be over already. The alternate wave count would now be invalidated with a new low below 1,092.4, so at that stage the probability of this main wave count would further increase and a new downwards trend may have begun.
The target remains 1,135 where minuette wave (ii) would end at the 0.618 Fibonacci ratio of minuette wave (i). The final wave up of minuscule wave 5 may complete in one to two days.
Minuette wave (ii) should not move substantially above the cyan trend line on the daily chart; the target does not expect this. How price behaves when it gets to that trend line should indicate which wave count is correct. If that line provides strong resistance, that shall favour the bear wave count. If the line is breached, that shall favour the bull wave count.
There is slight concern that minuscule wave 4 does not exhibit alternation in structure with minuscule wave 2 today; so far they are both zigzags. This could be resolved if minuscule wave 4 is not over as labelled and if it continues further sideways to complete a flat, combination or triangle.
The red channel is drawn using Elliott’s technique about the impulse of submicro wave (C). Draw the first trend line from the ends of minuscule waves 1 to 3, then place a parallel copy on the end of minuscule wave 2. So far minuscule wave 4 is contained within the channel. If it continues further, it may find support at the lower edge.
ALTERNATE BULL WAVE COUNT
Click chart to enlarge.
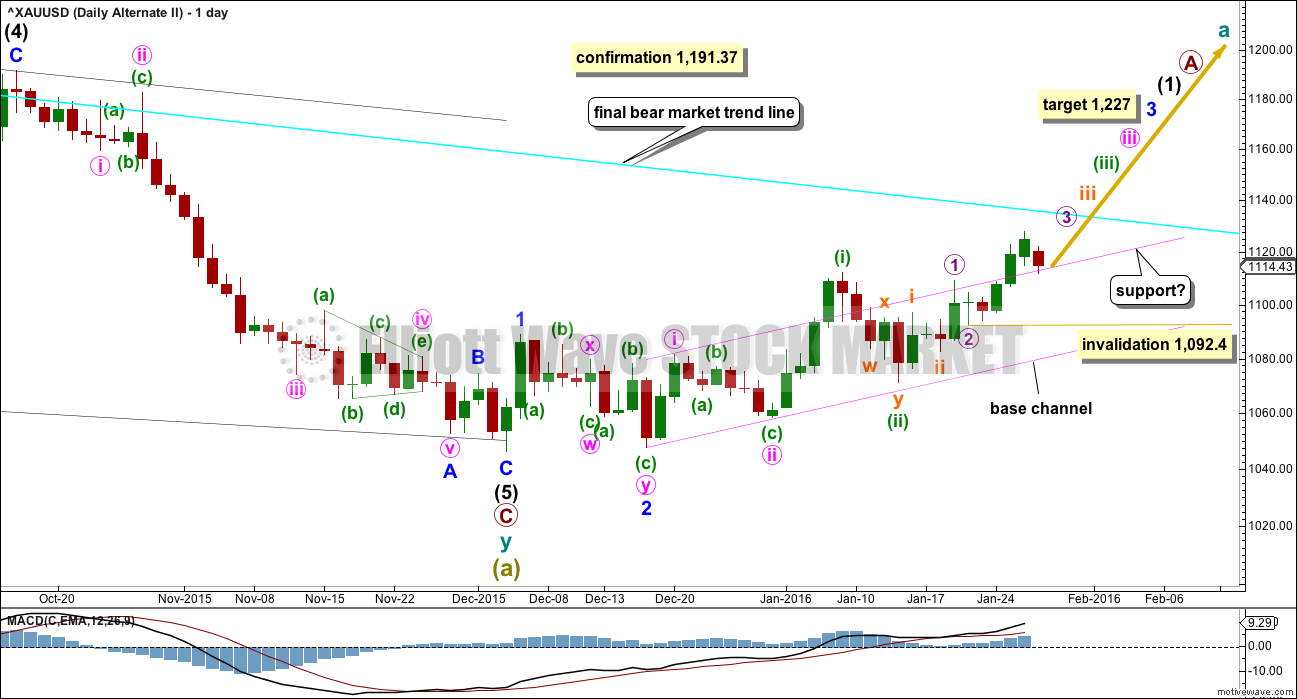
This was published here as a second alternate wave count. I will use it as the only regular alternate bull wave count because it is the only bull wave count to meet all Elliott wave rules.
I want to remind members that last time Gold saw a reasonable upwards movement from 24th July, 2015, to 15th October, 2015, there were many who expected that rise meant the bear market had ended and a new bull market had begun. It turned out that idea was premature: price turned around and made new lows. On 21st August I developed three bullish wave counts, partly in response to a demand from members, and one by one they have all been eliminated.
Now, again, price rises and there is a demand for bullish wave counts.
It is my strong view that this is premature. I will publish this wave count with that strong caveat.
Eventually the market will change from bear to bull, and when that change is confirmed that is the time to have confidence in a bull wave count. That time is not now.
Price remains below the 200 day moving average. Price has made a series of lower highs and lower lows down to the last recent low. There is not a clear five up on the daily chart. Price remains below the bear market trend line. While price remains below that line this wave count will be an alternate and comes with a strong warning that it is premature.
Downwards movement from the all time high for this bull wave count is seen as a big double zigzag which would most likely be complete at super cycle degree for an A wave.
When an A wave subdivides as a three, then the larger structure may be either a flat or triangle. The B wave may make a new price extreme beyond the start of the A wave within flats and triangles. Here, super cycle wave (b) may move above 1,920.18 as in an expanded flat or running triangle.
When the first move of a larger correction subdivides as a multiple (w-x-y), then a combination may be eliminated. Combinations may not have multiples within multiples, because that would increase the number of corrective structures within a multiple beyond three and violate the rule.
A new wave up at super cycle degree must begin with a clear five up on the daily chart (and probably the weekly as well). So far only minor waves 1 and 2 are complete. At 1,227 minor wave 3 would reach 4.236 the length of minor wave 1.
Minute waves i and ii are complete within minor wave 3. The acceleration channel is not working, so a more conservative base channel is drawn about these two waves. Copy it over to the hourly chart. A lower degree second wave correction for minuette wave (ii) should not breach a base channel drawn about a first and second wave one or more degrees higher.
The daily chart is on a semi-log scale and the hourly chart is on an arithmetic scale. This means channels sit slightly differently between these charts. The base channel has been breached now by upwards movement on both charts. The base channel on the hourly chart on an arithmetic scale is today perfectly showing where downwards movement is finding support. It may continue to do so.
I am moving the degree of labelling within micro wave 3 down one degree today. Instead of the impulse for micro wave 3 being over, this is more likely just another first wave for submicro wave (1). I am making this change for two reasons: micro wave 3 has not yet shown stronger momentum than micro wave 1 and the current correction is a zigzag which is unlikely to be a fourth wave counterpart to the zigzag of micro wave 2.
Gold often exhibits swift strong fifth waves, particularly the fifth waves to end its third wave impulses. Be aware of this tendency, because it could mean that any one of or more than one of micro wave 5, subminuette wave v, minuette wave (v) and minute wave v could be very strong upwards movements. If this is the case, then for this wave count it would take price comfortably above the final bear market trend line. If that happens, then this wave count would be the preferred wave count.
Click chart to enlarge.
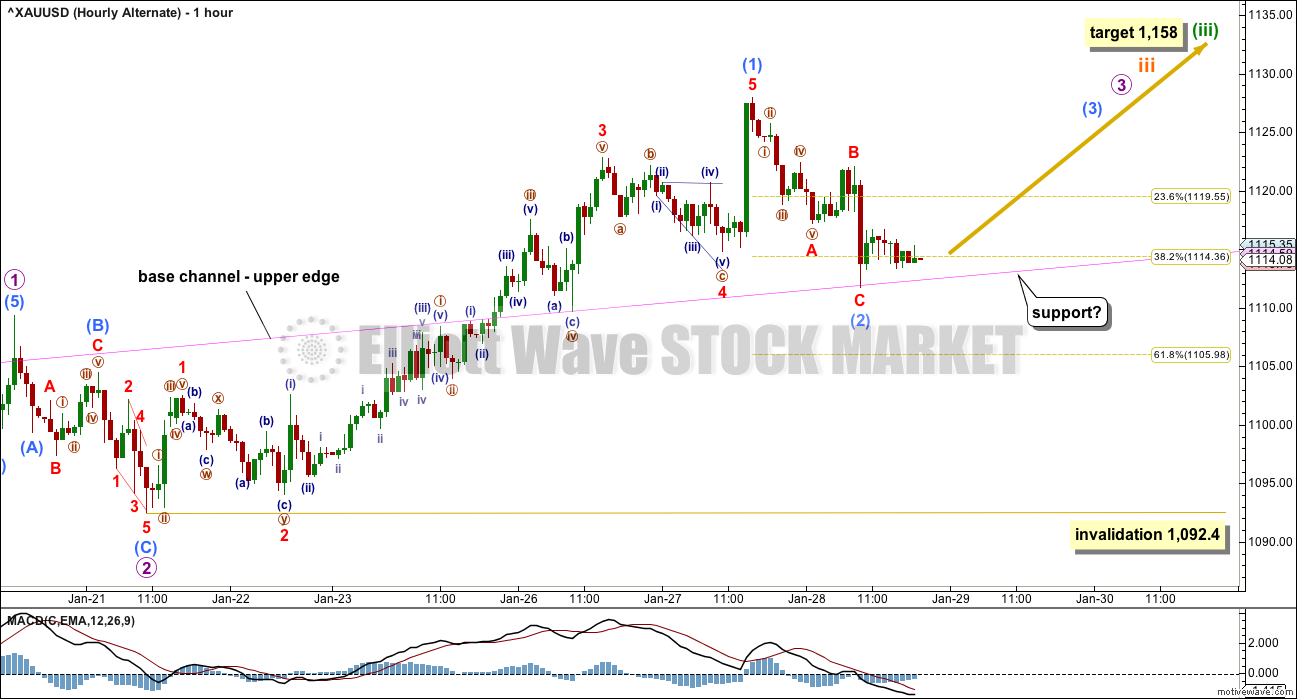
Both hourly charts are labelled in the same way, but this alternate has all labelling moved up two degrees.
Micro wave 3 must subdivide as an impulse. Within micro wave 3, only submicro wave (1) may be complete. Upwards momentum at or towards the end of micro wave 3 should show a clear increase beyond that seen for micro wave 1, but it has not done this so far.
The base channel is copied over to the hourly chart today. The upper edge is providing support. This is likely to continue.
The target for minuette wave (iii) is the same. At 1,158 minuette wave (iii) would reach 1.618 the length of minuette wave (i). Along the way up to the end of minuette wave (iii), there should be two smaller fourth wave corrections yet to unfold, for micro wave 4 and subminuette wave iv. Both should be relatively brief, lasting only one or two days each.
Submicro wave (2) may not move beyond the start of submicro wave (1) below 1,092.4.
TECHNICAL ANALYSIS
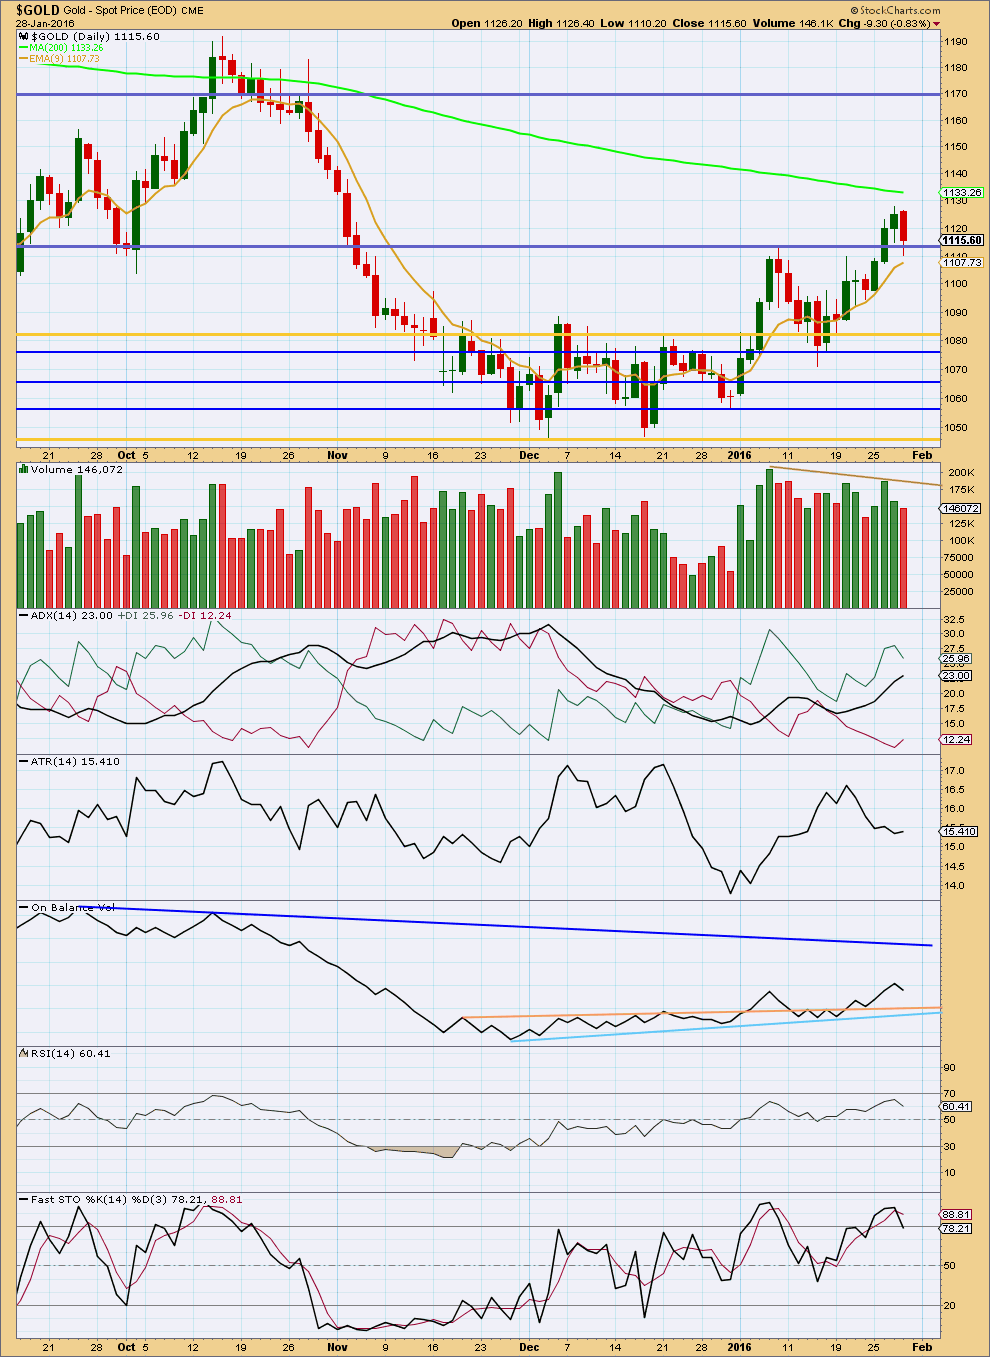
Click chart to enlarge. Chart courtesy of StockCharts.com.
Downwards movement comes on a day with lighter volume. The fall in price is not supported by volume. This is likely a correction against the current upwards trend.
Overall, volume is declining from the high of 7th January (a high in volume) as indicated by the trend line on volume bars. This supports the main wave count over the alternate. If a correction for a second wave is ending, then volume should be overall declining. For the alternate wave count, if a third wave up at several degrees is unfolding, then volume should be supporting the rise in price. It is not.
There is some divergence between price and Stochastics today, between the two highs in price on 8th and 27th January. Price has moved to make new highs but Stochastics has not. This indicates weakness in price and supports the main wave count over the alternate.
ADX still indicates an upwards trend is in place but ATR still disagrees. If this upwards movement is the end of a diagonal to complete a correction, then this divergence between ADX and ATR makes sense; upwards movement is a short term trend to end a correction only. Again, this supports the main wave count over the alternate.
However, there is no divergence between price and RSI. RSI indicates there is no weakness in price. On balance I would give more weight to RSI than Stochastics in terms of divergence with price.
This analysis is published @ 09:39 p.m. EST.
Good Afternoon,
Attached is my updated COT analysis. I took profits on all NUGT today, 2/3 of my GDX Calls, and 2/3 of my GLD calls. I kept a small position in case this is favoring the bull.
As I have mentioned in the past, my goal with this trade was to test out my method (which I have followed for the last 2 years), combined with other TA work and EW. I wanted to make $5,000 on the trade, and I observe that a trade like this can be made about 6 times per year based on the cycles in the chart. So far, I have closed $4,000 in profit, and left $500 on the table until early next week. So not too bad.
I will do more homework over the weekend, but here are the lessons I learned. First, the GLD calls by far were the best performing. The GDX calls were the least performing. Second, I averaged in too soon, so that when GDX made that drop into the 12’s, I was mostly in position and had little room to average down to a better overall cost. I will focus on better entries next time around.
Looking ahead, I pulled the trigger on the sells because my profit target had been hit 2 days ago, and after reading Lara’s analysis today, and observing the blue line at 60K while GDX is pushing the limits on a 5-wave move (C-wave or 1st wave), I felt it was time to exit most of the positions.
My reward is a 100 oz. silver bar being delivered next week, and the remainder sitting in cash waiting for the top of the next blue line in combo with EW top.
Enjoy the weekend everyone.
MTLSD, Your trade is very interesting and the results are fabulous.
Thanks for sharing the gold adventure with the pot of gold victory at the end.
Congratulations.
I think that when oil turns back down from it’s temporary up wave this week then gold will also turn back down in the bear count again.
The main wave count will now see minuette wave (ii) as complete at the high of 1,127 on Jan 27th.
And so the main count now expects to see very strong downwards movement as a big third wave down begins.
The alternate wave count now expects to see a strong third wave up begin.
So they now diverge very strongly.
Classic technical analysis will be really important here to try and figure out which scenario is more likely. So far (this doesn’t include data for this session, it’s not yet available) the main count is slightly more favoured. Volume overall declining to the last high is a concern.
The price point to differentiate the two counts is first at 1,092.4. A new low below 1,092.4 invalidates the alternate and confirms the main.
To the upside I need to take more time to look at the structure of submicro (C) before I can be confident in saying a new high above 1,127.95 would invalidate the main and confirm the alternate.
What would confirm the alternate, and will probably remain my bottom line there, is a breach of the cyan line on the daily chart.
But the biggest thing to remember is the alternate is a very bullish count and we just do not have any technical confirmation that the bear market for Gold has ended.
Personally I am somewhat bullish as NUGT, GLD, KGC, ABX, EGO ,GDXJ AUY and other mining stocks like CDE all showed strength today . Although gold was not up that much. Kind of reminds me of early 2001 when gold last bottomed at around $255 per ounce and began its historic rise to $1920 in 2011, So, Iightened up a bit today but still holding long April Gold Futures over the weekend. The Alternate still has a good chance, IMHO.
Yes bull count still in the game. Good you took some profits and lightened up over this perhaps pivotal weekend.
I did sell my GDX.
I also bought a little DUST at the day low.
Agree with Stephen, I think we are still in bear market but short term is up. Gdx/Nugt are bullish and I don’t see how we turn down here.
I think that the main count is still valid if we consider minuette wave (ii) finished at the yesterday’s max.
The hourly count, putting wave 3 circle red on the previous swing, seems fit well.
Main just needs new hourly wave count.
Sorry …. “the other yesterday max”
Is gold more likely to hit 1,135 area today or Monday.
“The target remains 1,135 for minuette wave (ii).
The final wave up of minuscule wave 5 may complete in one to two days.”
Any wave counts?
Perhaps Lara may provide clarity before the close.
I bought GDX at Thursday close and already sold at a profit.
GDX peaked at 1:15 Thursday then dropped down to the close.
I prefer to take a profit when available then maybe buy it back cheaper the next day.
It’s possible that the high is in for gold and Minuette wave (ii) is complete. The move down from the top can be seen as a 1-2 1-2, with a sharp 3rd wave down coming soon.
A revise main hourly wave count is in order here. IMO
Dreamer
What you think of this wave count????
Looks a bit sloppy. There’s a large truncated 5th wave near the top at the end of the B wave and a triple zigzag, w-x-y-x-z, for the entire count looks very odd.
That said, I think one more move down to around 1,030 is very possible to complete a slightly different version of the Alternate ending diagonal count.
Thanks. I did not know of w-x-y-x-z is triple zz.
It’s not a valid wave count. It appears to be counting a C wave within a zigzag as a triple zigzag.
C waves in zigzags may only be five wave structures; impulses or ending diagonals.
Always be suspicious of any wave count with w-x-y-x-z. It’s the most commonly used structure for people new to Elliott wave which is used incorrectly. Triples are actually very rare.
Lara please provide some clearity on OIL
It’s doing exactly as the wave count expected. Price moved higher for a fourth wave zigzag.
Now a channel can be drawn around that upwards move. When its breached by downwards movement then it may be over.
Ok.thnk u
http://blog.smartmoneytrackerpremium.com/2016/01/attack-on-gold-good-or-bad.html
Interesting video. Thanks
Guys I don’t see that main hourly is invalidated. Lara removed the 1109.31 invalidation:
“This diagonal structure could end at any stage and meet all Elliott wave rules for it. The daily invalidation point is removed for this reason. At this stage, a new low below 1,092.4 would be a strong bearish indication.”
“The hourly wave count still expects to see a final fifth wave to complete the structure.”
delete that comment ^^ !
This is exact time and why main hourly invalidated down Thursday night.
Gold actually bounced even higher up shortly afterwards.
Dollar soars after BOJ shocks market with move to negative interest rates
Jan 29, 2016 1:28 a.m. ET
http://www.marketwatch.com/story/dollar-soars-after-boj-shocks-market-with-move-to-negative-interest-rates-2016-01-29
This BOJ news time of 10:38 pm EST triggered a change in gold which by 10:52 pm EST dropped to 1,108.61.
As confirmed with pmbull.com gold price
Main hourly wave was invalidated below 1,109.31 at 10:52 pm with a gold low of 1,108.61. Matt noted this below.
Lara, the main hourly has been invalidated. Is the only option now that the correction is over? If you are awake, a quick update would be much appreciated. Thanks.
Gold seems to be snapping back as expected, but the broken invalidation point has made the movement more difficult to interpret.
Just a final thought on current movement – I believe that this is/was still a 4th wave, within a final push up, but the first wave perhaps ended at a lower point. As you commented, a diagonal within a diagonal seems too unlikely.
WHEN IN DOUBT Take the high road. Double bottom dec. full moon is optimistic outcome.
Yes.
And yes I will.