
Downwards movement breached the invalidation point on the main hourly Elliott wave chart but not the alternate.
Summary: There has been no technical confirmation of a trend change for Gold from bear to bull. The bear wave count now expects a big third wave down to begin, and confidence that it is underway would come with a new low below 1,071.36. The alternate bull wave count expects a third wave up is underway, and for confidence this wave count requires a breach of the final bear market trend line on the daily chart.
New updates to this analysis are in bold.
Last published weekly charts with the bigger picture are here.
MAIN BEAR ELLIOTT WAVE COUNT
Click chart to enlarge.
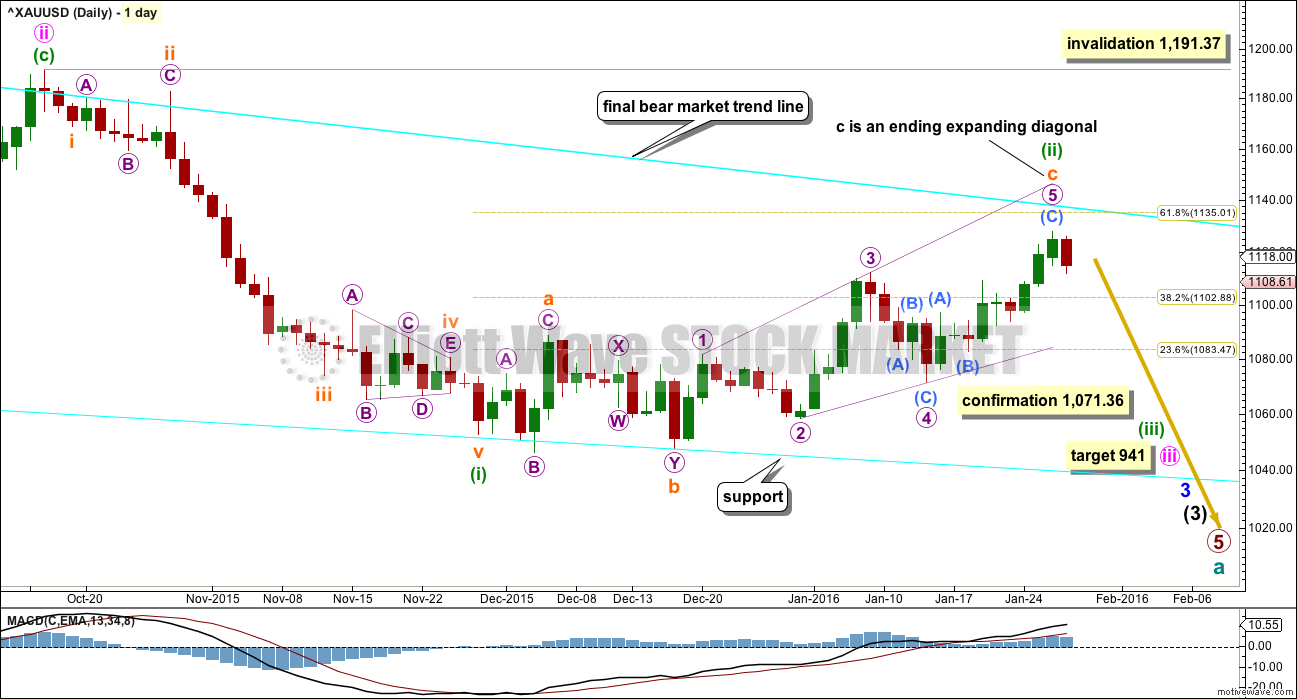
Gold has been in a bear market since September 2011. There has not yet been confirmation of a change from bear to bull, so at this stage any bull wave count would be trying to pick a low which is not advised. Price remains below the 200 day moving average and below the cyan trend line. The bear market should be expected to be intact until we have technical confirmation of a big trend change.
That technical confirmation would come with a breach of the upper cyan trend line by at least one full daily candlestick above and not touching the line. A new high above 1,191.37 would provide full and final price confirmation.
The final line of resistance (cyan line copied over from weekly charts) is only overshot and not so far properly breached. Simple is best, and the simplest method to confirm a trend change is a trend line.
Minute wave ii is a complete zigzag and deep at 0.73 the length of minute wave i.
At 941 minute wave iii would reach 1.618 the length of minute wave i.
Minuette wave (i) is complete.
Minuette wave (ii) looks like a fairly typical expanded flat correction which may end about the 0.618 Fibonacci ratio at 1,135.
Subminuette wave c may be a complete ending contracting diagonal. The first hourly chart looks at a complete structure, and to consider all possibilities the second hourly chart below for the bear wave count looks at a possible incomplete structure.
If price continues higher, it should find resistance at the final bear market trend line. If that line is breached, it would indicate a trend change from bear to bull. At that stage, the bull wave count would be preferred.
MAIN BEAR HOURLY CHART
Click chart to enlarge.
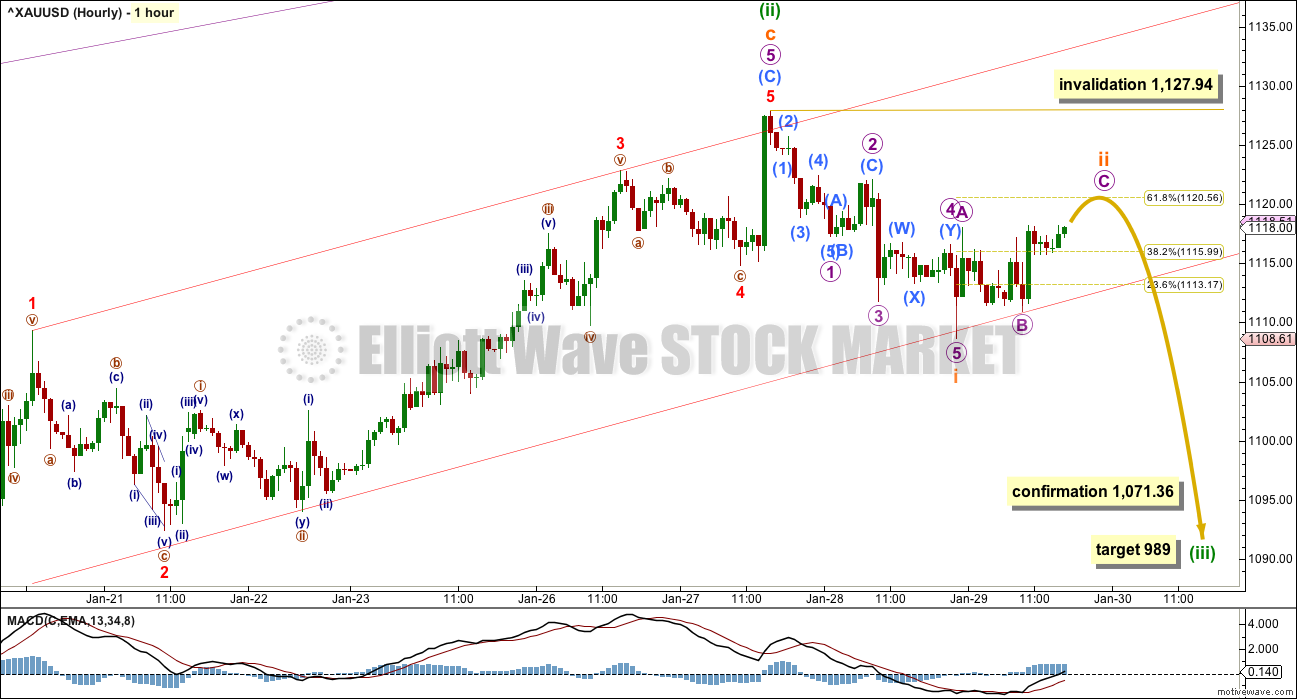
Micro wave 5 may be a complete five wave impulse.
There is no Fibonacci ratio between submicro waves (A) and (C).
There are no Fibonacci ratios between minuscule waves 1, 3 and 5 within submicro wave (C).
The red channel is a best fit about submicro wave (C). A breach of this channel is not sufficient to confirm a trend change in this instance because the second hourly bear chart below allows for this. For now the lower edge is providing support. If the channel is breached, then the lower edge may provide resistance for a throwback.
No second wave correction may move beyond the start of its first wave above 1,127.94 within minuette wave (iii).
At 989 minuette wave (iii) would reach equality in length with minuette wave (i). If this target is wrong, it may not be low enough.
A new low below 1,071.36 would invalidate the second hourly bear chart below and provide some confidence in a trend change.
ALTERNATE BEAR HOURLY CHART
Click chart to enlarge.
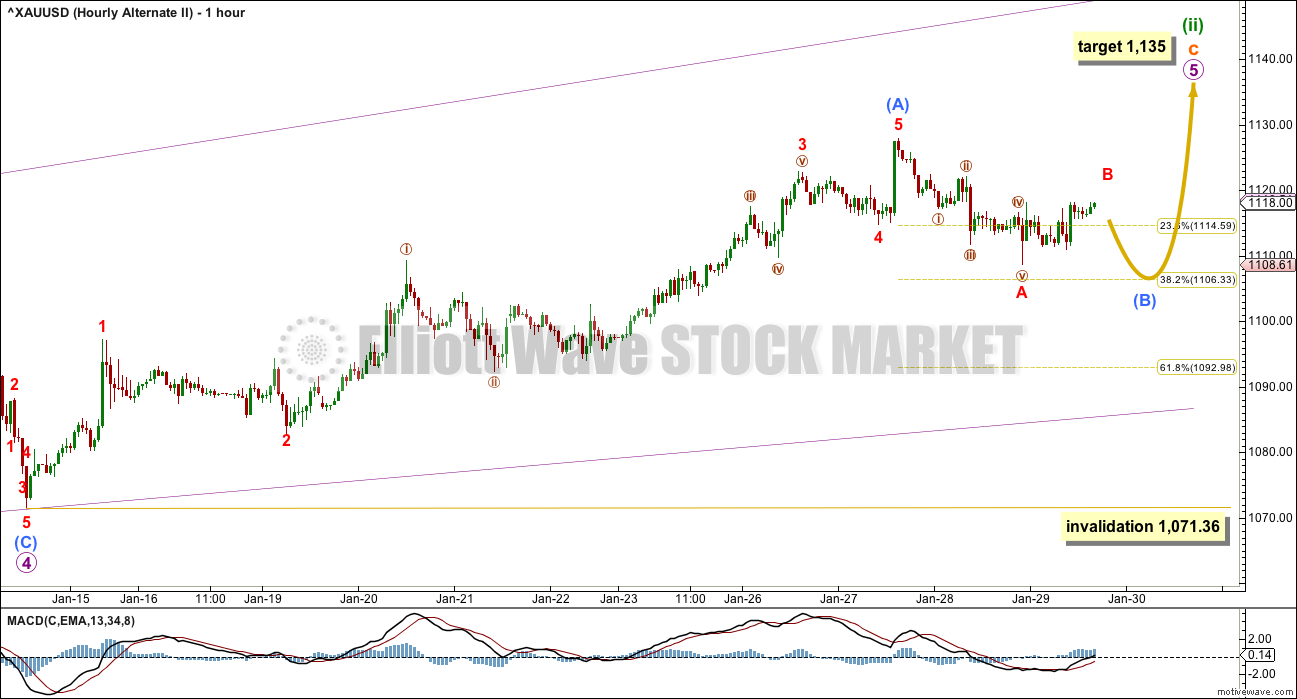
What if my labelling of micro wave 5 for the main hourly bear chart is wrong and the structure is incomplete?
Micro wave 5 must subdivide as a zigzag. Within a zigzag, both waves A and C must be five wave structures.
Submicro wave (A) may be complete as a five wave impulse.
Ratios within submicro wave (A) are: minuscule wave 3 is 1.66 short of 1.618 the length of minuscule wave 1 and minuscule wave 5 has no Fibonacci ratio to either of minuscule waves 1 or 3.
Submicro wave (B) must unfold as a corrective structure. At the low for Friday, this small downwards wave fits best as a five. Submicro wave (B) would most likely be incomplete and may be unfolding as a zigzag.
Submicro wave (B) may not move beyond the start of submicro wave (A) below 1,071.36.
ALTERNATE BULL WAVE COUNT
Click chart to enlarge.
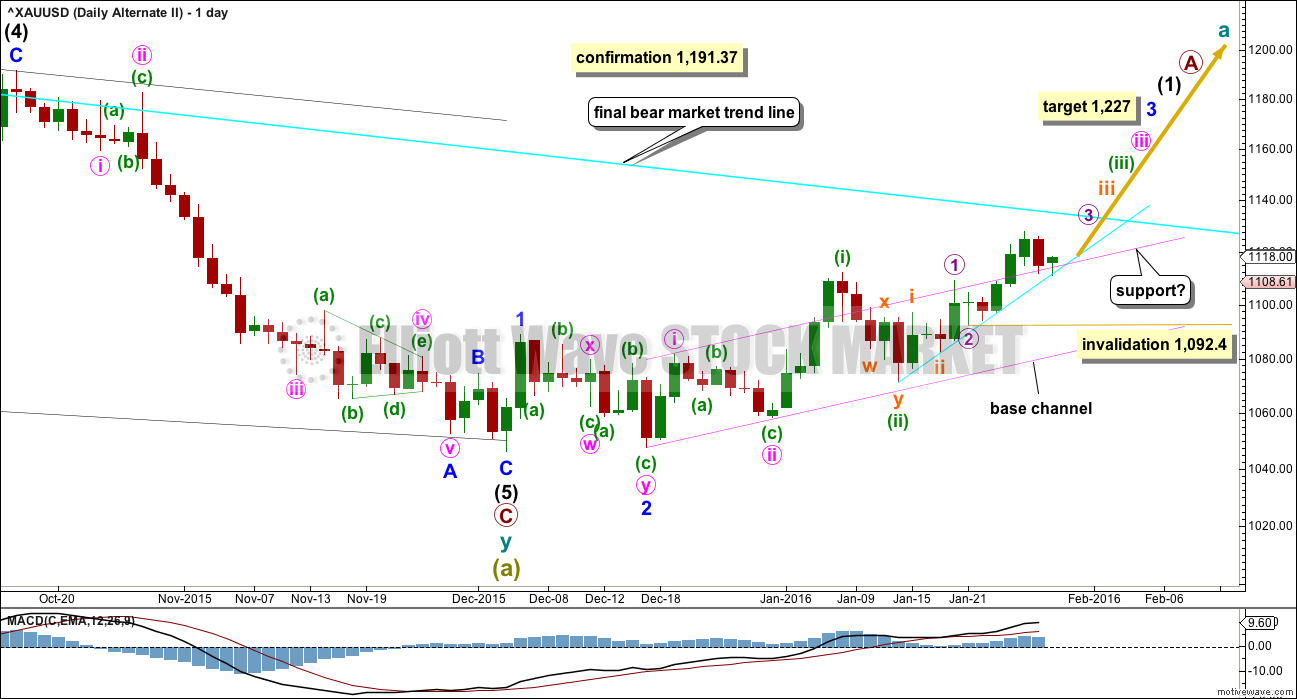
This was published here as a second alternate wave count. I will use it as the only regular alternate bull wave count because it is the only bull wave count to meet all Elliott wave rules.
I want to remind members that last time Gold saw a reasonable upwards movement from 24th July, 2015, to 15th October, 2015, there were many who expected that rise meant the bear market had ended and a new bull market had begun. It turned out that idea was premature: price turned around and made new lows. On 21st August I developed three bullish wave counts, partly in response to a demand from members, and one by one they have all been eliminated.
Now, again, price rises and there is a demand for bullish wave counts.
It is my strong view that this is premature. I will publish this wave count with that strong caveat.
Eventually the market will change from bear to bull, and when that change is confirmed that is the time to have confidence in a bull wave count. That time is not now.
Price remains below the 200 day moving average. Price has made a series of lower highs and lower lows down to the last recent low. There is not a clear five up on the daily chart. Price remains below the bear market trend line. While price remains below that line this wave count will be an alternate and comes with a strong warning that it is premature.
Downwards movement from the all time high for this bull wave count is seen as a big double zigzag which would most likely be complete at super cycle degree for an A wave.
When an A wave subdivides as a three, then the larger structure may be either a flat or triangle. The B wave may make a new price extreme beyond the start of the A wave within flats and triangles. Here, super cycle wave (b) may move above 1,920.18 as in an expanded flat or running triangle.
When the first move of a larger correction subdivides as a multiple (w-x-y), then a combination may be eliminated. Combinations may not have multiples within multiples, because that would increase the number of corrective structures within a multiple beyond three and violate the rule.
A new wave up at super cycle degree must begin with a clear five up on the daily chart (and probably the weekly as well). So far only minor waves 1 and 2 are complete. At 1,227 minor wave 3 would reach 4.236 the length of minor wave 1.
Minute waves i and ii are complete within minor wave 3. The acceleration channel is not working, so a more conservative base channel is drawn about these two waves. Copy it over to the hourly chart. A lower degree second wave correction for minuette wave (ii) should not breach a base channel drawn about a first and second wave one or more degrees higher.
The daily chart is on a semi-log scale and the hourly chart is on an arithmetic scale. This means channels sit slightly differently between these charts. The base channel has been breached now by upwards movement on both charts. The base channel on the hourly chart on an arithmetic scale is today perfectly showing where downwards movement is finding support. It may continue to do so.
Only submicro wave (1) may be complete within micro wave 3. This is shown on the hourly chart.
Gold often exhibits swift strong fifth waves, particularly the fifth waves to end its third wave impulses. Be aware of this tendency, because it could mean that any one of or more than one of micro wave 5, subminuette wave v, minuette wave (v) and minute wave v could be very strong upwards movements. If this is the case, then for this wave count it would take price comfortably above the final bear market trend line. If that happens, then this wave count would be the preferred wave count.
Click chart to enlarge.
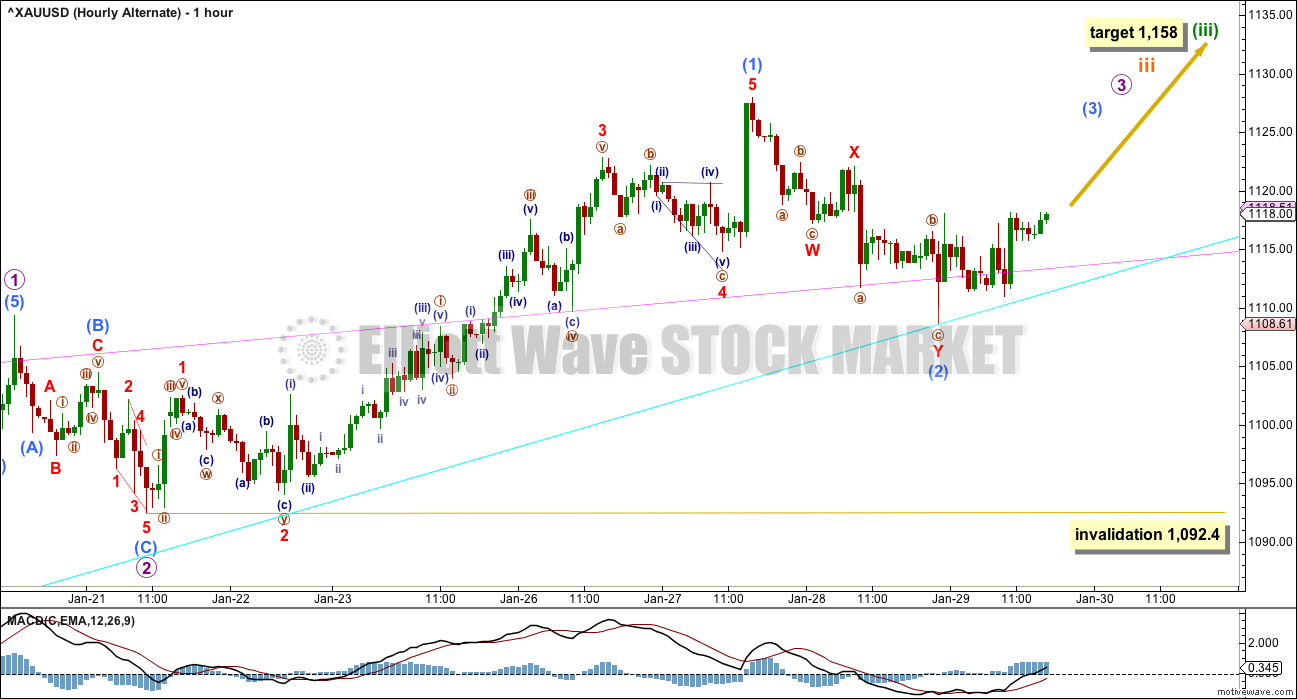
Submicro wave (2) would most likely be over because it is finding support at the upwards sloping cyan trend line copied over from the daily chart. This is about where upwards movement has been finding support for the last 12 days. So if a third wave is underway, that line should not be breached.
A clear and strong breach of the cyan line by downwards movement would put further doubt on this bullish wave count.
Ratios within submicro wave (1) are: minuscule wave 3 is 2.19 longer than 2.618 the length of minuscule wave 1, and minuscule wave 5 has no Fibonacci ratio to either of minuscule waves 3 or 1.
Submicro wave (2) may not move beyond the start of submicro wave (1) below 1,092.4.
This wave count requires a strong increase in upwards momentum.
The target for minuette wave (iii) remains the same. At 1,158 it would reach 1.618 the length of minuette wave (i).
TECHNICAL ANALYSIS
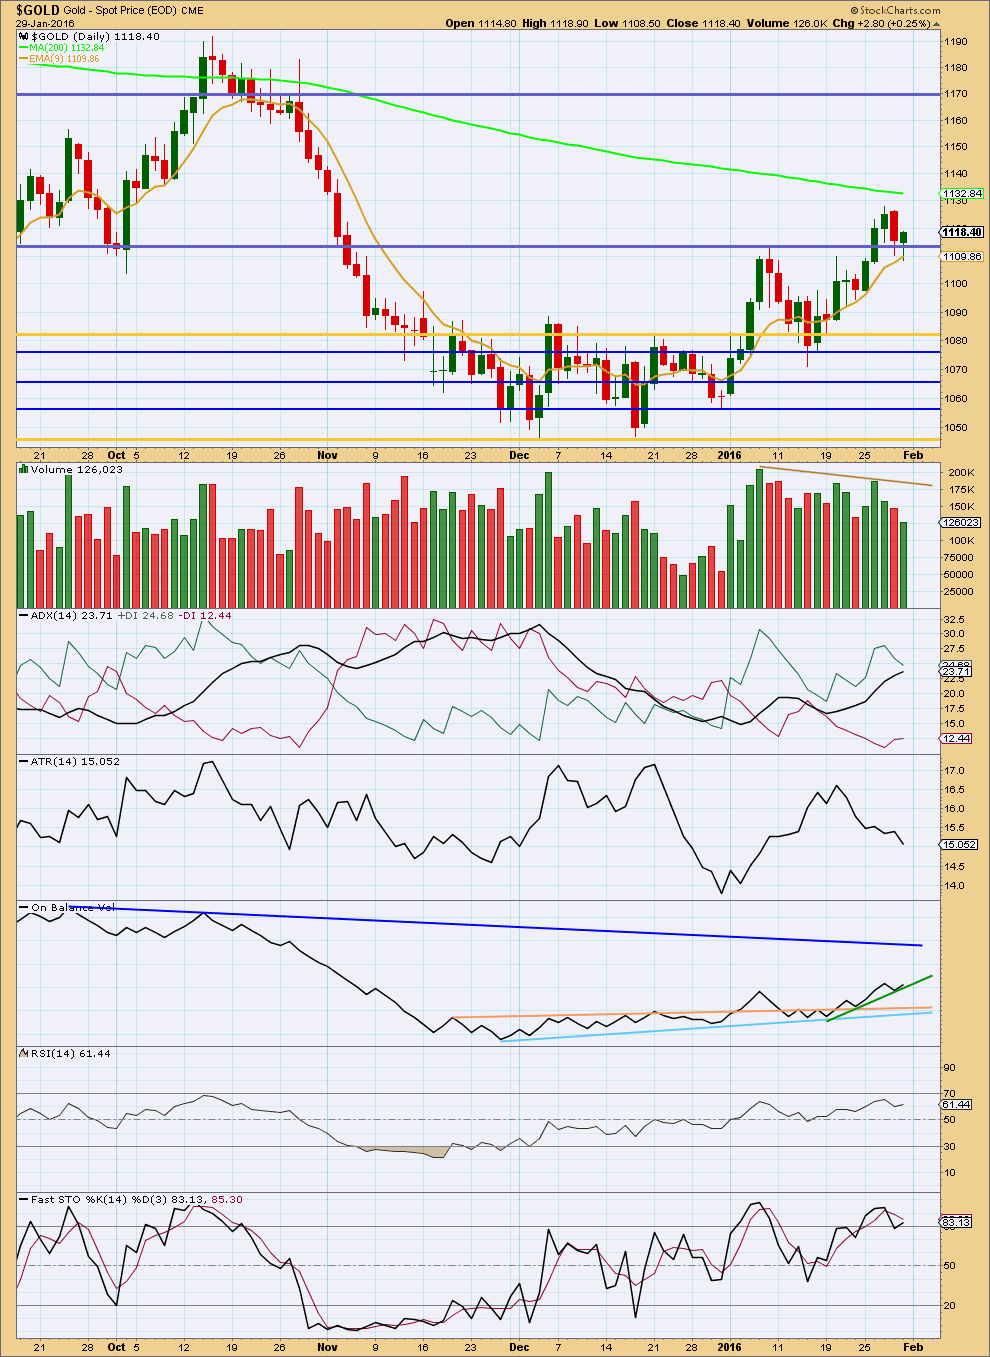
Click chart to enlarge. Chart courtesy of StockCharts.com.
Overall, as price has moved higher, it comes with declining volume. The green candlestick for Friday also comes on light volume. This indicates upwards movement may be a correction and not a new upwards trend. The rise in price was not supported by volume, and so is suspicious. This favours the main bear wave count.
Price is finding some resistance about the 200 day moving average and support at the 9 day EMA.
ADX indicates there is an upwards trend but ATR clearly disagrees. This disagreement is persistent now and has lasted for seven sessions. This favours the main bear wave count.
Stochastic shows divergence with price between the last high and the prior high of 8th January. This indicates there is weakness in the last upwards wave and favours the main bear wave count.
A new short term trend line is drawn on On Balance Volume (green). If this line is breached, that would be further warning that the main bear wave count may be correct.
This analysis is published @ 10:11 p.m. EST.
Gold may hit Lara’s wave c target before NY opens!!!!!.
Great analysis and thanks to Gold to follow the counts for a change.
It gold hits 1135 target I would expect it to happen during market hours.
However, we’ll see what Lara forecasts about last $5 to 1135.
Out of remaining GDX and GLD calls. Profit target exceeded. Sweet!
If this is a bull, we will know soon.
This upwards movement could be one of two things.
It could be a continuation of subminuette (B).
It could be subminuette (C).
This movement is weak. There is double negative divergence with price and MACD at the hourly chart level now.
What the slight new high does mean is the target at 1,135 remains for the short term.
The confirmation point for a trend change is still at 1,071.36.
The differentiating line for the bull count is still the cyan line. It still needs to breach that line for any confidence in a trend change at super cycle degree.
Gold just made a new high today 1128.98 at 2:28 pm 5 cents above high at 10:05 am.
Natural gas may drop to a more than 20-year low
Feb 1, 2016 1:40 p.m. ET
A plunge to $1.50 level would be lowest since 1995
http://www.marketwatch.com/story/natural-gas-may-drop-to-a-more-than-20-year-low-2016-02-01
The alternate hourly bear seems valid to me. Looks like a B wave correction. In other words, the smaller B (red), within the larger B (blue), may be a flat. This might explain why there was barely any momentum behind today’s movement and gold could barely muster the strength to break to a new high. Instead of busting higher, gold has just been lingering.
I expect more choppy movement tomorrow, with gold perhaps going a little lower before going up to complete that final C wave.
We’ll see what Lara says.
The small B wave is about 104% of the prior A wave, so it is a perfectly normal regular flat correction.
Depending on what numbers one uses, the correction could be 105% too. Either way, this slow grinding higher certainly does not appear very impulsive.
If the A red is in five, the follow B red cannot move up of A wave.
A flat is 335 and in this case wave A red is in five.
In spirit of sharing analysis of others I came across this GANN analysis.
Calling Miners have bottom and start putting togather Miner portfolio????
watch the video: Bottoms in
http://www.gannglobal.com/webinar/2016/January/GGF-Promo/16-01-Video1-GGF.php?inf_contact_key=3706bfab6499add2a52d28bcb024cb78c30b982dadb1cde2b9212a9e0b7fc743
Also bear hourly alternate is invalided.
B wave red cannot move up of A wave red, because A wave red is in five and the correction ABC must be a zigzag
If that is the case then we get two new main hourly wave counts.
Maybe, in the alternate, it is possible count the A wave red as a zigzag and in this case it could be the (B) blu wave, so in this moment we could be in wave 4 of ( C) blu. But it is better wait Lara…..
Main hourly bear count just invalidated above 1127.94 at 10:05 am to 1128.93
Makes sense. Alternate hourly bear may work out to have gold and oil both turn down together in a few days.
Oil likely just completed wave 4 of the expanding ending diagonal count shown by Edwin on the oil post . Now wave 5 must be longer than wave 3. That puts the target around 37.
I beg your pardon, but next move for oil is $26 then $22 per barrel. Next move for gold is $1135 then $1158. (along with rising gold miners. ) IMHO and consistent with LARAs Bull alternate.
SAFE haven buying will likely continue during BEAR STOCK MARKET. ELLIOT WAVE INTERNATIONAL Is WRONG, IMHO, expecting gold to go down to new lows, as the sentiment of hedge fund buyers and long Specs is bullish. Laras alternate for a Bull will I believe prove itself this week as the SPX and DOW are in a BEAR market. Just an observation from someone who has been in the precious metals mining business and involved since 1974 in Precious metals price forecasting . KEEP UP THE GOOD WORK Lara.
Lara great report.
I see inverse HnS in hour chart. A low around 1118 would be a RS and gold is at the neck line 1122-1124.
My trading buddies in Beruit, Helisnki, Moscow, Austria and Central Europe as well as Hong Kong all agree that the sentiment for gold is up and are going long with me. Not good to be short in here, IMHO .
EWI video on Gold and Silver. New lows are expected once the ending diagonal in Gold completes.
https://www.youtube.com/watch?v=js4Ub_MQdVM&feature=youtu.be&list=TLASx_RQ-zKogzMTAxMjAxNg
This wave count looks the same as main wave count in Lara’s report??? Is It??
Gold reacting to bullish sentiment is up over $6 in 5 hours. So at that rate we should easily clear $1130 by 800:AM New York time.
It might not be easy for gold to keep going up.
Gold just dropped $2 in 19 minute to 1,120.45 at 12:17 am.
Gold may be following bear hourly or bear hourly alternate. Both have gold going up to about 1,121 then dropping, which it looks like so far.
I did buy a little DUST at it’s low at the Friday close, maybe DUST may open at a profit? No big deal. I’ll follow and trade what the market does.
Have 1123.90 at 2 25 AM New York on its way to 1130 by 8:00 New York time IMHO.
Thanks for this Lara, really clarifies Gold. An update in WTI would be highly appreciated.
Hope this is possible very soon.
Oil is updated once a week on Tuesday.
So far it is doing exactly as the last analysis expected.
Hi Lara, yes Gold and Oil are following your hourly charts very well.
Thank you very much for all your hard work.
Trader Dan Gold COT chart.
http://traderdan.com/?p=9346
here is the latest breakdown of the COT chart showing the movement of the hedge funds and comparing that the price of gold.
Can you see how the rise and fall in the outright long and outright short positions reflects the shifting sentiment towards the metal.
Hi Folks, if anyone wants the excel version of the COT reports, here is the link. It is updated between 3:25 and 3:30pm EST every Friday (unless holidays are in play).
http://www.cftc.gov/MarketReports/CommitmentsofTraders/HistoricalCompressed/index.htm
Enjoy,
Ben
Which one do you use? Is this it?
Traders in Financial Futures ; Futures-and-Options Combined Reports
FYI everybody the video has been re done.
Take #2 is uploaded. So you may want to view that again.
Gold may have bottom by miners action??? Even if gold goes down miners may resist going down.
XAU to gold ratio:
http://goldtadise.com/?p=361440
XGD to Gold ratio:
http://goldtadise.com/?p=361454
It is certainly something to consider here, lots of miners are starting to look like they have bottomed.
Hiw should we see counts..
Like for primary we see counts on monthly chart…
So for intermidiete and minor shoukd we see hourly charts..?? ..im confused..??
Plss Lara or any other friend can help..??
Look and click on the small: ‘Wave Notation’ chart on upper right side of this site it explains all waves and their time frames. i.s Primary = months
For primary see the counts on the monthly chart. Linked to at the beginning of the analysis.
And you can find bigger time frames under the category “gold historical”.
The daily chart is now showing minor degree and below.
The hourly chat is now showing minuette and below.
Thank u lara.:)
Gold COT: Commercials increased their short positions and went from 44% bullish to 40% bullish. Sometimes there is a lag with Gold vs. the Commercials, so my thoughts are that this supports the Main Bear wave count, along with the Alternate Bear hourly. In other words, one more leg up and then down goes gold…
Silver COT: Commercials continue to be more bearish Silver than Gold. They increased their short positions and are now only 34% bullish compared to 37% last week.
Dreamer, I posted my COT analysis update on the previous day if you want to review it.
Have a great weekend!
Yes, I think your chart allows for gold to move up to the 1,135 target before turning down.
Definitely think the possibility is there, so I kept 1/3 positions for that possibility.
Great COT report. thanks for posting. If I may request you to hold off posting the report and wait for Friday report and post it for weekend review will be nice going forward.
I like your urgency and enthusiasm to share the important report every one is looking forward to.
Thanks.
Hi Papudi,
My analysis does include the Friday (yesterday) cot data. I use the source data at the CFTC so I don’t have to rely on others posting the COT charts. My process goes like this: CFTC updates cot data at 3:30pm Eastern every Friday (sometimes earlier). I download the excel version, paste new data into my spreadsheet, update the chart, review recent movements, and I am done. It takes me about 5 to 10 minutes every Friday afternoon. I’m usually ready to post before Lara has the Friday analysis up on the site. So I share it on the most recent day, which sometimes is Thursday.
Hope that helps with background!
Very helpful, thank you.
FYI. Re Commrcials Precious metals. Who are the commercials? Mostly the Mining Companies and some fabricators. Yes it is useful to track the COT positions BUT, at extremes they often mislead. I know, be cause when I was with Callahan Mining Corp. we and others, would hedge to lock in profits (or protect profits). by selling futures forward. But at extreme lows or highs in prices we could err but miss the next month or two of market rise in price . But that was OK since we had the physical metal to sell or withhold . It is possible that the rise in commercial short position at this juncture does not reflect what the Elliot wave world conciousness/consensus will actually turn out to be. Yes due to the lag in COT and actual price action ,we may go up only to 1135 before a pullback and new lows, but it is also possible we may have seen the lows last Dec in the 1040s. There is only one Truth in the market ,and next week will tell us the Truth. I am holding long April Comex Gold Futures. Happy Groundhog Day!
Thanks Lara. One thing that’s interesting is how much volume there was in January. I’ve got to go look at a monthly volume bar but it looks big on the daily’s.
Thanks for the wonderful analysis! Nice $4k profit in January!