
Last week’s Silver analysis expected more sideways movement, which is exactly what has happened.
Summary: It is just possible that the correction could be over this week, but this scenario has the lowest probability of all three daily charts. What is more likely is Silver will continue overall sideways for a range bound market, and then it will eventually break out. StockCharts volume suggests the breakout is more likely to be upwards.
New updates to this analysis are in bold.
MAIN WAVE COUNT
Click chart to enlarge.
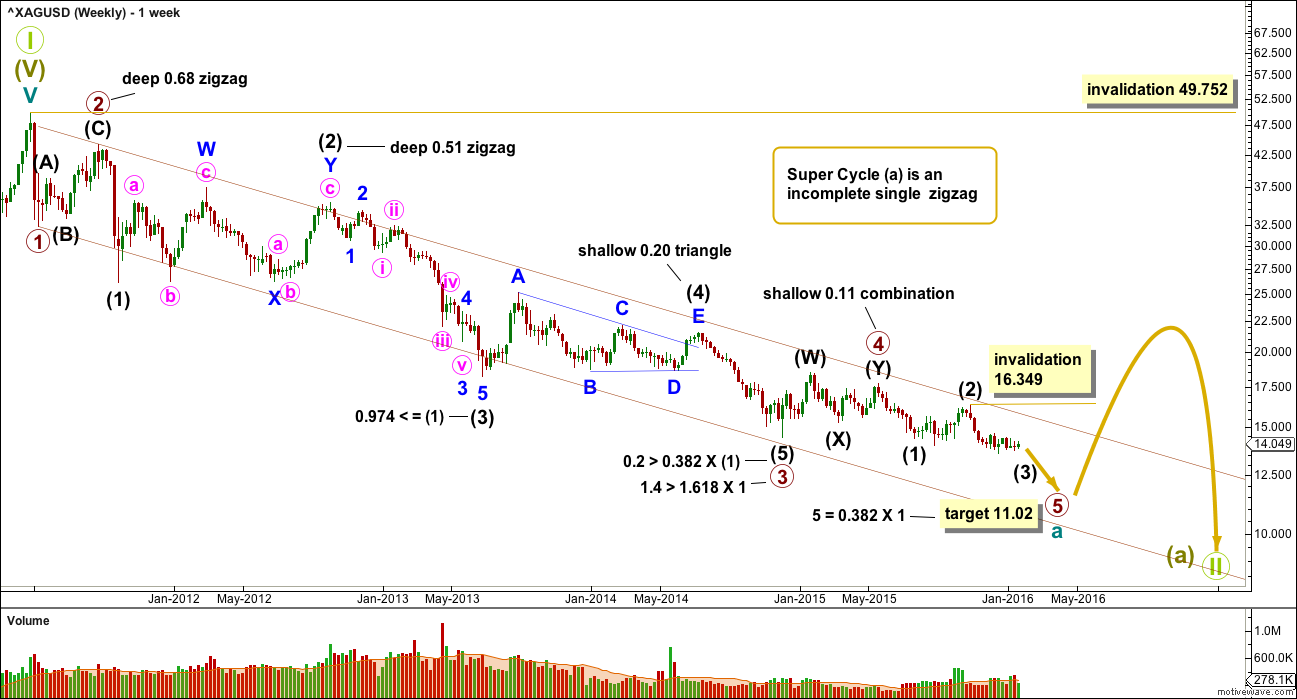
Primary wave 4 may be complete and primary wave 5 may be underway.
Primary waves 2 and 4 exhibit perfect alternation and good proportion: primary wave 2 was a deep zigzag lasting 15 weeks and primary wave 4 was a shallow combination lasting 24 weeks, 1.618 the duration of primary wave 2.
At 11.02 primary wave 5 would reach 0.382 the length of primary wave 1.
This wave count is preferred primarily for the reason that there has been no technical confirmation of a trend change from bear to bull for Silver.
Intermediate wave (2) may not move beyond the start of intermediate wave (1) above 17.71. A breach of this invalidation point would now also require a strong breach of the bear market channel, so this invalidation point should not be moved any higher. When that channel is breached that should indicate a trend change for Silver from bear to bull. At that stage, only bullish wave counts should be seriously considered.
When cycle wave a is a complete five wave impulse, then the following upwards movement for cycle wave b should last one to several years, may be any one of 23 possible corrective structures, and may not move beyond the start of cycle wave a at 49.752.
Click chart to enlarge.
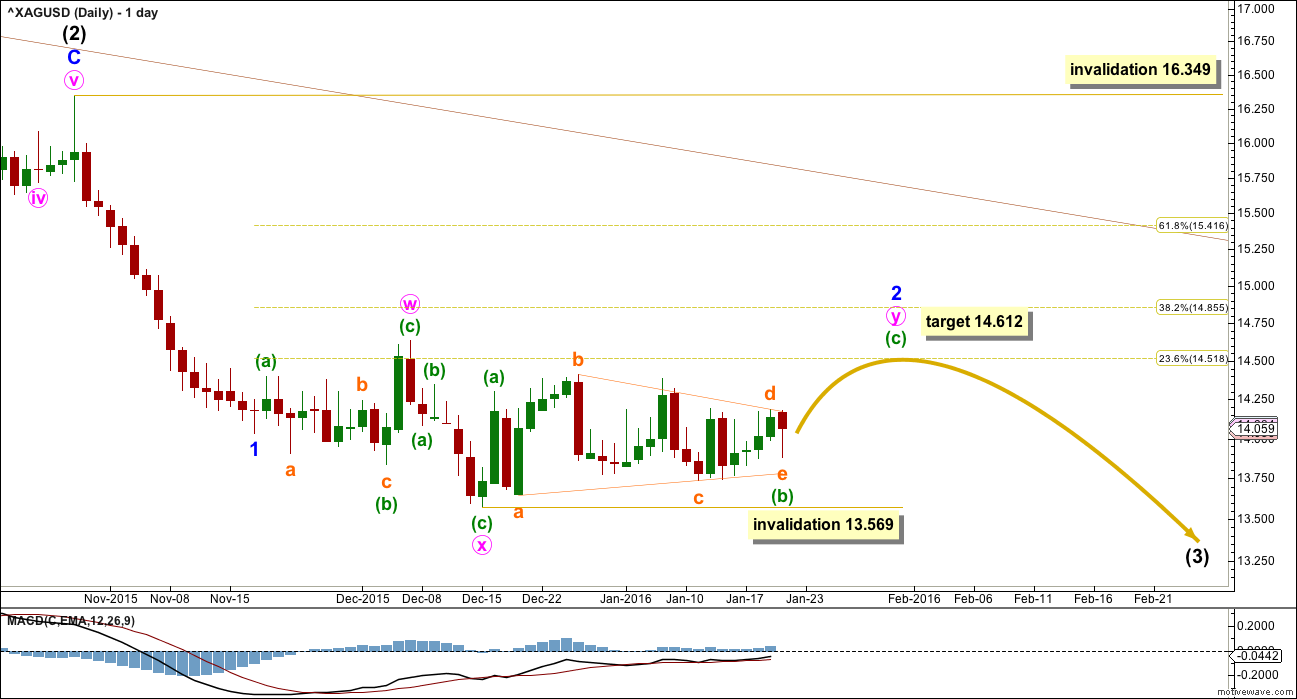
All wave counts at the daily chart level this week will show movement since the high at 16.349 on 28th October.
A second wave correction would still be incomplete for minor wave 2.
Minor wave 2 fits as an incomplete double combination at this stage. The first structure in the double labelled minute wave w is an expanded flat. The double is joined by a three, a zigzag in the opposite direction, labelled minute wave x. The second structure in the double is a zigzag labelled minute wave y.
Subminuette wave (b) is a time consuming regular contracting triangle within minute wave y.
This week it does look like a triangle is part of this consolidation. Of all the scenarios I have tried to chart, this one has the best look for the triangle.
Minuette wave (b) may not move beyond the start of minuette wave (a) below 13.569 within minute wave y.
At 14.612 minuette wave (c) would reach equality in length with minuette wave (a). This would see minute wave y end about the same level as minute wave w, so the whole combination structure would move sideways and have a typical look.
This wave count expects to see an upwards swing about here within the consolidation. When that is done, this wave count then expects price to break out of the consolidation downwards. That expectation is not supported so far by StockCharts volume data.
ALTERNATE WAVE COUNT
Click chart to enlarge.
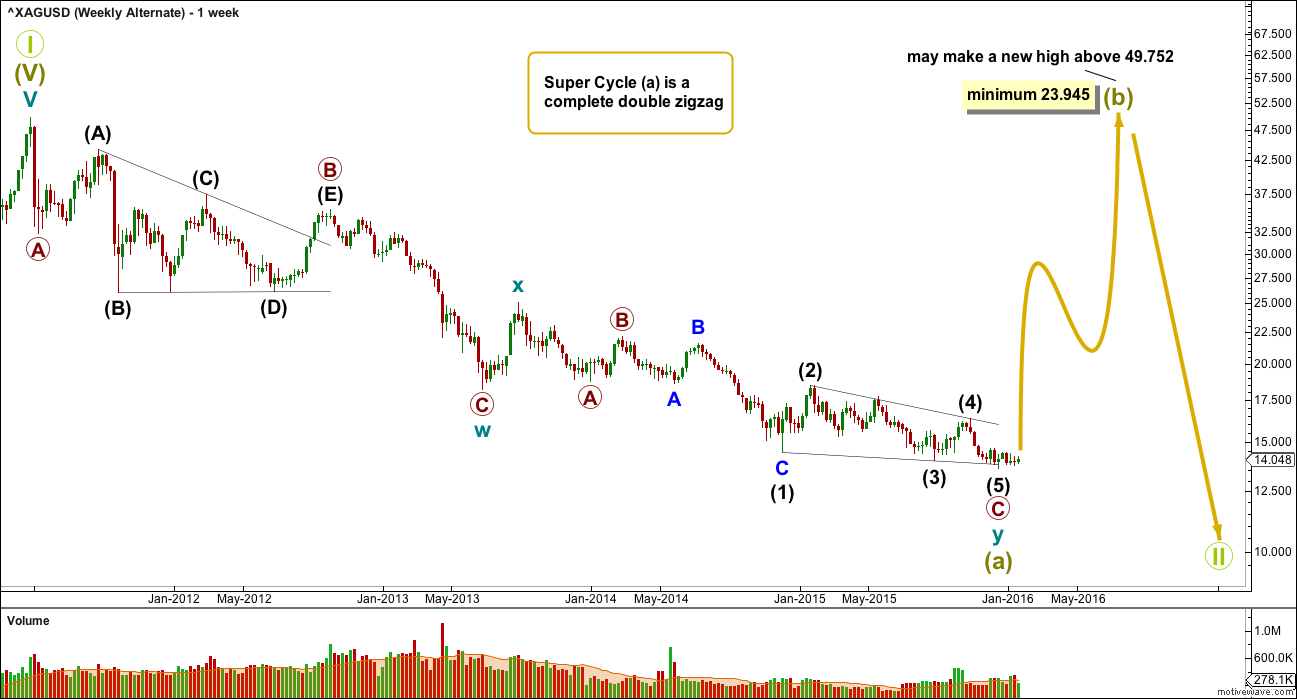
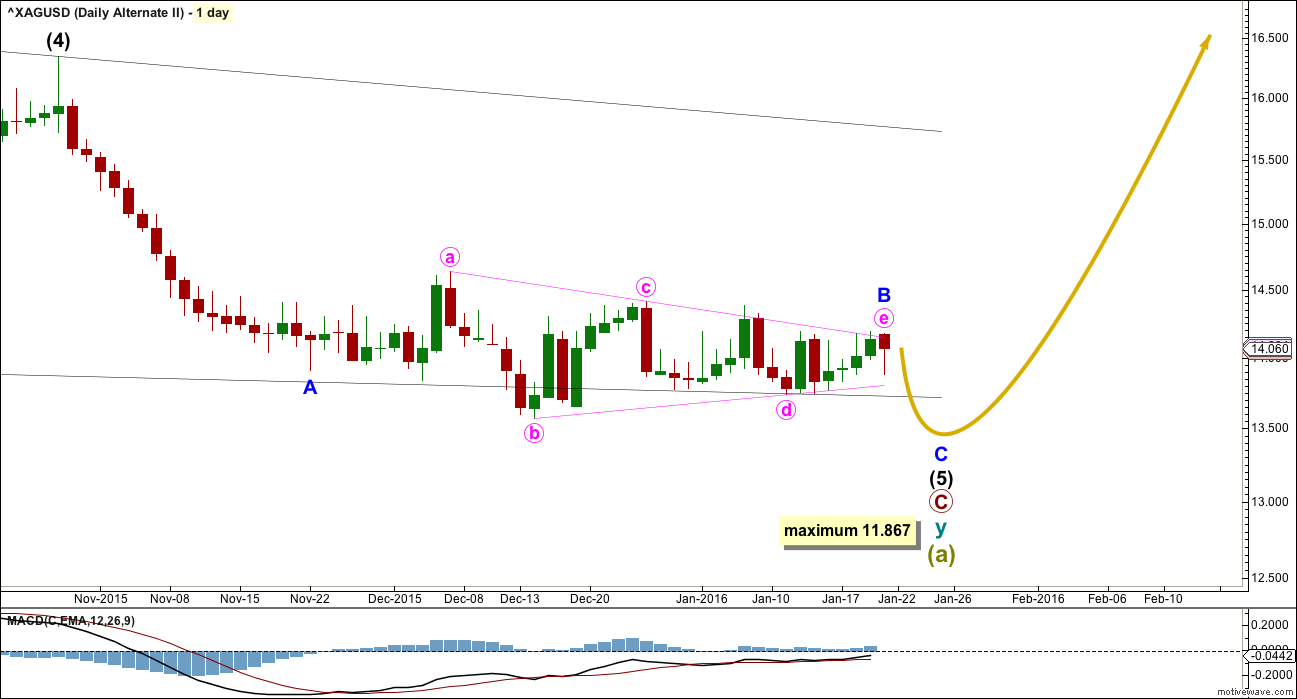
If super cycle wave (a) is a double zigzag, then within the second zigzag of the double labelled cycle wave y the structure may be complete.
Primary wave C is an ending contracting diagonal within the zigzag of cycle wave y. All subwaves subdivide as zigzags. The third wave is shorter than the first, the fifth wave is shorter than the third, and the fourth wave is shorter than the second. The trend lines converge.
There is a small overshoot of the (1)-(3) trend line at the end. This indicates the contracting diagonal structure is very likely to be complete.
If this wave count is correct, then super cycle wave (a) has subdivided as a three wave structure. That indicates Grand Super Cycle wave II may be a flat correction.
If this correction at Grand Super Cycle is a second wave (as opposed to a fourth wave), then a triangle may be eliminated.
A combination may also be eliminated because the first wave is a multiple. Combinations may only consist of a maximum of three corrective structures, so within each of W, Y and Z they may only subdivide into simple A-B-C structures (or A-B-C-D-E in the case of triangles). To label multiples within multiples increases the maximum beyond three, violating the rule.
Super Cycle wave (b) must retrace a minimum 90% of super cycle wave (a) at 23.945. Super cycle wave (b) may make a new price extreme beyond that seen for super cycle wave (a) above 49.752 as in an expanded flat.
Super cycle wave (b) may be any one of 23 possible corrective structures. It is impossible to predict at this early stage which one it will be, only to say it is unlikely to be a rare structure such as a running flat, expanding triangle or triple combination. That still leaves multiple structural possibilities.
The first movement up for a wave of this large degree must subdivide as a clear five at the daily chart level, and probably at the weekly chart level also.
Click chart to enlarge.
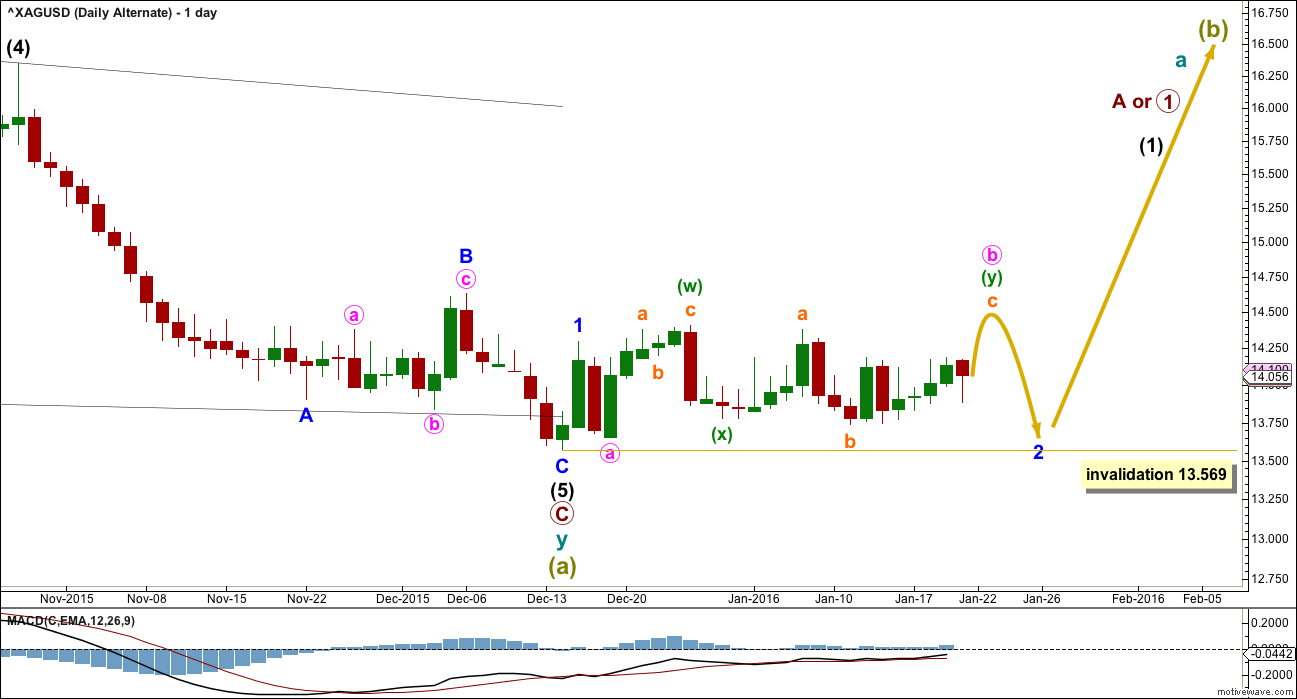
If there has been a trend change at super cycle degree, then a clear five wave structure upwards must develop.
The ending contracting diagonal for primary wave C would very likely be complete as there is a slight overshoot of the (1)-(3) trend line.
So far only a first wave would be complete. Minor wave 2 may be unfolding as a very deep flat correction. It may also morph into a combination.
Minor wave 2 may not move beyond the start of minor wave 1 below 13.569.
The only thing to add for this wave count this week is I have tried to see if for this scenario minor wave 2 could be complete. I cannot see a solution. My conclusion is for this wave count minor wave 2 would be incomplete.
Click chart to enlarge.
If the diagonal is not complete, then a final C wave down may be required. However, with the overshoot of the (1)-(3) trend line this wave count looks wrong. Price has returned above the trend line and is perfectly finding support there. This suggests the diagonal is complete.
Sideways movement fits neatly as a running contracting triangle. This may be a B wave.
The diagonal is contracting, so intermediate wave (5) may not be longer than equality in length with intermediate wave (3). The limit for this wave count is at 11.867. Intermediate wave (5) should end a fair way above this point for the diagonal to have the right look.
I do not have confidence in this wave count. It is presented as a “what if?” to consider all possibilities.
TECHNICAL ANALYSIS
DAILY CHART
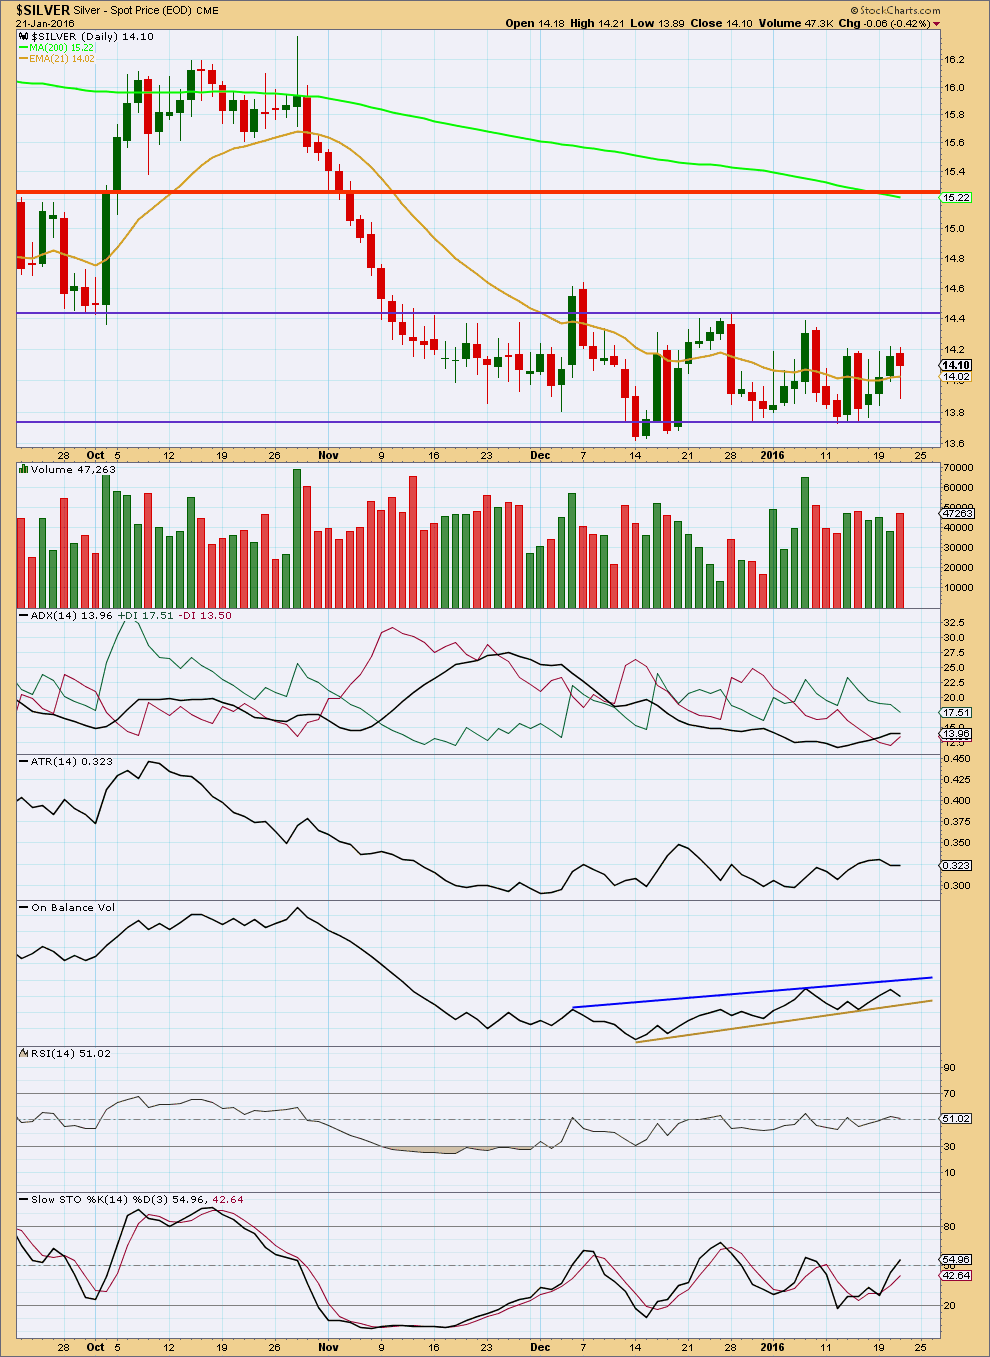
Click chart to enlarge. Chart courtesy of StockCharts.com.
StockCharts volume differs from FXCM volume. I will rely on StockCharts volume data (it is more reliable).
During this sideways consolidation that Silver began back in November 2015, it is an upwards day for 7th January, 2016, which shows strongest volume. This suggests that price may break out of this consolidation upwards. This trick does not always work, but it works more often than it does not work.
ADX is below 15, so no trend is indicated. The market is range bound. Overall, ATR agrees as it is mostly flat.
On Balance Volume remains bound within the blue and brown lines. A break above or below either of these lines may indicate the direction of price breakout.
RSI is neutral, there is plenty of room for this market to rise or fall.
Stochastic has returned from oversold. Expect price to swing upwards and continue until price finds resistance and Stochastics is overbought at the same time.
This analysis is published @ 08:41 p.m. EST.
Lara, do you think there is any significance that both gold and silver have an ending diagonal count at such a high level (Intermediate) and they both have an overshoot? Why would that happen if this turns out not to be the bottom?
I do think it is significant actually.
Both fit perfectly and meet all EW rules now for the new labelling I have.
And both have overshoots. And overshoots to end diagonals are often small. Both look to be done.
If it turns out to not be the bottom? Then the bear count is correct and those were not ending diagonals.