
Downwards movement continues exactly as expected for US Oil.
Summary: Oil is in a fifth wave to end a third wave impulse. Commodities often exhibit swift strong fifth waves, particularly fifth waves to end their third waves. The target remains the same at 29.21.
New updates to this analysis are in bold.
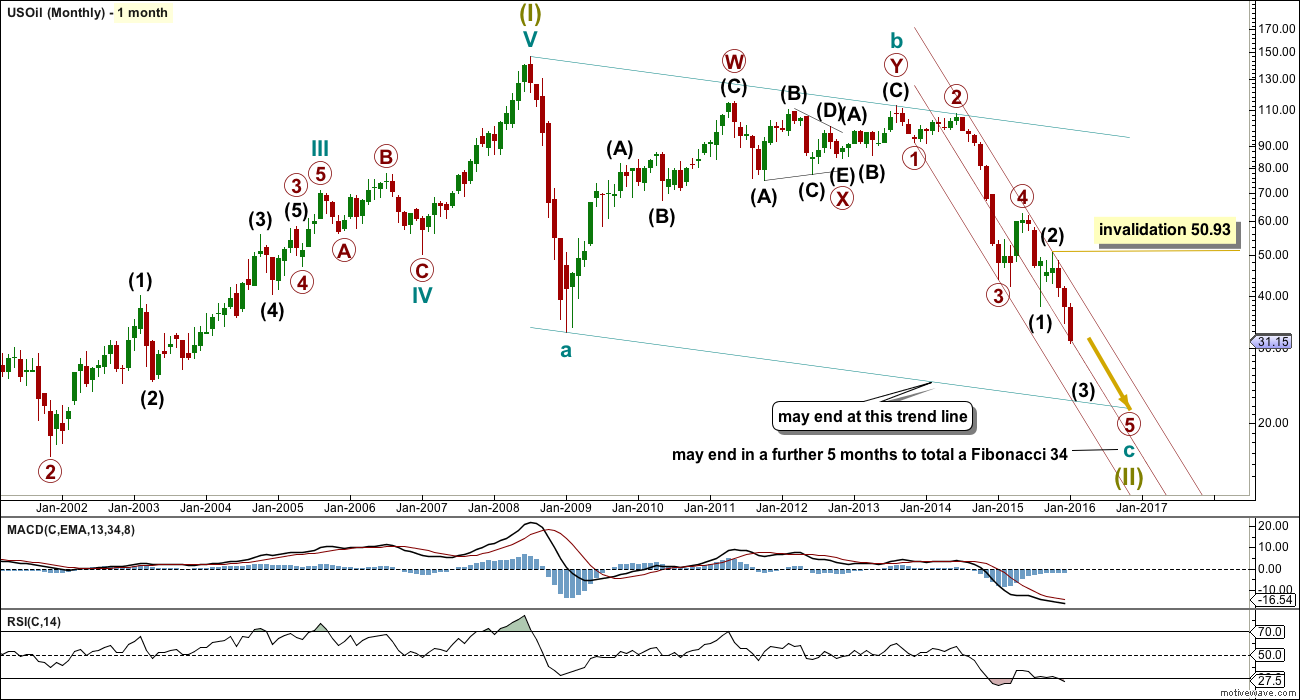
MONTHLY ELLIOTT WAVE COUNT
Click chart to enlarge.
US Oil has been in a bear market since August 2013. While price remains below the upper edge of the maroon channel drawn here and below the 200 day simple moving average it must be accepted that the bear market most likely remains intact. I will not publish a bull wave count while this is the case and while there is no technical confirmation of a trend change from bear to bull.
The structure of cycle wave c is incomplete.
This wave count sees US Oil as within a big super cycle wave (II) zigzag. Cycle wave c is highly likely to move at least slightly below the end of cycle wave a at 32.70 to avoid a truncation. Cycle wave c may end when price touches the lower edge of the big teal channel about this zigzag.
Within cycle wave c, primary wave 5 is expected to be extended which is common for commodities.
No second wave correction may move beyond the start of its first wave above 50.93 within intermediate wave (3).
Draw a channel about this unfolding impulse downwards. Draw the first trend line from the lows labelled primary waves 1 to 3, then place a parallel copy up not the high labelled intermediate wave (2), so that all movement is contained. Add a mid line. Copy the channel over to the daily chart.
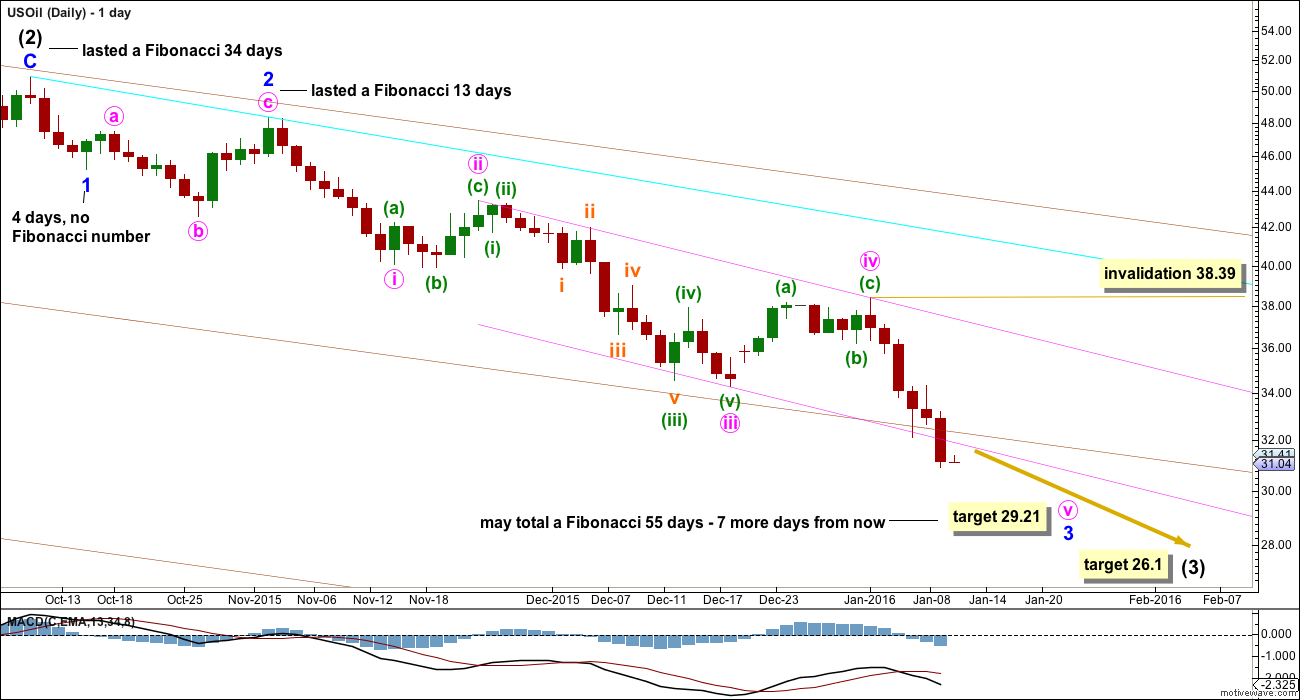
DAILY ELLIOTT WAVE COUNT
Click chart to enlarge.
At 26.1 intermediate wave (3) would reach equality in length with intermediate wave (1).
Minor waves 1 and 2 are complete within intermediate wave (3).
Minor wave 3 is an incomplete impulse.
At 29.21 minute wave v would reach equality in length with minute wave iii. Both minute waves iii and v would be extended. Minute wave v may be stronger and may be relatively swift.
So far minor wave 3 has lasted 48 days. If it continues for a further 7, it may total a Fibonacci 55 days. If the target is not reached in a further 7 trading days, then the next Fibonacci number in the sequence is 89 which would see it continue for a further 41 days.
The pink channel about minor wave 3 is overshot to the downside. This is typical when a fifth wave is swift and strong. The mid line of the wider maroon channel from the monthly chart is also overshot. This line may now provide resistance to upwards corrections.
No second wave correction may move beyond its start above 38.39 within minute wave v.
If targets are wrong, they may be too high. Expect surprises for this market to be to the downside at this time.
TECHNICAL ANALYSIS
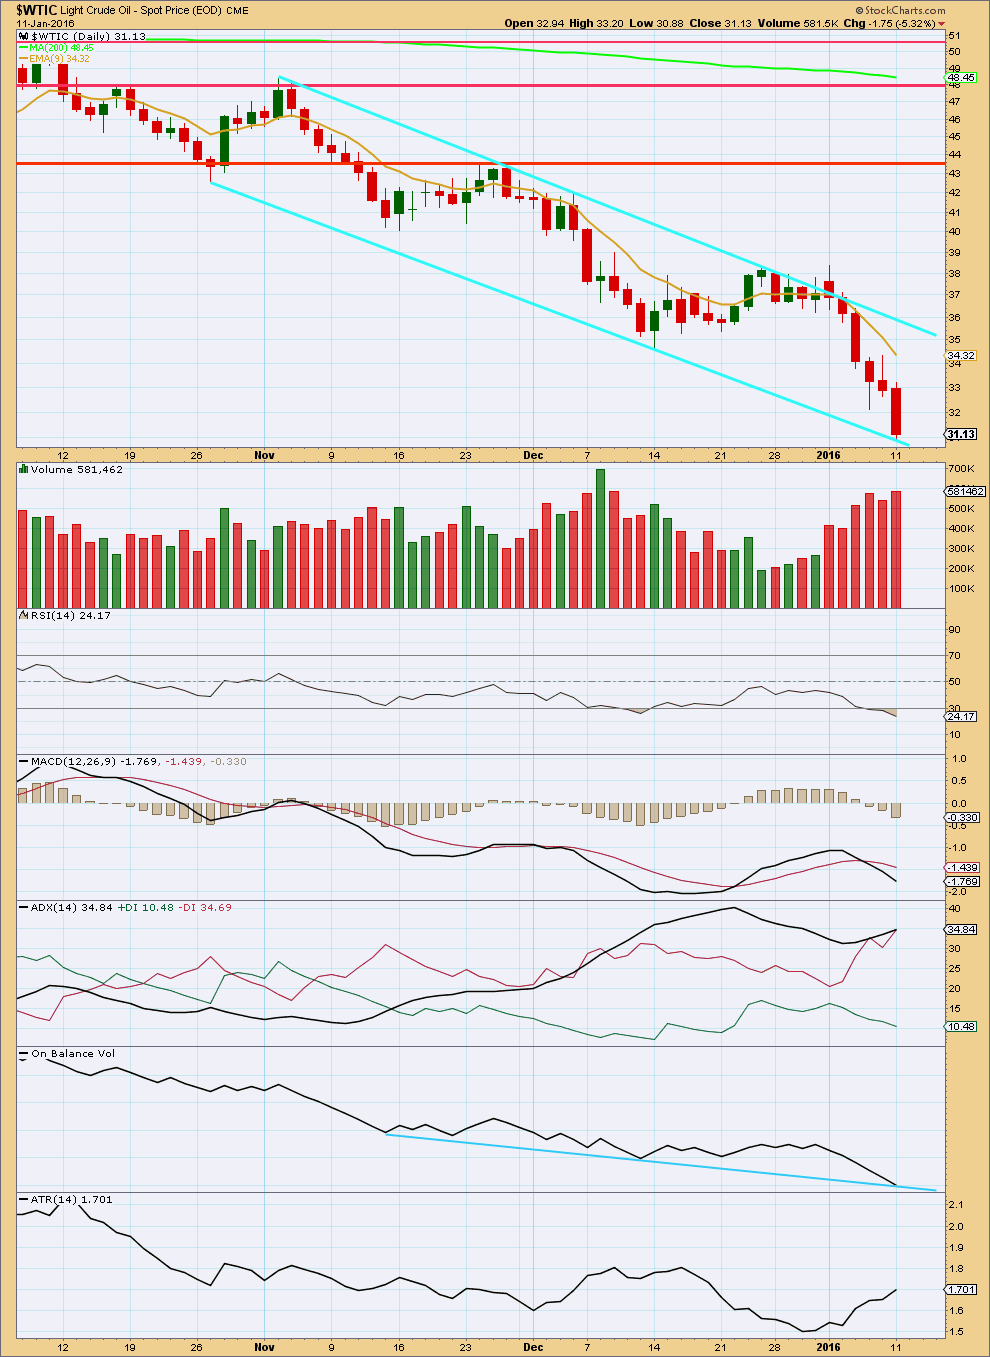
DAILY CHART
Click chart to enlarge. Chart courtesy of StockCharts.com.
ADX is increasing indicating a trend is in place. The trend is down. This is supported by ATR which is also increasing.
The volume profile of this fall in price is bearish. As price falls it is supported by rising volume. The prior upwards movement was not supported by volume.
RSI is reaching oversold, but for this market RSI may fluctuate about extremes for long periods of time. The last time Oil fell strongly from June 2015, to a major low on August 2015, RSI first reached oversold on 6th July 2015, yet the downwards trend continued for a further $14.93 to the low. RSI should be used to indicate a correction to unfold against the trend when it exhibits some divergence.
On Balance Volume has come to touch a support line. This may initiate a small bounce, maybe a green daily candlestick.
What is clear is the trend is down. While price remains below the upper cyan trend line it should be expected that the trend remains down.
Upwards corrections may find resistance about the 9 day EMA.
This analysis is published @ 09:57 p.m. EST.
Elliot wave from Profit source on oil today.
Up to 4 correction (to 37.729-40.233) then down to 5 25.86 around 3 May 2016
Hope this helps?
Regards
Ursula
Hi Lara,
is a correction to be expected soon? From 3 up to 4 then down to 5?
An update would be highly appreciated.
Regards
Ursula
It’s a bit scary to be short at these levels so I covered a couple of days ago…almost certainly too soon. I am guessing that once minor 3 is over between here and $27 then there might be a tradeable bounce over several days.
Does anyone has a count between minute 4 and ongoing minute 5?
thaks!
Excuse me Mr. Carboni!!!! You were not the only one calling for US oil to go down to 30 back then.
How about Lara!!!!
Watch the video at minute marker at 4:10.
https://www.youtube.com/watch?v=DN7FuGWsJr0