
Downwards movement continues exactly as expected for US Oil.
Summary: Oil is in a fifth wave to end a third wave impulse. Commodities often exhibit swift strong fifth waves, particularly fifth waves to end their third waves. The target remains the same at 29.21. At this stage, there is no warning of a trend change. The trend is down.
New updates to this analysis are in bold.
MONTHLY ELLIOTT WAVE COUNT
Click chart to enlarge.
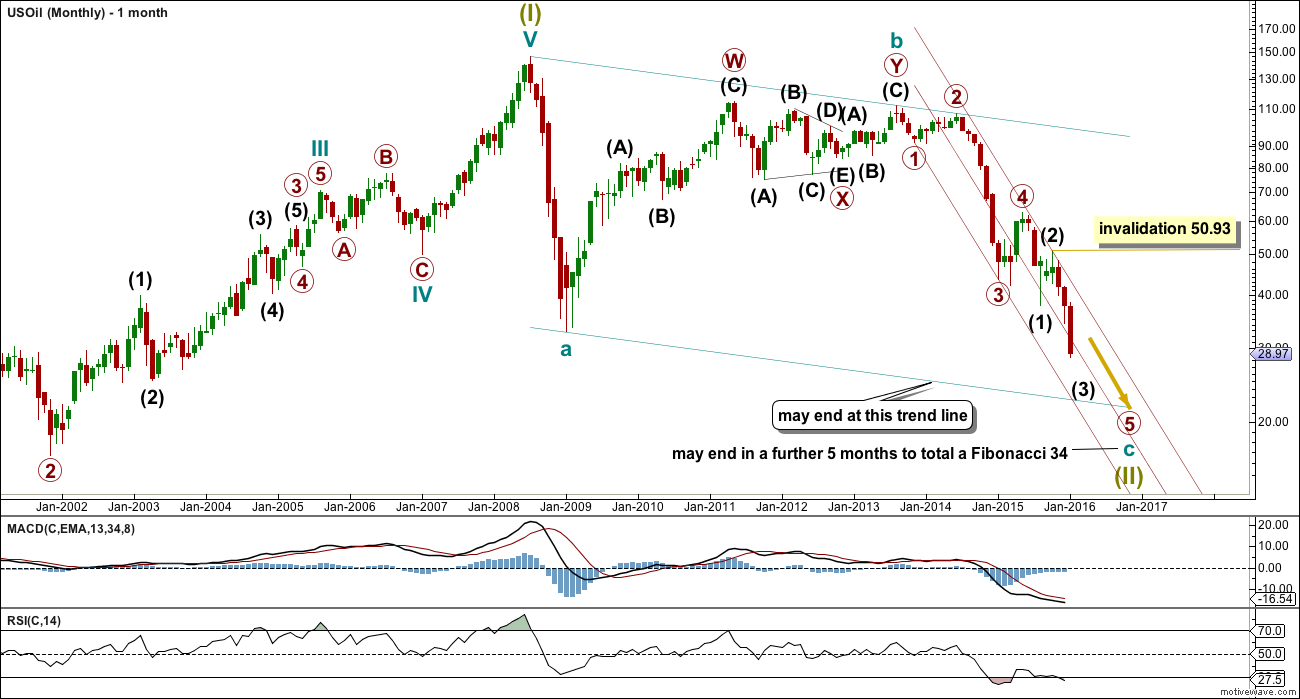
US Oil has been in a bear market since August 2013. While price remains below the upper edge of the maroon channel drawn here and below the 200 day simple moving average it must be accepted that the bear market most likely remains intact. I will not publish a bull wave count while this is the case and while there is no technical confirmation of a trend change from bear to bull.
The structure of cycle wave c is incomplete.
This wave count sees US Oil as within a big super cycle wave (II) zigzag. Cycle wave c is highly likely to move at least slightly below the end of cycle wave a at 32.70 to avoid a truncation. Cycle wave c may end when price touches the lower edge of the big teal channel about this zigzag.
Within cycle wave c, primary wave 5 is expected to be extended which is common for commodities.
No second wave correction may move beyond the start of its first wave above 50.93 within intermediate wave (3).
Draw a channel about this unfolding impulse downwards. Draw the first trend line from the lows labelled primary waves 1 to 3, then place a parallel copy up not the high labelled intermediate wave (2), so that all movement is contained. Add a mid line. Copy the channel over to the daily chart.
DAILY ELLIOTT WAVE COUNT
Click chart to enlarge.
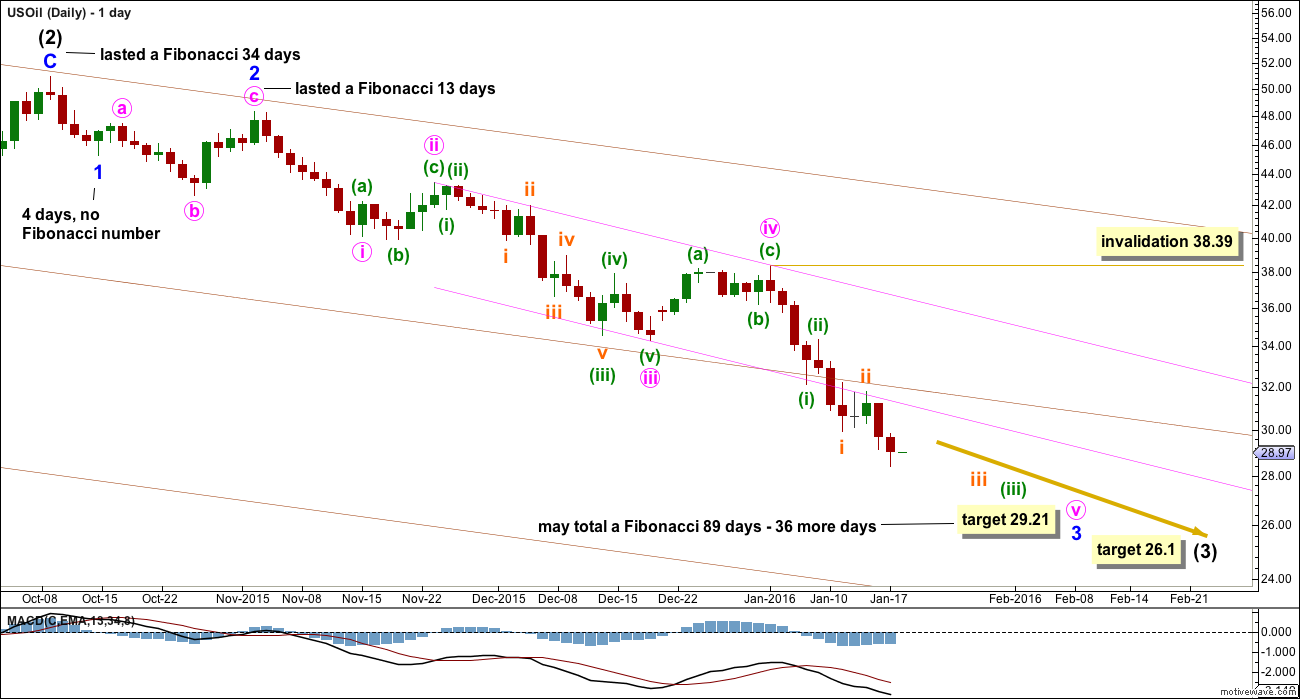
At 26.1 intermediate wave (3) would reach equality in length with intermediate wave (1).
Minor waves 1 and 2 are complete within intermediate wave (3).
Minor wave 3 is an incomplete impulse.
At 29.21 minute wave v would reach equality in length with minute wave iii. Both minute waves iii and v would be extended. Minute wave v may be stronger and may be relatively swift.
So far minor wave 3 has lasted 53 days. It does not look now like it could complete in a further two days to total a Fibonacci 55. The next number in the sequence is 89 which would see it continue for a further 36 days.
Both the pink channel and the maroon midline are now breached. These lines may now provide resistance for upwards corrections along the way down.
No second wave correction may move beyond its start above 38.39 within minute wave v.
If targets are wrong, they may be too high. Expect surprises for this market to be to the downside at this time.
TECHNICAL ANALYSIS
DAILY CHART
Click chart to enlarge. Chart courtesy of StockCharts.com.
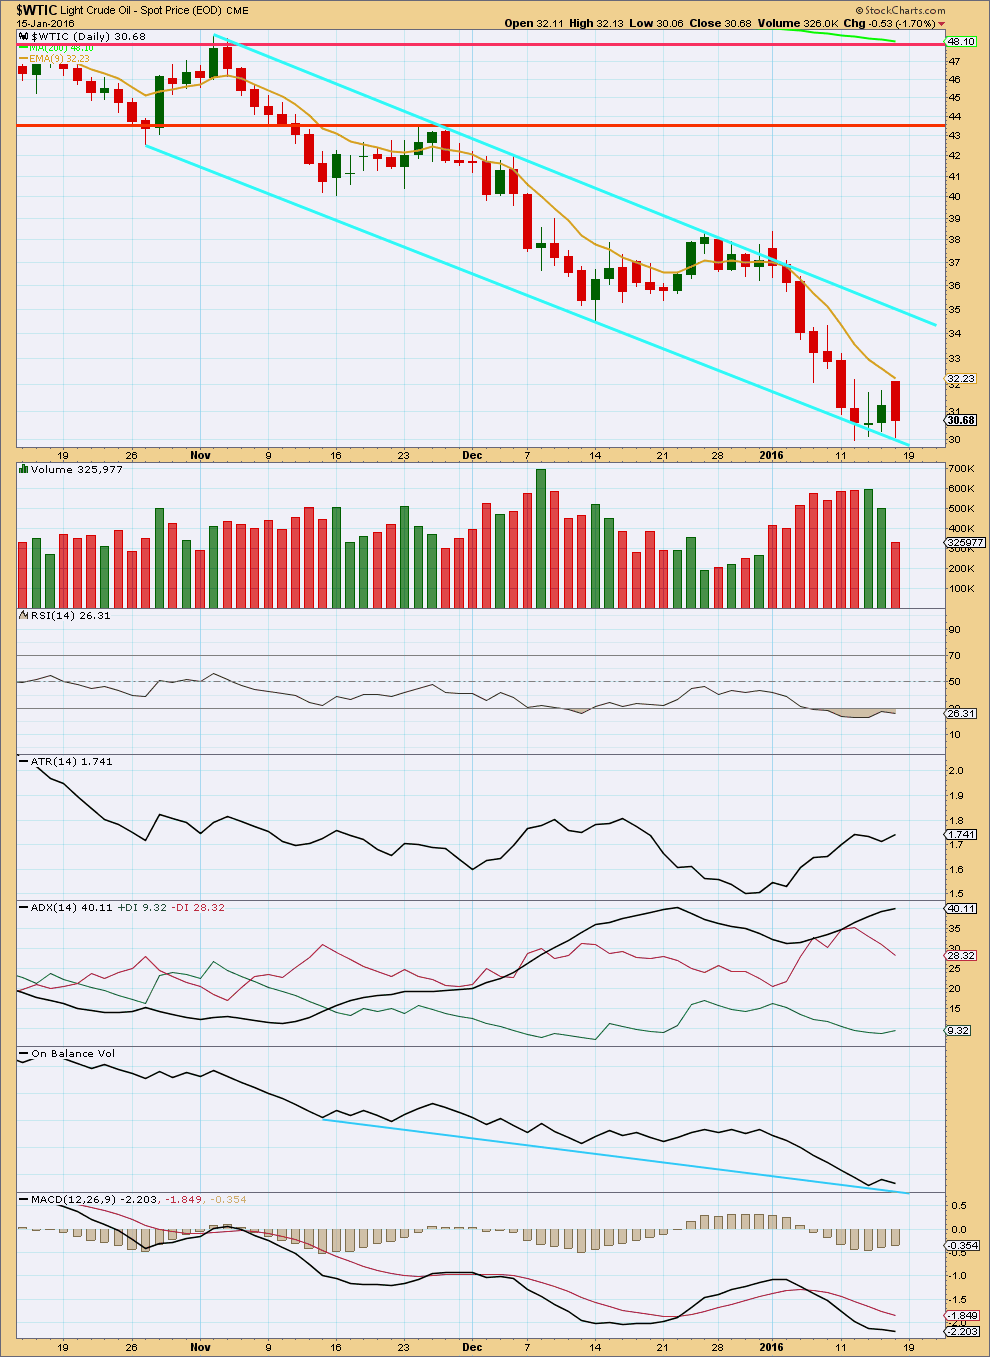
The volume profile continues to be bearish. As price falls volume rises, supporting the fall in price. As price rises volume falls.
RSI shows no divergence with price. Price has made a slightly higher low from the last low three days ago and RSI has done the same.
ADX is between 35 and 45; price is definitely trending. The trend is down. When ADX rises to 45 or above then the trend would be overextended. It is not there yet.
ATR agrees that the market is trending.
On Balance Volume shows no divergence with price. The blue line provides support and should be expected to continue to do so.
MACD shows no divergence with price.
At this stage, there is no warning of a short term interruption to this trend. This analysis agrees with the Elliott wave count.
As price continues lower it should find resistance at the 9 day EMA for small corrections along the way down.
This analysis is published @ 06:25 p.m. EST.
I am updating Oil this weekend, will be published shortly.
I think its really important that its updated before markets open next week.
Thank you all for your patience. The update will answer questions.
EWI analyst Steve Craig thinks we are in a 4th of 5th wave bounce.
3 min video
http://beta.elliottwave.com/Energy/Crude-Oil-Its-Still-Got-a-Long-Way-to-Go
Lara: It is helpful to see fib duration on chart below. That is an excellent idea. Hope gold charts will have similar comments.
I expect oil to bounce to 34 area to close to upper cayan line.
Then i will switch to short on Monday.
DWTI went parabolic which is unsustainable. Before the puncture I switched to UCO.
Plus the ADX D1 line was at lowest was a sign for turn. Both times at black arrows.
Kimble on Oil:
http://blog.kimblechartingsolutions.com/2016/01/crude-oil-creating-bullish-reversal-pattern-at-support-says-joe-friday/
Daneric on Oil:
“Oil may have finally bottomed in wave (3). Kind of a falling wedge pattern (with overthrow) that implies prices will rebound quicker than anyone expects. 60$ is not out of the question eventually in the next few months.”
Well, what is it? Minor wave 4 or intermediate wave 4? It is getting to be a big bounce.
Thanks
Anybody an idea how high up we will go?
If its a strt of intermediate 4 than expect it to go rocket high correction…and if its minor 4 than not too much is ther…
Lara vl update soon
+10% isn’t a bad correction..
I don’t know how to interpret the wave count in here, but I guess it can go all the way to the 20 day moving average, in the $33 to $34 area.
I think oil is getting clear that it is now in minor 4…the last leg down minor 5 for intermediate 3 is not far..waiting for lara’s update..
Oil did not even care of bad inventory data. Great analysis 🙂
Lara, today’s reversal from the lows was fairly impulsive, followed by the range trading. Do you think some temporary bounce is happening?
Not while US Oil remains below the cyan trend line I’m using on the daily chart.
It is still finding resistance there.
There will be corrections along the way. But only when that line is breached would I expect something bigger than just a small correction.
Hi Lara, what is the target for the current correction that is happening?
Hi Lara, when you say: “not while US Oil remains below the cyan trend line I’m using on the daily chart”, you mean the cyan trend line on the above chart on the original analisys or the cyan trend line on the chart below posted on the comments section?
I’m asking that because on the chart below on the comments section the cyan tend line has already been breach. And by cyan I mean light blue trendline.
Thanks for your answer, and I hope you answer because there are some people in here confused about that.
Thanks
Lara posted crude chart yesterday which showed crude below 27.5 approx…im not getting this chart anywhere…can anybody suggest me the link to get this chart…
Its right here in comments. Below.
:)) ..yaa it is there lara..
I was asking for live chart.. :))
Thank u
Lara is it also possible that the target of intermediate 5 may not make a new low below intermediate 3..??
Asked the above question bcoz Primary wave 5 does not look to have scope of extending more than .618 of Primary wave 3.
It could be truncated, but that should not be expected.
When intermediate (3) and (4) are complete then that is the time to consider where (5) may end.
It is premature to theorise on that too much at this stage.
The targets were inadequate.
At 23.54 minute v will = 1.618 X minute i.
At 24.25 minor 3 will = 4.236 X minor 1.
This gives a 0.71 target zone.
The target for intermediate (3) will be removed for now. When minor 3 and 4 are complete then I will again calculate a target for intermediate (3).
Expect surprises to the downside for this market still.
The cyan trend line is what I am using to trade this market. Each time price touches it I am considering adding to my short position. If that line is breached then a larger correction may have begun. I will start to use that line to move my stop down to protect profits in another day or two. For now I want to see if that line holds.
Thank you Lara, much better(update) than the one I saw on the moring:)
Thank u lara for such a gr8 analysis..
But if the fall continue like this than the target for cycle wave C will breach the trend line on monthly charts..??.. does that target dosent seem over extended..??..
Thank u again..
Minute v has passed equality with minute iii and the structure is incomplete. And so that is the next Fibonacci ratio in the sequence.
The target may or may not be met. What I am sure of today is price should keep falling.
Cycle C may very well overshoot the trend line. Sometimes C waves do that. Before it does though it should find support there.
When price gets there if the structure for cycle C is complete then it may end there. But if price gets to the trend line on the monthly chart and cycle C is incomplete then it may breach the line.
Thank u..
I was hoping for the quality update after waiting for a week…(to have a quality trade) well guess not..
Are US oil hitting correction?
This analysis predicted US Oil to fall. Over the past few weeks I have been predicting US Oil will fall and that is what it has done. I am profiting. Many members here are profiting.
Your comment insinuates this analysis is not “quality”.
Please read the comments policy. Your comment does not meet our policy. The tone is rude.
Hi, you say the target for minor 3 is 29.21 but we have already passed this price. Should it be lower or has the wave completed already?
I am sorry, yes we have.
The structure of minor 3 is incomplete. It has to keep moving overall lower.
The next target for minute v would be 1.618 X minute iii = 23.54.
Which is below the final target for intermediate (3).
I should remove the target for minor 3 and just wait until there is more structure within it, and wait for a trend line along the top of it to be breached before I expect it is over.
I think that is the safest route. And that is the one I will trade.
The next target for minute v would be 23.54?
After that we should get minor wave 4 and then minor wave 5 to complete intermediate wave 3.
Does that means that the target for intermediate wave 3 should be around 20 sometime in February?
That is what ones conclude from your analysis.
Thanks for your answer.
I have the same question Lara, in order to be clear. Minute v target of this Minor 3 is 23.54? Then minor 4 for a rebound and finally down again in Minor 5 to at least 23.54 I suppose. Thanks in advance Lara.
Lara wrote: ” It does not look now like it could complete in a further two days to total a Fibonacci 55.”
Does “It” means intermediate wave 3 to target 26 in complete in 55 days?
Thanks. i am out of US oil short with profit at below 30. Thanks Lara.
Yes. That is what “it” means.
Thanks Lara. On the chart notation” may last fib… 89 days.. ” is pointing to target 29.21 instead of int wave (3) target 26.2.
In next Monday report you may edit this.
Yes, I am sorry, I will.
I should have removed that target for minor 3.
Come on Papudi, don’t miss out, there is still a long way to go from here to $24 or even $20. Who knows.
I’m fully invested in DWTI, thats -3x on West Texas Oil.
Come on, the party is just begining.
Cheers
We are already below the target ??? Is this the wrong update?
No. I should have removed the target.