
The bear Elliott wave count was invalidated by a new high above 16.45. I have just one bull wave count now for GDX.
Summary: GDX is in a bull market confirmed by price.
New updates to this analysis are in bold.
MONTHLY ELLIOTT WAVE COUNT
Click chart to enlarge.
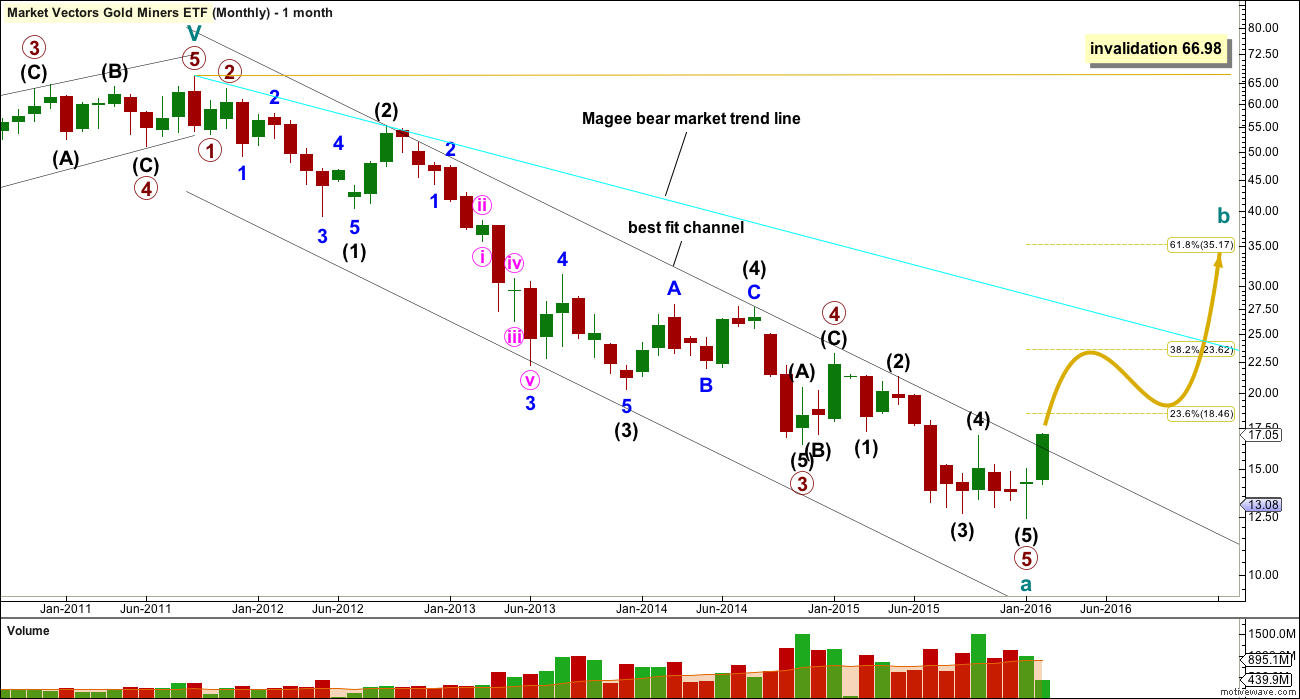
This wave count is changed from the last monthly wave count. The the reason for the change is downwards wave labelled primary wave 5 looks like and subdivides perfectly as a five wave impulse.
I have also moved the degree of labelling all up one degree.
The whole wave down for cycle wave a subdivides well as a five wave impulse. However, GDX does not have adequate volume to produce typical looking Elliott wave structures. As always, this wave count comes with the strong caveat that this market is not sufficient in volume for a reliable Elliott wave analysis. It is a rough guide only. The direction expected from the Elliott wave count should be fairly reliable, but targets and invalidation points may not be.
Ratios within cycle wave a are: there is no Fibonacci ratio between primary waves 1 and 3, and primary wave 5 is 0.33 short of 0.236 the length of primary wave 3.
Ratios within primary wave 3 are: intermediate wave (3) is 3.48 short of 1.618 the length of intermediate wave (1), and intermediate wave (5) has no Fibonacci ratio to intermediate waves (3) or (1).
Ratios within intermediate wave (3) are: minor wave 3 has no Fibonacci ratio to minor wave 1, and minor wave 5 is just 0.02 longer than equality in length with minor wave 1.
Ratios within minor wave 3 are: minute wave iii is 0.38 longer than equality in length with minute wave i, and minute wave v has no Fibonacci ratio to either of minute waves i or iii.
Within primary wave 5, there are no adequate Fibonacci ratios between intermediate waves (1), (3) and (5).
The black channel is a best fit; this movement does not fit into an Elliott channel. The channel is not yet breached by a full daily candlestick above it and not touching it. However, a new high above the end of intermediate wave (4) at 17.04 has provided price confirmation of a trend change.
If it is correct that cycle wave a has subdivided as a five wave structure, then this tells us two things:
1. The bear market for GDX must be incomplete because a five may not be a corrective structure, so this must only be wave A.
2. Cycle wave b may not make a new high above the start of cycle wave a at 66.98.
Cycle wave b may be any one of 23 possible corrective structures. It may be a swift sharp zigzag, or it may be a sideways structure such as a flat, combination or triangle. It should last one to several years.
The first movement up for cycle wave b must be a clear five wave structure for a trend of this magnitude.
DAILY ELLIOTT WAVE COUNT
Click chart to enlarge.
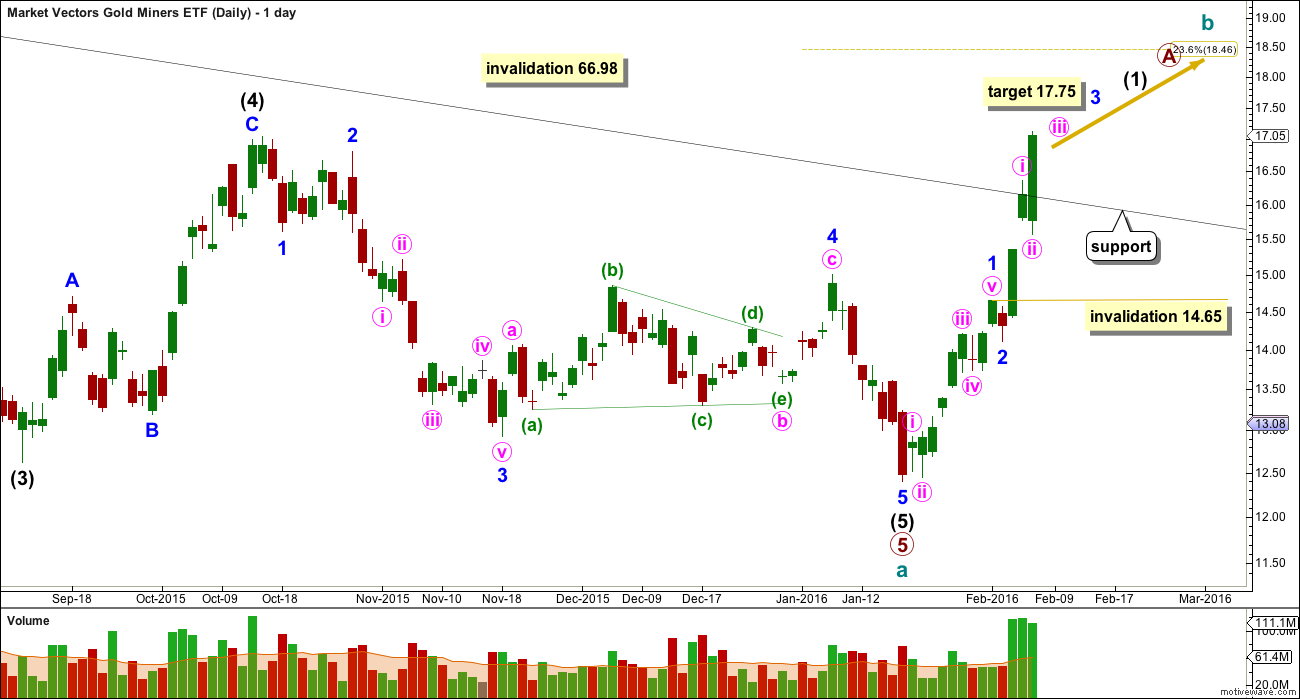
So far the first five up at intermediate degree is incomplete.
An impulse may be complete and is labelled minor wave 1. The next impulse up for minor wave 3 looks to be incomplete. At 17.75 it would reach 1.618 the length of minor wave 1.
When minor wave 3 is complete, then minor wave 4 should unfold lower and may not move into minor wave 1 price territory below 14.65.
Now that price is above the upper edge of the best fit channel downwards movement may find support at that trend line.
TECHNICAL ANALYSIS
Click chart to enlarge.
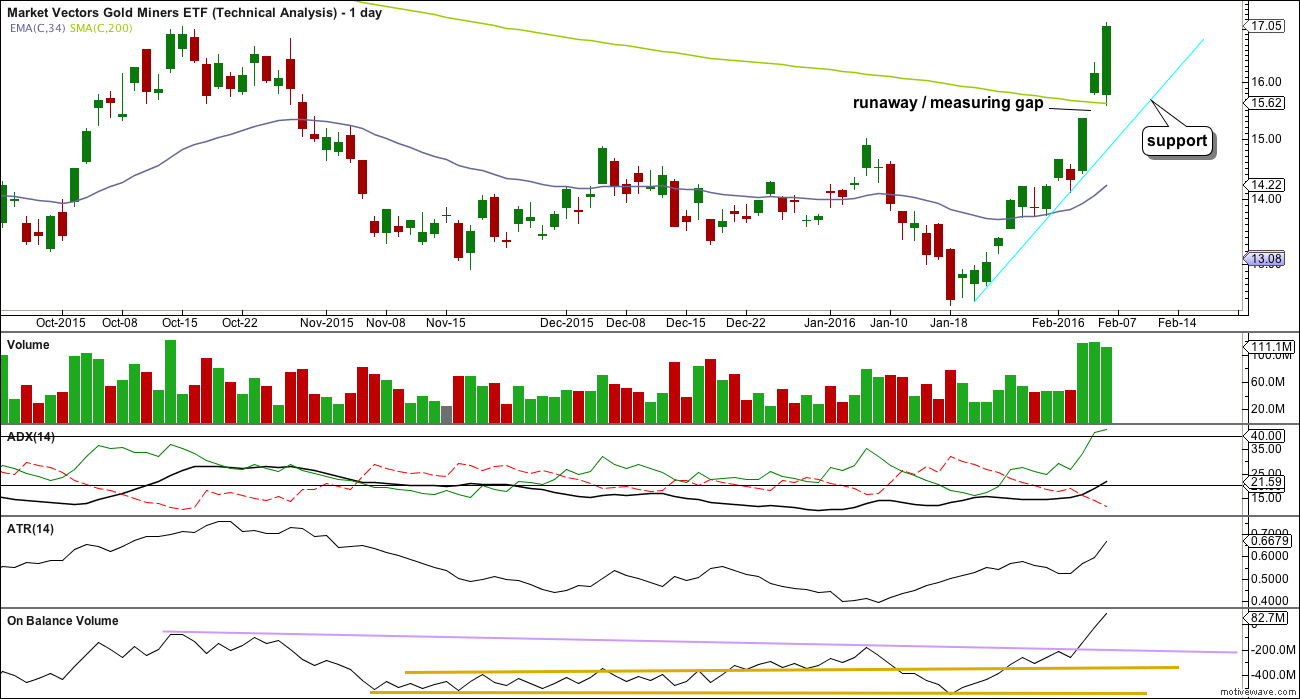
The rise in price is supported by volume.
The gap noted on the chart would give a target for upwards movement to 18.52. The upper edge of the gap found support at the 200 day moving average.
ADX indicates there is a trend and it is up. ATR agrees that there is a trend.
The break above the lilac line by On Balance Volume is very bullish.
The trend is up. Corrections present an opportunity to join the trend. The cyan trend line may provide support, as may the 34 day exponential moving average.
“The bear market for GDX must be incomplete because a five may not be a corrective structure, this must only be wave A.”
Well right if you cut off the GDX chart and count from the 2011 top….. but the top is in 2008 and the whole structure is expanded flat and this is not A this is C.
Why do you ignore the complete chart?!?!?!?!?
Please read the comments policy.
This is not YouTube, on this website I insist on a polite and respectful manner in comments at all times.
The data I have goes back only to September 2007. I had seen the rise to the high of September 2011 as an ending contracting diagonal. But TBH it doesn’t have a typical look. If that is a zigzag for a B wave that makes more sense.
So thank you for the idea
And again, please read the comments policy. A polite and respectful manner means that people are more willing and comfortable to share ideas. That is what I am trying to promote on my websites.