
Upwards movement was not expected for Thursday’s session.
Summary: The trend is up. Another shallow brief fourth wave should continue for one or three days. It may end about 1,214 or 1,184.
New updates to this analysis are in bold.
Last published weekly charts with the bigger picture are here, with video here.
DAILY ELLIOTT WAVE COUNT
Click chart to enlarge.
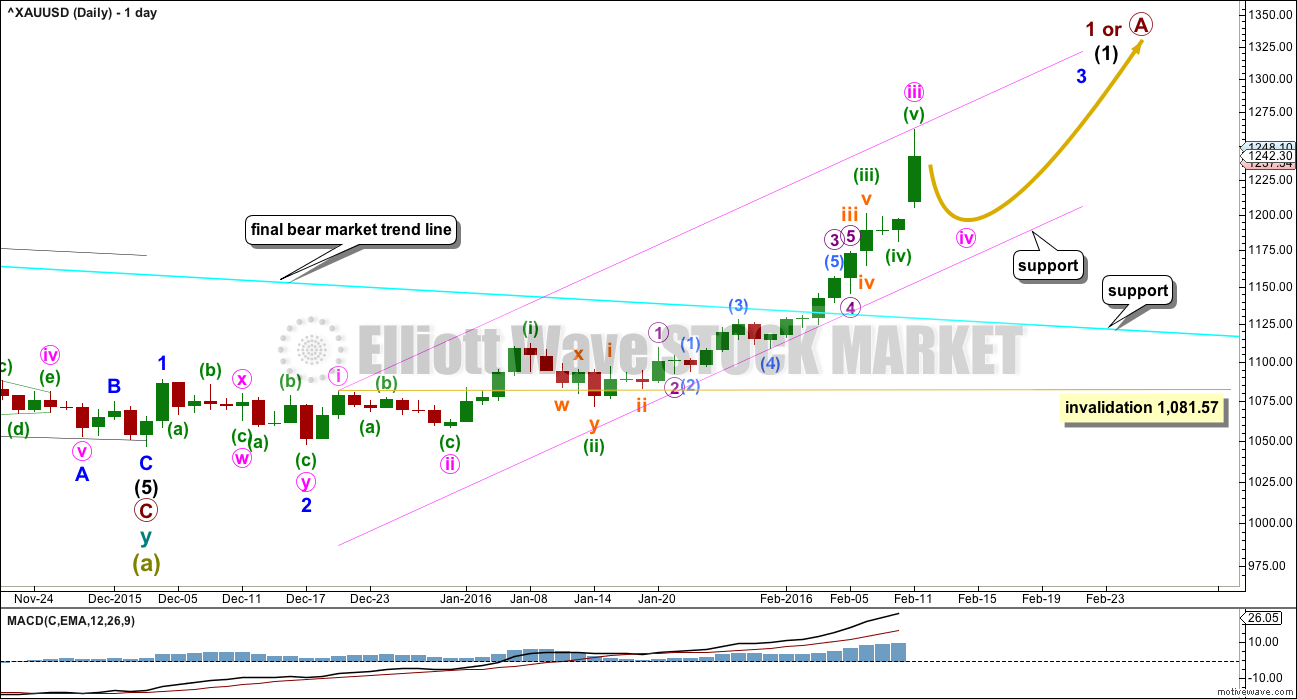
A new high above 1,191.37 has invalidated the bear wave count and confirmed that Gold is now in a bull market.
Super Cycle wave (b) may be any one of 23 possible corrective structures. First, a move of this size should have a clear five up on the daily and weekly charts. That is still to complete.
So far, within the first five up, the middle of the third wave is now most likely complete. The strongest move may still be ahead. Gold typically exhibits swift strong fifth waves to end its third wave impulses. Look out for surprises to the upside for minute wave v and minor wave 5.
When minute wave iv is complete, then a target will again be calculated for minor wave 3 to end.
Minute waves i, ii and now iii are most likely complete within minor wave 3.
The fourth wave corrections are so far more brief and shallow than expected within this impulse unfolding upwards. This pattern may continue, which is why I say look out for surprises to the upside. Gold typically exhibits swift strong fifth waves to end its third wave impulses, and this often forces the fourth wave corrections which unfold right before to be over more quickly and be very shallow. It gives Gold’s impulses a curved look at a higher time frame.
The pink channel is a best fit. Draw the first trend line from the highs labeled minute waves i to iii then place a parallel copy lower to contain the whole upwards wave. Minute wave iv should find strong support at the lower edge if it gets that low.
Minute wave ii was a deep 0.68 zigzag. Minute wave iv should be shallow and may be a flat, combination or triangle most likely. Minute wave ii lasted 7 days. Minute wave iv may be over in a Fibonacci 3 or 5 days.
HOURLY WAVE COUNT
Click chart to enlarge.
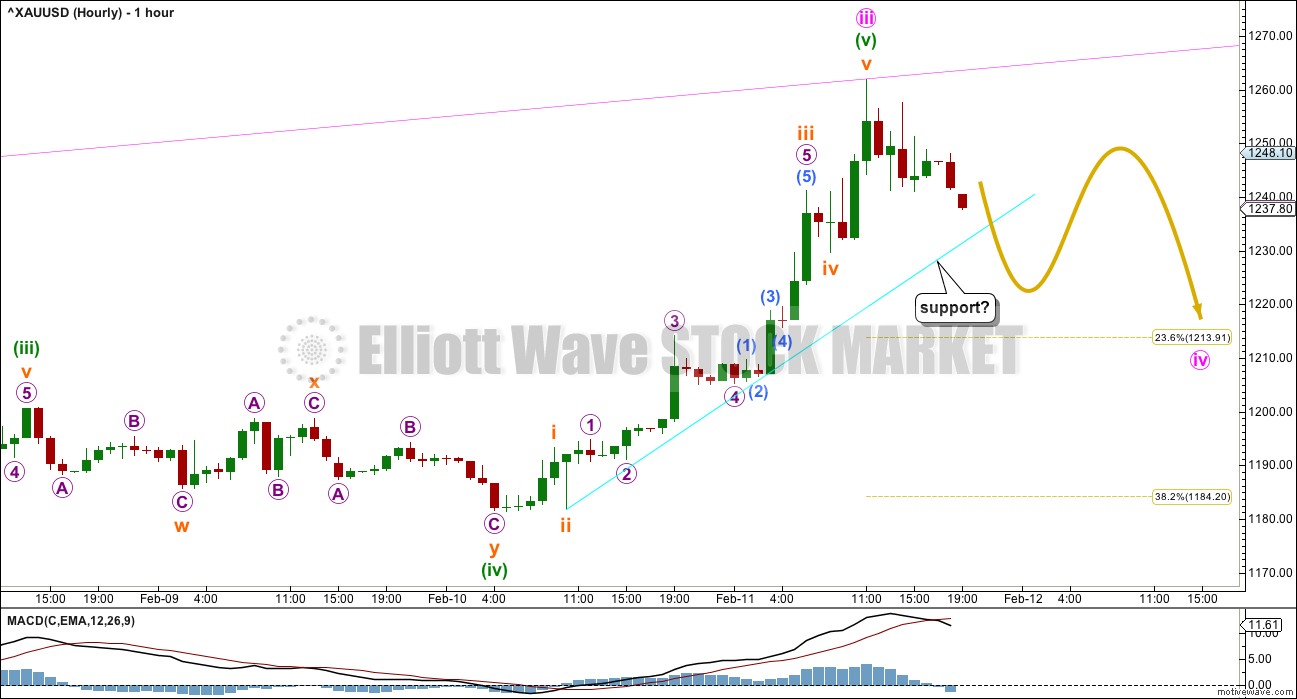
Minute wave iii has no Fibonacci ratio to minute wave i.
Ratios within minute wave iii are: minuette wave (iii) is 11.47 short of 2.618 the length of minuette wave (i) and minuette wave (v) 0.37 longer than 0.618 the length of minuette wave (iii).
Ratios within minuette wave (v) are: subminuette wave iii has no Fibonacci ratio to subminuette wave i, and subminuette wave v is 1.70 short of 2.618 the length of subminuette wave i.
The structure of minuette wave (v) is very likely to be over. The alternate below looks at the possibility that it is not. This main wave count has a higher probability.
Initially minute wave iv may find some support at the cyan trend line. It is likely to then break through support there. A breach of that line would provide confidence that a multi day correction should be underway.
When minute wave iv may possibly be a complete structure, even if it looks to be brief, then it may be over.
It should be shallow to exhibit alternation with minute wave ii, so the 0.236 Fibonacci ratio at 1,214 and the 0.382 Fibonacci ratio at 1,184 would be reasonable targets.
The 0.382 Fibonacci ratio would see minute wave iv end within the price territory of the fourth wave of one lesser degree which is from 1,200.67 to 1,181.66.
ALTERNATE HOURLY WAVE COUNT
Click chart to enlarge.
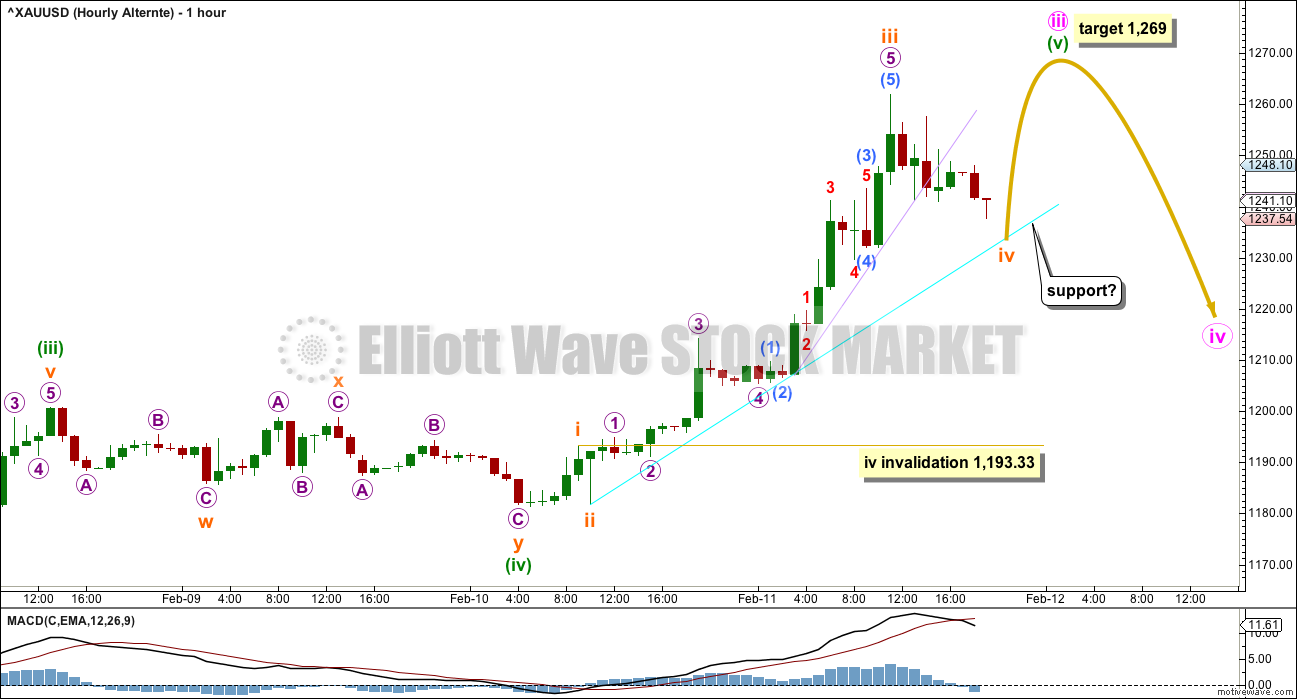
It is my judgement that this alternate has a lower probability. Gold often ends third wave impulses with a swift sharp spike, so the main hourly wave count should be expected to have a higher probability.
If price does not manage to break below the cyan trend line and it turns up to make a new high, then a reasonable target for minute wave iii would be at 1,269 where minuette wave (v) would reach 1.618 the length of minuette wave (i).
Within minuette wave (v), the fourth wave correction of subminuette wave iv may not move into subminuette wave i price territory below 1,193.33. Unfortunately, this price point may not be a useful confirmation point for the main hourly wave count. The cyan line should be used instead to differentiate between the two counts.
TECHNICAL ANALYSIS
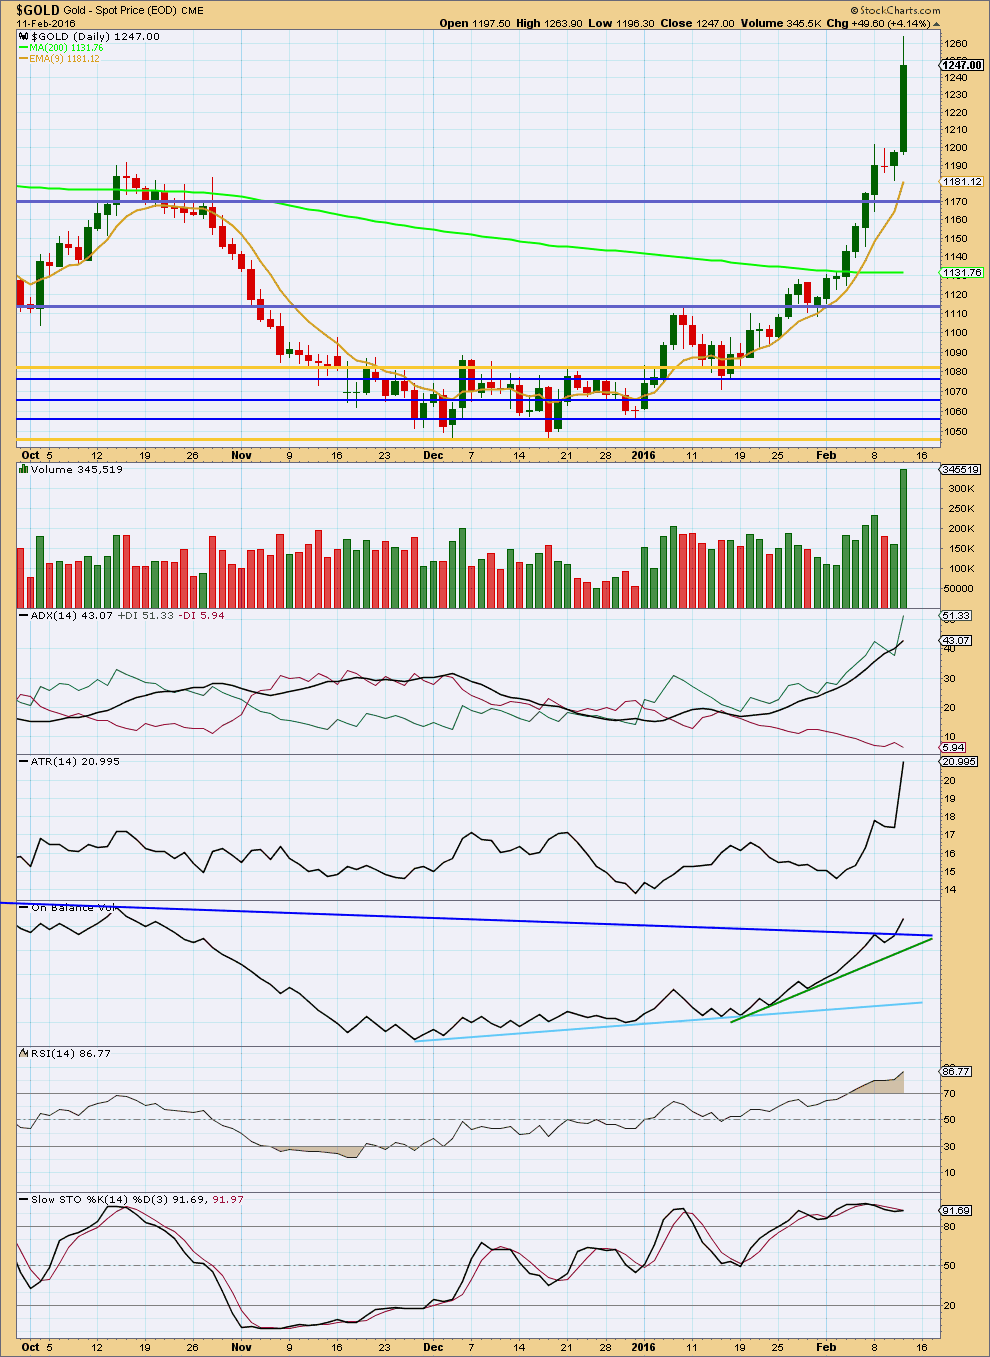
Click chart to enlarge. Chart courtesy of StockCharts.com.
A strong upwards day with a strong spike in volume looks like a typical blowoff top for Gold. A correction should be expected as very likely from here.
There is no divergence with price and RSI, but that is not always seen at the end of a trend. RSI has been extreme now for six days. This indicates a correction will come.
ADX and ATR strongly agree that there is a trend and it is up. Downwards movement should be expected as a correction against the trend and taken as an opportunity to join the trend.
On Balance Volume has now broken above the final line of resistance. This may offer a little support. If it is breached, the green line may offer support.
There is divergence today with the strong new high from price and Stochastics. This supports the idea of a correction to unfold about here.
This analysis is published @ 08:18 p.m. EST.
Is Feb 12 report on gold not out yet???
It was late.
It took me most of my Saturday (after NY closed and StockCharts data was available).
Sometimes it just takes longer than usual.
I didn’t get it ready for Cesar to proof in time for it to be published my Saturday.
Just a View: Huge week for Gold price up from 1164 to 1264~! On Friday Gold price really did not retrace enough to loose the overbought daily RSI which continued to tag 80+…. With a narrow range inside day of Friday, expecting a pullback (drop) from around pivot…. Generally 5dma has been cradling the drops on the way up from 1164, expect it to hold…. 50% retrace of weekly H 1264 / L 1164 looks about right…. I guess we will know on Monday!
Gold’s Outperformance: This Time, It May Really Be Different
Feb. 10, 2016 3:23 PM ET
http://seekingalpha.com/article/3884276-golds-outperformance-time-may-really-different
Amazing Gold Article and Charts!!!
Miners are on a strong climb as they adjust to high gold prices.
Gold closes at 1238.06 25.84 below Thursday high of 1263.90 and GDX closed at 18.84 above Thursdays high of 18.65 DUST closes down 8%.
Wed GDX low at 10:33 am EST then up to the close
Thurs GDX low at 9:58 then up to the close
Friday GDX low at 9:32 then up to the close
For those trading gold or silver futures : per options xpress. “All foreign futures markets will be open Sunday evening AND MONDAY (as well as foreign stock exchanges Monday. The NYMetal exchange and COMEX will trade normally from Sun night untill 12:00 NOON Monday Presidents Day”
The main hourly wave count will be the only wave count today.
It is too early to tell what corrective structure is unfolding, but so far it could be a triangle.
Or it could be a zigzag with the triangle a B wave.
I am going to spend some time today going back over the last big impulse in that bear market that I analysed as it unfolded. I want to look and see how Gold behaved after a fifth wave spike within a third wave. How often did it do that? When it spiked on high volume and then corrected straight after, how long did the correction last? Did it do another spike for the next fifth wave as well?
This is what im loving in this elliott wave theory…no matter if we miss the chance of getting profits,but it ensure us that we will be away from lossess…
Laras efforts are remarkable…her guaidance is a profitable map..
OIL and GOLD both the commodity is giving a chance here…minutte 4 corrective wave is running for both…can add longs GOLD and also can go short in OIL..
I feel that intermediate 3 for oil will end in the $22-$24 range with the whole bear market with intermediate 5 to end in $20-$22 range…
From many months OIL and GOLD are going in opposite direction…After the oil shifting to bull very soon… is it possible for gold to continue its upward trend.??
Any comments..??
Of course it is not only possible ,but likely that when oil finally turns up that gold will rise with it. This has usually been the case in the past; for oil and gold to trade in the same direction, but now gold is not trading on inflation but as a safe haven from international currency problems. When oil turns up this will be considered ,at some point, INFLATIONARY, and so gold will rise with oil (as it has during past inflationary episodes. IMVHO( and experience in both the oil and gas business and precious metals mining business and as a business analyst).
I agree your view stephen..
Yes it is possible that when oil will move up…it will initially move stock market…that will hardly effect gold bull run..the inflationary point is a gud one..
The final bear market trend line is drawn on weekly and daily charts on a semi-log scale from the price points as marked. At the end of today February 12th this has now been breached by seven full daily candlesticks above it and not touching it. If this line is breached by a full weekly candlestick (the earliest that could be would now be THIS week), then all bear wave counts should be discarded.
I did buy a little DUST 2 seconds from the close Thursday and sold it at 9:32 am Friday 3 cents off the high for a profit before it immediately began dropping to it’s day low at 10 am.
A breach of the cyan trend line has occurred providing confidence in a multi day correction, 1-3-5 days to targets at 1,214 and at 1,184. I checked both hourly charts and and the Cyan trend line has been clearly breached by several hourly candlesticks. This supports the main hourly wave count and not the alternate hourly wave count. Now, “When minute wave iv may possibly be a complete structure, even if it looks to be brief, then it may be over.”
ANY WAVE COUNTS? – By the way US markets are closed Monday Feb 15th.
Lara,
there is a point of view that confidence with changed trend from down to up comes with each low in price higer than preceding low on higher timeframe.
Do we need another higher low than 1045 for that confidence?
Thank you Lara so much for your excellent work!
Yes, I would think so.
And I’m guessing that a lack of confidence would be why second wave corrections can be so deep. That would make sense.
Lara:”A breach of that line would provide confidence that a multi day correction should be underway.”
Has gold broke below the cyan line???
Yes, very clearly too.
And today will complete a red candlestick so that’s more confirmation of a correction.
Danerics big picture view on gold
Nice chart. How does he know ahead of time that wave B will end there?
Per EWP rules cycle wave b can be 23 different structure and final top depends on structure of wave b.
Does He write about it in the text??
Here’s the link. He doesn’t say much.
http://danericselliottwaves.blogspot.com/2016/02/elliott-wave-update-11-february-2016.html
Lara is the only one explains her counts according to EW rules and guidelines.
Denarics is a good analyst though.
Is it time to call the bottom in gold?
EW – Avi Gilburt – Feb 11, 2016 1:51 p.m. ET
http://www.marketwatch.com/story/is-it-time-to-call-the-bottom-in-gold-2016-02-11
I have removed Dror from this membership. He will not be returning.
I am sorry for the delay on moderation of his comments. I was out this evening with family and returned to see what had happened.
His comments have been removed because they do not meet comments guidelines and are not helpful to anyone.
I am sorry if any members were offended or feel their time was wasted with that.
Please let us continue as we were. Let us not expend any energy on negativity. I have learned something from my mistake in yesterdays analysis. Let us all move forward and look for the next profit together.
Thank you all for your patience.
Members replies to Drors comments have also been removed when I removed his comments.
I have been a stubborn gold bear for several years now and am, believe it or not, still in that camp. Nonetheless, the bear market in gold specifically – not miners, because they may deviate somewhat from gold at times like these – is relatively close to being over.
I’ll be the first to admit that I did not expect gold to rocket up as it did. However, after reassessing prices, I feel confident enough to call a longer term top here.
Take what you are reading here with a grain of salt, because it does not necessarily mesh with EW. Draw a trendline from the tops on 8/28/13 and 3/16/14, extend it out to today, and you’ll notice that gold stopped right there. Coincidence, or is this just a good spot for a break? You can even add a parallel line below the lows during that whole time period and you’ll see that it contains all of the movement of the last few years.
Gold is way above its 200 day MA and RSI is smoking hot, which is why a correction is very overdue.
Gold is seasonal and an intermediate top here would fit right in that pattern.
I wouldn’t be surprised if stocks had a relief rally right about now and the dollar too. As should be obvious by now, gold tends to react inversely to these markets.
Realistically, at least to me, gold should move down over the next few months to make an interim low (maybe April/May), perhaps with some upward movement again and a final drop into the end of 2016.
As for how low gold goes, it’ll probably stay within the above described channel or dip slightly below (upper 900s).
With everyone and their mothers suddenly extremely bullish, I would be cautious.
Matt, I agree that we have reached some strong resistance. Another example is shown in the attached chart by PK. That said, there are many reasons for gold moving into a bullish phase: negative interest rates are hurting European banks, low oil prices are pushing countries to near bankruptcy, stock markets are moving into bear markets, and of course, “the fear trade” is back. I think gold and miners go much higher in the coming months.
I agree with all of your fundamentals, except the timing may be delayed. Stocks often have a rally phase at this time of year and we are certainly due for that. Many will perceive these to be discount prices. Then, as prices move up, the masses join in to give it that last push. Yes, long term, gold will certainly rise and stocks will drop. Short term, over the next few months, it may well be the other way around.
I would also add that the supposed end of this bear market was very undramatic. It should spike down, and I think still will do so.
Gold could move down $100 and still look healthy to bulls. The next rise after that is when the difference will be noticed.
Dont you mean “Gold could move to $1000 and still look healthy to bulls”, NOT $100.?
I think he meant gold could move down $100 from 1240 to 1140 and still look healthy to bulls.
Richard stated it correctly.
I like the trend line. I’ll add to my daily chart. Thanks Matt!
I am concerned that my expectation of a brief shallow correction may not actually materialise. It could be deeper, and maybe last a couple of weeks.
I’m going to spend some time today going back over the last big downwards wave and take a look at behaviour after a fifth wave spike within a larger impulse. It’s been a while since I saw that move unfold and I need to refresh and remember the lessons I learned as it did.
Lara, you mention correction maybe a couple of weeks.
Yesterday at the gold high of 1,262 area Jeffrey Kennedy trader teacher with Elliott Wave international was asked about gold and brought gold chart up live and said, “He would not buy gold right now. Just leave it for a couple of weeks and then buy it back down in the 4th wave at about 1,200 to 1,190.”
He only spoke 4 minutes about gold so I don’t know how he came to a couple of weeks? Starting summer 2013 I used to be with both EWI and you but I dropped them after a year because their gold analysis not with Jeffrey Kennedy was not good enough to trade with.
Well a print at 1214 today would be close enough to 1200 for me instead of taking a chance to wait a couple weeks for 1200 to 1190 (which may or may not happen). I also am told that gold will trade until noon on monday by options xpress, Still i am long at 1214 today , if seen.
Matt, my analysis has a top in at 1263 or coming this week. The Swaps have taken positions from the 1130’s to the 1260’s, I’m ball parking an average short position for swaps at around 1180-1200. They tend to generate 8% or more on their positions, so I’m looking for about 1090 by end of April.
Just a reminder: Markets in the US are closed Monday, Feb 15th for Presidents Day
Thanks I had no idea.
I BELIEVE GOLD MARKET AND POSSIBLY OTHER MARKETS ARE OPEN UNTIL 12:00 NOON MONDAY . Check it out with your broker.
It appears NYSE is closed all day Monday.
https://www.nyse.com/markets/hours-calendars
NYSE may be closed all day but I was told by options xpress that gold would trade on comex until noon