
A correction was expected to continue.
Downwards movement overall was expected.
Summary: The correction is incomplete. It may end in another one, three or six sessions to total a Fibonacci three, five or eight daily candlesticks. It may end within a range of 1,200.76 to 1,181.41. Within this range, the most likely target is 1,184.
New updates to this analysis are in bold.
Last published weekly chart is here.
DAILY ELLIOTT WAVE COUNT
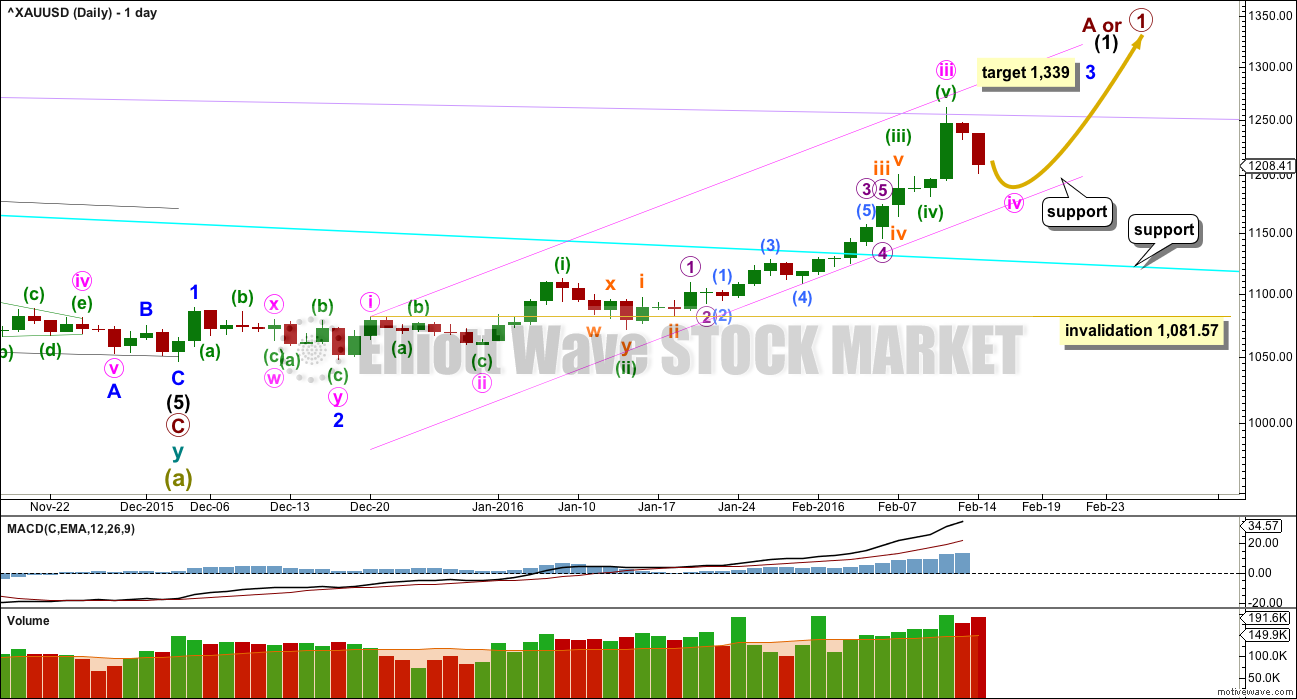
Click chart to enlarge.
The cyan trend line is now breached by a full weekly candlestick above and not touching it. This gives substantial confidence that Gold has very likely changed from bear to bull.
So far, within the first five up, the middle of the third wave is now most likely complete. The strongest move may still be ahead. Gold typically exhibits swift strong fifth waves to end its third wave impulses. Look out for surprises to the upside for minute wave v and minor wave 5.
At 1,339 minor wave 3 would reach 6.854 the length of minor wave 1. When minute wave iv is complete, then this target may also be calculated at minute degree. At that stage, it may widen to a zone or it may change.
Minute waves i, ii and now iii are complete within minor wave 3.
The fourth wave corrections are so far more brief and shallow than expected within this impulse unfolding upwards. This pattern may continue, which is why I say look out for surprises to the upside. Gold typically exhibits swift strong fifth waves to end its third wave impulses, and this often forces the fourth wave corrections which unfold right before to be over more quickly and be very shallow. It gives Gold’s impulses a curved look at a higher time frame.
The pink channel is a best fit. Draw the first trend line from the highs labeled minute waves i to iii then place a parallel copy lower to contain the whole upwards wave. Minute wave iv should find strong support at the lower edge if it gets that low.
Minute wave ii was a deep 0.68 zigzag. Minute wave iv should be shallow and may be a flat, combination or triangle most likely. Minute wave ii lasted 7 days. Minute wave iv may be over in a Fibonacci 3 or 5 days. If it is longer lasting, then it may total a Fibonacci 8 days.
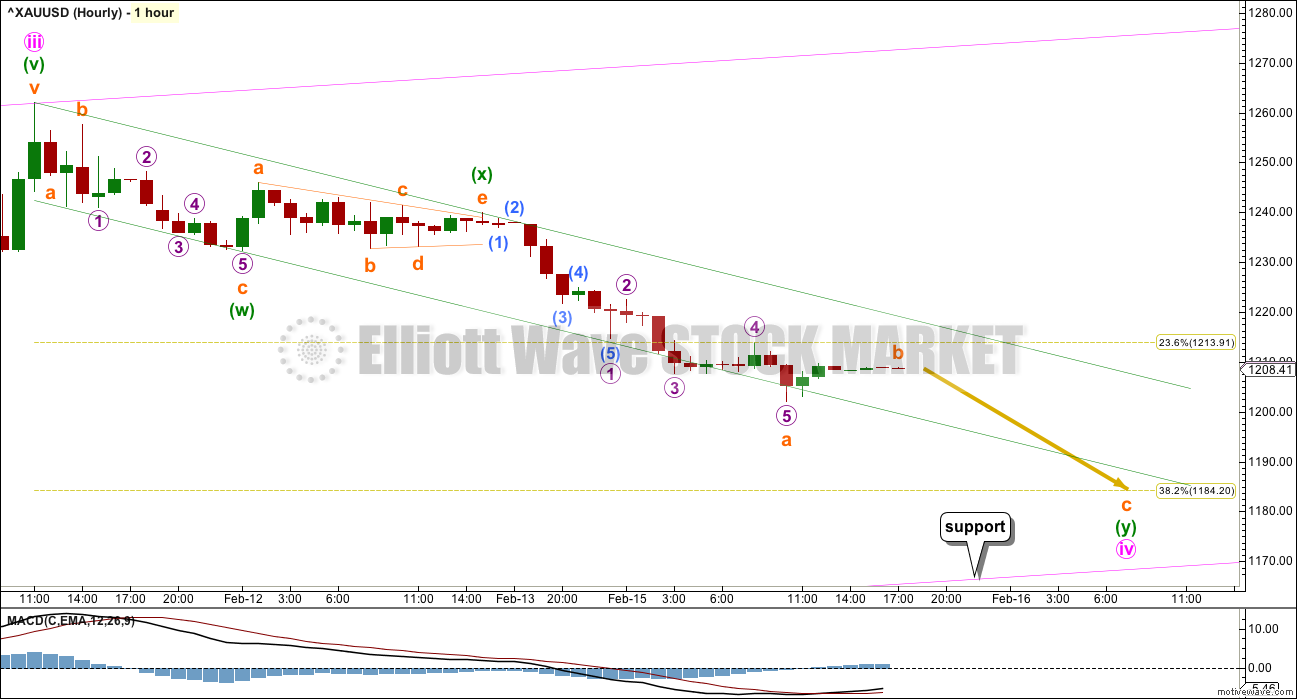
MAIN HOURLY WAVE COUNT
Click chart to enlarge.
Minute wave ii was a deep 0.68 zigzag. So far minute wave iv may be a double or single zigzag. It may exhibit alternation in depth but not much in structure. Alternation is a guideline, not a rule, and sometimes is not perfect.
The first zigzag in the double is joined by a “three” in the opposite direction; minuette wave (x) fits perfectly as a triangle.
Within minuette wave (y), the structure looks to be incomplete. Subminuette wave a may be a complete impulse. Subminuette wave b may be unfolding sideways as a small triangle, but this may yet morph into a flat or combination. Subminuette wave c should move price lower. It may take minute wave iv down to the 0.382 Fibonacci ratio at 1,185.
Minute wave iv may end within the price territory of the fourth wave of one lesser degree. Minuette wave (iv) has its territory from 1,200.76 to 1,181.41. The 0.382 Fibonacci ratio sits within this range at 1,185, so it is a reasonable target. It would see minute wave iv end as a shallow correction, so it would exhibit alternation in depth with minute wave ii.
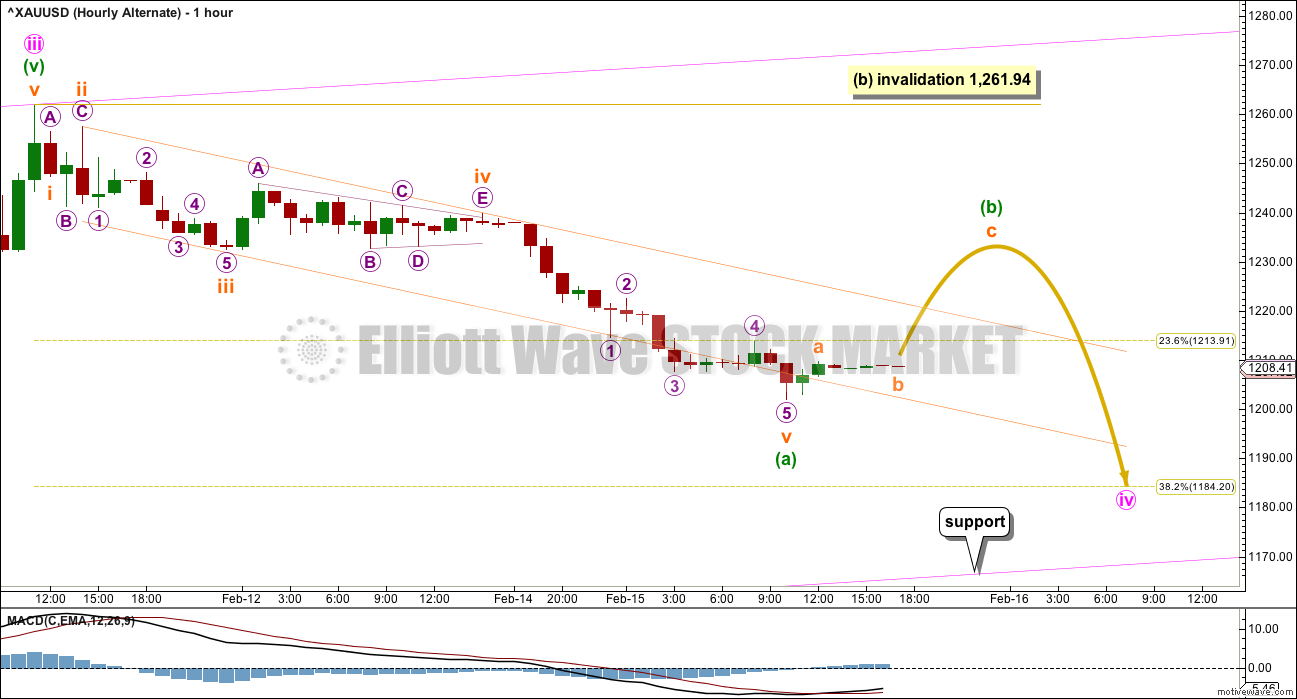
ALTERNATE HOURLY WAVE COUNT
Click chart to enlarge.
Downwards movement will also fit as a complete five wave impulse. This may be minuette wave (a) of a zigzag.
Fibonacci ratios within minuette wave (a) are: subminuette wave iii is 1.26 longer than 1.618 the length of subminuette wave i, and subminuette wave v is 0.55 short of 2.618 the length of subminuette wave i.
The channel is drawn about minuette wave (a) using Elliott’s second technique. Draw the first trend line from the ends of subminuette waves ii to iv, then place a parallel copy on the end of subminuette wave iii. When this orange channel is breached by upwards movement, then that shall provide trend channel confirmation that minuette wave (a) is complete and minuette wave (b) is underway. However, it is also possible that minuette wave (b) may be brief and remain contained within the channel.
Minuette wave (b) may not move beyond the start of minuette wave (a) above 1,261.94.
When minuette wave (b) is complete, then minuette wave (c) should move below the end of minuette wave (a) to avoid a truncation. It may end about the 0.382 Fibonacci ratio at 1,184.
If minute wave iv is deep enough, it may find support at the lower edge of the pink channel which is copied over from the daily chart.
TECHNICAL ANALYSIS
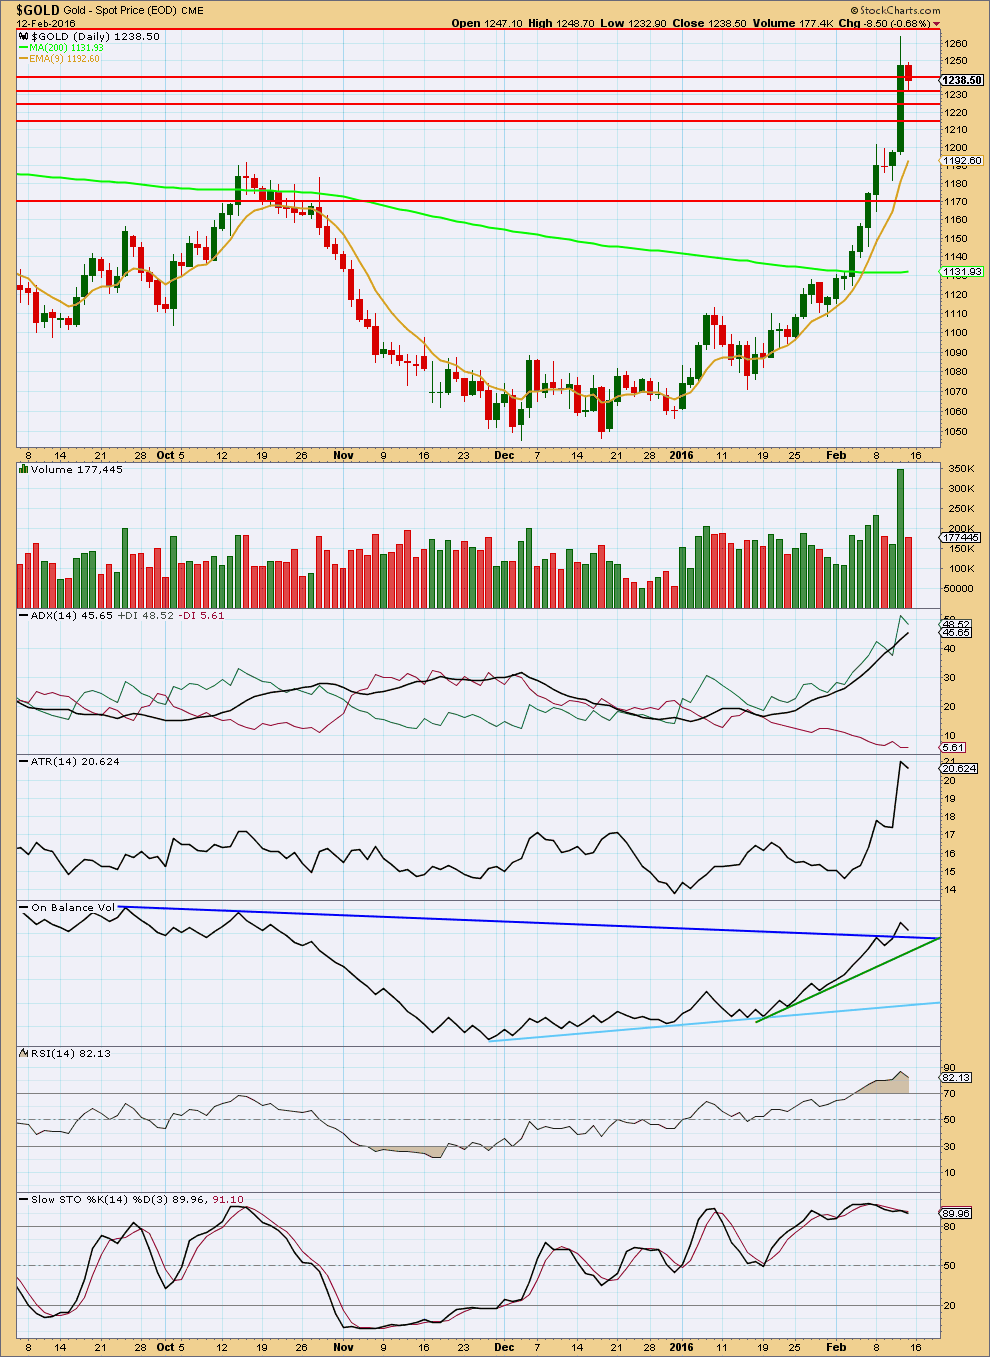
Click chart to enlarge. Chart courtesy of StockCharts.com.
Note: StockCharts will not have data for Monday’s session because New York is closed. This chart is unchanged.
Volume from COMEX data indicates that downwards movement for Monday comes with an increase in volume. This strongly suggests that downwards movement is not over and more downwards movement should be expected. This supports the Elliott wave count short term as it expects more downwards movement. It does not support the idea that price is in a correction and indicates that a new downwards trend may be beginning. However, one day’s data is not enough for a conclusion that Gold is now in a downwards trend. If in a few more days volume continues to increase, then the wave count will be in doubt. But if in a few more days volume is declining, then it would support the wave count.
A strong upwards day with a strong volume spike for Thursday looks like a typical blow off top for Gold. Friday’s small red candlestick would most likely be just the first day of a correction to last about two to eight days.
I have taken some time to look back over price data back to December 2010. I have noted wide ranging days (a wide range compared to several days immediately prior) which completed a trend with a spike in volume and looked at how long the following correction lasted. This list is not exhaustive; it is the few that appeared to be clear from a visual identification. (I did not find any wide ranging days with volume spikes at the end of movements for the end of the last bull market from December 2010 to September 2011). Results are listed here:
Past wide ranging days with volume spikes at the end of movements:
Date, Price range, Volume (K), Result (any candlestick pattern?)
26 Sep 2011, $128.07, 150.3, 31 day correction (hammer)
4 Jan 2013, $38.19, 297.1, 12 day correction (hammer)
15 Apr 2013, $83.03, 24.4, low next day, 8 day correction
19 Jul 2013, $26.87, 222.1, 2 day correction
15 Oct 2013, $35.88, 298.9, 9 day correction (hammer)
18 Dec 2013, $28.23, 183.7, 5 day correction
19 Jul 2014, $45.65, 158.5, 5 day correction
My conclusion is that a wide ranging day at the end of a movement which has a volume spike should result in a correction lasting two to eight days. If the wide ranging day is also a single candlestick reversal pattern (a hammer in a downtrend, or a shooting star or hanging man in an uptrend), then the correction that follows it may be more long lasting.
In this instance for 11th February, 2016, the candlestick is not a reversal pattern, so a more brief correction looks most likely.
The decline in volume for Friday supports the Elliott wave count in that it expects this is a correction against the trend and not a new downwards trend. The fall in price was not supported by volume.
ADX is above 45 and rising. This indicates the trend is overextended, so a correction should be expected. This supports the Elliott wave count.
ATR is overall still rising. If the slight dip for Friday turns into a downwards move for ATR, then it would be indicating a correction is unfolding.
RSI is extreme overbought. A correction should be expected.
Stochastics shows divergence with price at the high. This also supports the idea of a correction unfolding here.
On Balance Volume may find support at the dark blue or green lines. If OBV finds support and turns up at either of those lines, then the correction may be over. If OBV breaks below these lines, then the correction may continue and may be deeper than the Elliott wave count expects.
Some horizontal support lines are added by looking back over the last 3 years for prior areas of support and resistance. The support lines in order are about 1,240, 1,230, 1,225, and 1,215. This general area saw a lot of price congestion back from October 2014 to October 2015.
This analysis is published @ 07:11 p.m. EST.
Just sharing this from Hs Dent:
Like Charles was saying, gold is up about 14% since the year started. Today the market is a little higher so gold is down slightly. But it has momentum and could go a little higher from here.
However, it’s important to remember that the metal is still down significantly from its 2011 high, and hasn’t broken out of that downward spiral.
Between 2006 and late 2011, gold bubbled up 274%. And since then, it’s fallen 37%.
Harry thinks gold could go as high as $1,300 in the short-term as the market continues to fall. But after the panic sets in, investors will turn to safe-haven assets like the U.S. dollar, and Harry says gold will eventually drop to $700 – even as low as $250. Click here to learn how to position yourself during gold’s demise.
http://www.dentresearch.com/
I feel like DUST is about to make a big move. Look at the divergence on price and MACD with daily chart. Stochastic is over sold as well. Both indicators or lining up nicely.
On Weds, at 2pm EST, the Fed will release the minutes from their Jan 27th meeting. This may have a short term effect on gold.
Gold Punishes Investors That Are ‘Late To The Party’ – DeCarley Trading Co-Founder
Feb 16, 2016 Sees potential 1400 to 1600 in 6 months to 1 year
http://www.kitco.com/news/video/show/Kitco-News/1173/2016-02-16/Gold-Punishes-Investors-That-Are-Late-To-The-Party—DeCarley-Trading-Co-Founder
I am not going to publish my third idea, the probability is too low.
That leaves just two hourly wave counts which both expect upwards movement.
Minute iv could be over today as a double zigzag.
It may also continue sideways for a few days as a triangle or flat correction.
Ok
The channel about the double zigzag is breached. Price has turned back down to test the upper edge twice now. Another upwards move here would strengthen that line which is providing support. A break below the line would indicate new lows are likely.
I will have three hourly wave counts today.
The first main count will see minute iv complete as a double zigzag (it will be the same as this first main hourly wave count in this analysis). I would judge it to have only a 50% probability. I am concerned with the volume profile not being clearly bullish, and RSI only just returning from overbought. I am also concerned that today the 9 day EMA is slightly breached.
If we see a clear five up on the hourly chart I would have more confidence in this wave count and would increase the probability above 50%. So far if there is a complete five up it has a slightly truncated fifth wave, and so I don’t think that is correct. Which means that so far there is only a three up. That concerns me.
The first alternate will move everything in the double zigzag down one degree and see that as only wave A of a larger flat correction (or triangle). It can’t be a combination because the first structure is a multiple. A flat would require wave B to be 90% of A minimum, at 1,254.84. So more upwards movement from here. A triangle has no minimum, but would still need more upwards movement to have a reasonably typical look. Probability of this idea, minute iv continuing sideways for a few days, about 30%.
The second alternate will look at the double zigzag continuing. The upwards movement for this session would be the end of wave B in the second zigzag. But it has to see a slightly truncated fifth wave. This has a low probability. About 20%
I’ve spent some time on the five minute chart. File uploaded here. My conclusion is that the upwards movement was a five and unlikely to be a three. The fourth wave is quick and shallow, the second wave was deeper and more time consuming. This is pretty typical for Gold.
The third wave of the third wave had an extended fifth. That is typical for Gold.
In trying to see this upwards movement as either an incomplete five or a complete three it doesn’t have as neat a fit. The final wave up which I have labelled here submicro (5) and micro 5 would have to be seen as one wave, and it would then subdivide as a three. That looks wrong.
And so I have a little more confidence in the main hourly wave count. Maybe about 55% now.
If any members are choosing to enter long here please understand the risk is this correction could continue sideways as a triangle for a few days, or sideways and lower as an expanded flat for a few days. Manage risk carefully, don’t invest any more than 5% of your equity on any one trade. Stops may be set either just below the invalidation point at 1,081.57 but that is a long way away. Or just below the pink channel on the daily chart, but that means if the correction continues as an expanded flat for a few days your position could be stopped out right before the next wave up begins. The channel may provide support, but it may also be overshot.
My personal approach to this market at this time will be to wait until the volume profile is more bullish. I also have several open positions on other markets so I’m not comfortable opening another right at this time. Not with the doubt I have on Gold today.
However, with that all said be aware that another fifth wave is approaching. It could be very swift and strong. Expect surprises to the upside.
Gold Oct support at 1191.90, which was .38 of recent high was hit at 11 pm low, next support of .50 Fib at $1,167.60
Gold Vulnerable To “Backing and Filling” After Parabolic Move
Tuesday February 16, 2016 09:50
http://www.kitco.com/news/2016-02-16/Technical-Trading-Gold-Vulnerable-To-Backing-and-Filling-After-Parabolic-Move.html
At low of 1,190.96 at 11:12 pm EST Feb 15th did gold complete minuette wave (y) of subminuette wave c of minute wave iv and now gold may be in minute wave v up?
Or was 1,190.96 the bottom of minuette wave (y) and now gold is in subminuette wave b up and target area of 1,184 is still in play? Main hourly count does look like it was breached this morning so I’m concerned minute wave (v) has already begun after the 1190.96 low and won’t drop to the 1184 area. Or maybe in the alternate hourly and gold is heading for 1230 area before dropping towards 1184 area?
Any wave counts?
Gold price facing headwinds between 1216-18 with daily RSI getting to 70+ and finding support with an up trending 1203 with 1195-94 below there… Hard to say if another drop is in the making for a take out of 1203-1194…. I would be watchful for a possible drop to occur….
Syed thanks, I agree looking for a drop as it’s somewhat confusing where gold is right now today. After the parabolic rise the end of last week I’m not in a rush to buy bullish GDX or NUGT right now until either the 1184 area is hit or Lara provides more clarity maybe before the close.
Dark Cloud Cover seems to suggest to go short on the next candle open.. I just hope 1181-80 holds, preferably Lara’s suggested 1184 lol…. Good luck, lets see how this closes today. //// Stochastic %K is below %D (bearish sell signal)….
Summary: The correction is incomplete. It may end in another one, three or six sessions to total a Fibonacci three, five or eight daily candlesticks. It may end within a range of 1,200.76 to 1,181.41. Within this range, the most likely target is 1,184
I think it is dne papudi…i made my longs open
Second confirmation is gold breachd the upper trend line of main hourly count
Is subminuette wave structure of a,b and c over? Or there is another fall coming?
Since bearish COT data gold has now dropped $60. Large commercial net short and huge short position should be taken seriously at tops.
Most miners will gap down tomorrow on in North American markets.
Longs with 3xetf NUGT/JNUG are trapped.
Hi Papudi: We got Gold price to drop to 1191 and heading back up. IMHO remains to be seen if Gold price can rise through 1222 for target 1234-44 or do we get another drop from within 1205-1222 range for a break below 1191….Hope not to see a break below 1191 and for Gold price to continue on up for a take out of 1263-64 lol…. 🙂 Good luck~!
Just a view: For Gold price to get back above 1210-11 for pivot 1216 currently looks unlikely with Stochastic %K continues below %D and daily RSI at 69+ (Unless something changes). Looking for a break below 1202-01 for target 109x-108x…. 50% retrace of H 1264 / L 1082-81 could be next (1172) in coming days, I hope not~ lol
Oops: Correction: A break below 1202-01 for target 119x-118x…. and hoping the downside stops here at Lara’s target 1184….
Below 1080 the bear count is in play again. I do not think gold will go down that much????
There is no bear count. It was invalidated by price.