
More downwards movement was expected to end within 1,200.76 to 1,181.41. The target was 1,184 within this zone.
Price moved lower as expected to reach 1,192.68.
Summary: A new high above 1,205.17 would provide a little confidence that the correction is over. A clear five up on the hourly chart would provide further confidence. It is most likely that minute wave iv is complete and minute wave v upwards has begun, but it is also possible that minute wave iv may continue sideways and lower for a few days yet before the upwards trend resumes. It is very concerning that volume is strong for the downwards red daily candlestick of 16th February. This volume profile is bearish. For this reason any members entering long positions here are advised strongly to manage risk carefully. The risk is that this correction may yet continue lower and or sideways for a few more days yet.
New updates to this analysis are in bold.
Last published weekly chart is here.
DAILY ELLIOTT WAVE COUNT
Click chart to enlarge.
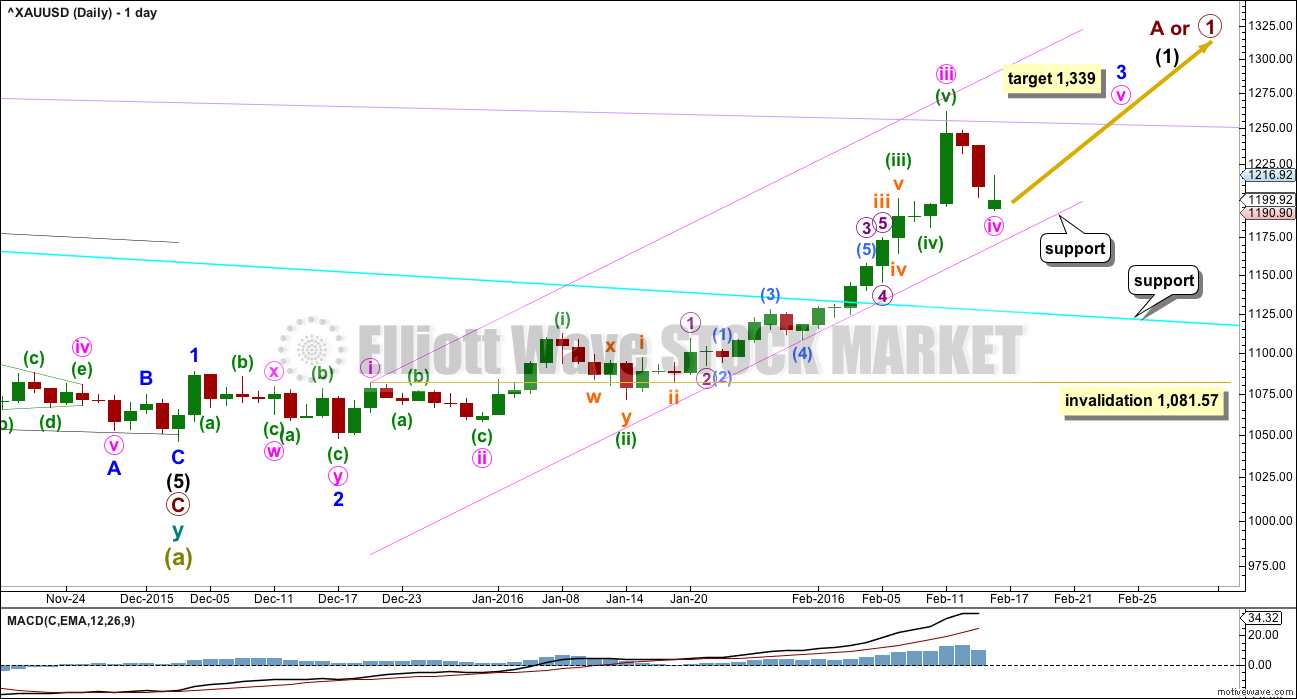
The cyan trend line is now breached by a full weekly candlestick above and not touching it. This gives substantial confidence that Gold has very likely changed from bear to bull.
So far, within the first five up, the middle of the third wave is now most likely complete. The strongest move may still be ahead. Gold typically exhibits swift strong fifth waves to end its third wave impulses. Look out for surprises to the upside for minute wave v and minor wave 5.
At 1,339 minor wave 3 would reach 6.854 the length of minor wave 1. At this stage, if minute wave iv is complete, the target will remain the same. There is no Fibonacci ratio at minute degree which would provide a target calculation close to 1,339.
Minute waves i, ii and now iii are complete within minor wave 3.
The fourth wave corrections are so far more brief and shallow than expected within this impulse unfolding upwards. This pattern may continue, which is why I say look out for surprises to the upside. Gold typically exhibits swift strong fifth waves to end its third wave impulses, and this often forces the fourth wave corrections which unfold right before to be over more quickly and be very shallow. It gives Gold’s impulses a curved look at a higher time frame.
The pink channel is a best fit. Draw the first trend line from the highs labeled minute waves i to iii then place a parallel copy lower to contain the whole upwards wave. If it continues any lower, then minute wave iv should find strong support at the lower edge.
Minute wave ii was a deep 0.68 zigzag. Minute wave iv should be shallow and may be a flat, combination or triangle most likely. Minute wave ii lasted 7 days. Minute wave iv may now be over as a double zigzag in a Fibonacci three days. If it continues further as a flat or triangle, then it may continue to total a Fibonacci five or eight days.
MAIN HOURLY WAVE COUNT
Click chart to enlarge.
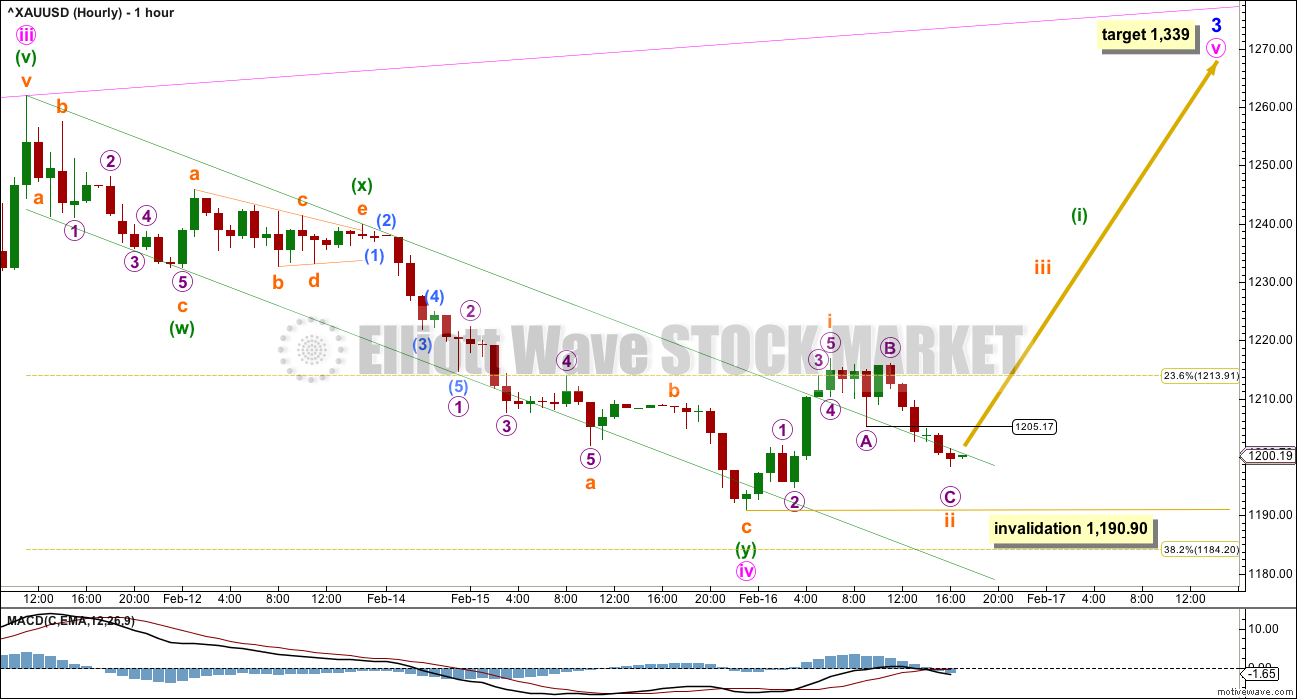
Minute wave ii was a deep 0.68 zigzag. Minute wave iv may be a complete shallow 0.35 double zigzag. There is alternation in depth and a little in structure, but both are of the zigzag family.
The first wave up from the end of minute wave iv subdivides best on the five minute chart as a five wave impulse. So far to the downside a three wave structure is either complete or nearly complete for subminuette wave ii.
A new high above 1,205.17 would provide confidence that subminuette wave i is a five and subminuette wave ii is a three. At that stage, upwards movement could not be a fourth wave correction within a new impulse unfolding downwards, as price would be back in first wave territory.
Subminuette wave ii may not move beyond the start of subminuette wave i below 1,190.90.
The next wave up of minute wave v may show a strong increase in upwards momentum. Gold often exhibits swift strong fifth waves to end its third wave impulses, and this would be a fifth wave to end minor wave 3.
ALTERNATE HOURLY WAVE COUNT
Click chart to enlarge.
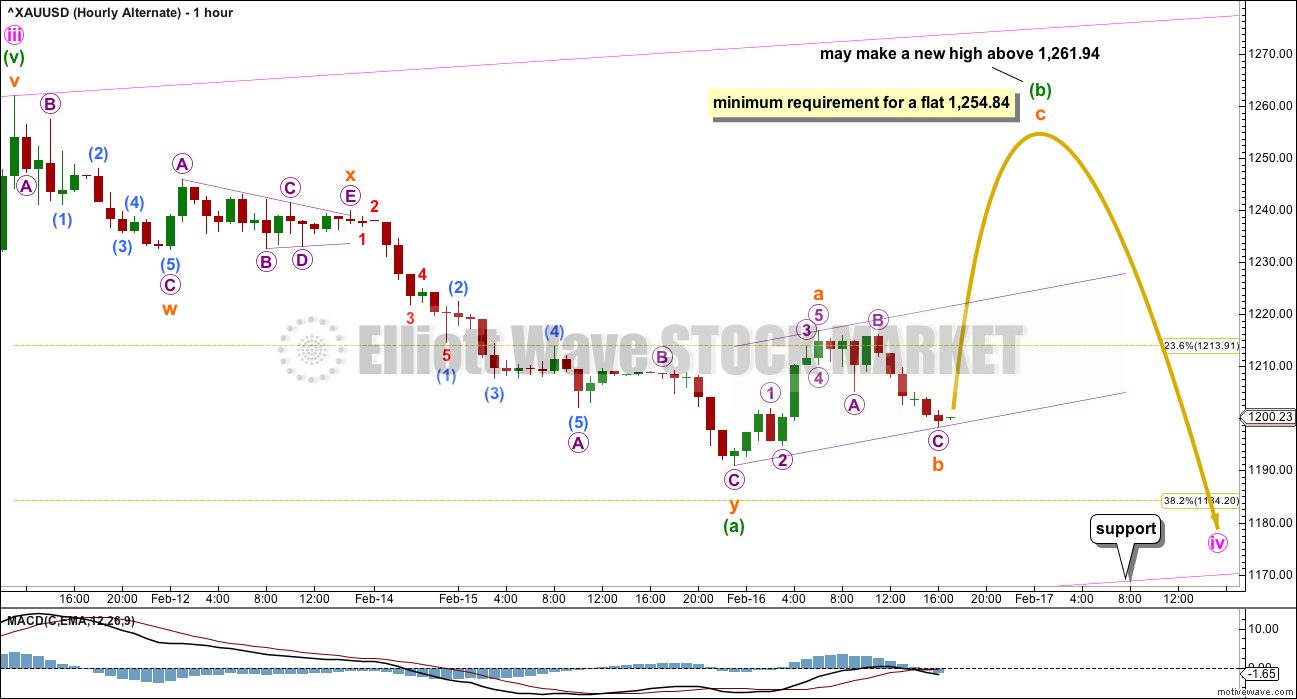
If the degree of labelling within minute wave iv is moved down one degree, then this double zigzag may be only wave A of a larger flat or triangle.
If minute wave iv is a flat correction, then within it minuette wave (b) must retrace a minimum 90% of minuette wave (a) at 1,254.84.
If minute wave iv is an expanded flat correction, the most common type of flat, then minuette wave (b) may move beyond the start of minuette wave (a) at 1,261.94. An expanded flat requires the B wave to be 105% of the A wave, or longer. This would be achieved at 1,265.49.
If minute wave iv is a triangle, then there is no minimum nor maximum requirement for minuette wave (b). A regular triangle would see minuette wave (b) end before 1,261.94 and a running triangle would see minuette wave (b) end above 1,261.94. Regular triangles are more common.
A flat correction may see minute wave iv continue sideways in an ever increasing range, and ending reasonably lower, over several more days. It may take a further two or five sessions to total a Fibonacci five or eight.
A triangle may see minute wave iv continue sideways in an ever decreasing range. Triangles are time consuming structures. A triangle for minute wave iv may take a further five sessions (and possibly longer) to complete in a total Fibonacci eight.
TECHNICAL ANALYSIS
Click chart to enlarge. Chart courtesy of StockCharts.com.
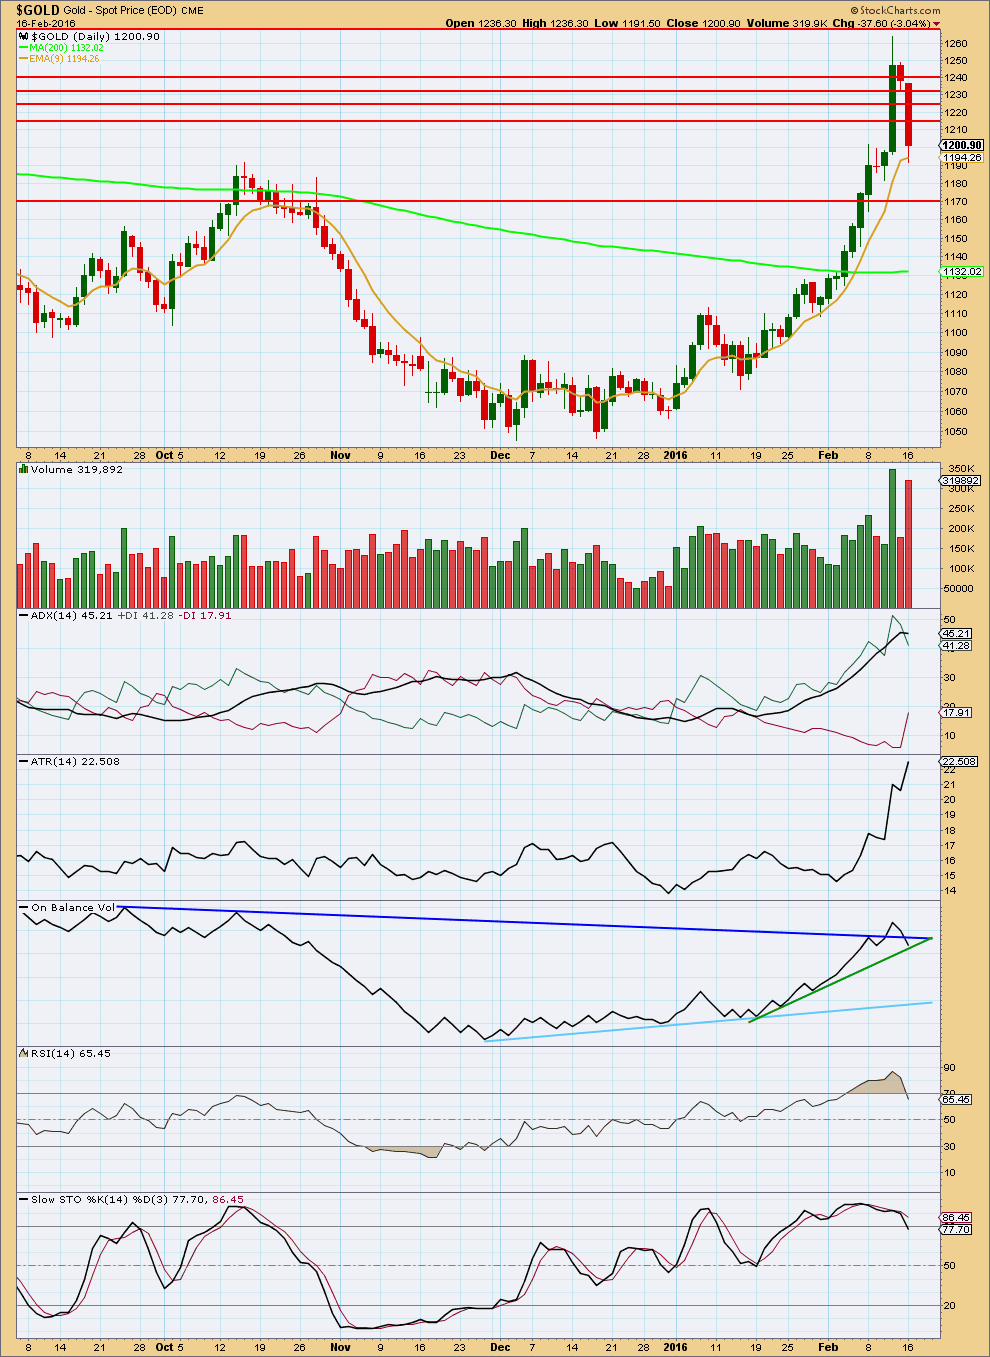
It is very concerning for the main hourly wave count that today’s strong downwards day comes with a strong increase in volume. The fall in price was well supported by volume. This indicates that more downwards movement should be expected, but it does not support the main hourly Elliott wave count.
ADX is flat indicating today that the upwards trend is no longer continuing. ADX does not indicate a trend change, only a consolidation.
ATR is still increasing indicating the market is still trending.
RSI has returned from overbought. There is room again for price to rise.
On Balance Volume has found support at the green line. This line is steep, only tested twice before and not long held. It offers only weak technical significance. This may be enough to stop price, but equally it may not. A breach of this line by OBV would be a weak bearish signal.
If the green line is breached by OBV, then the next line to offer support is a fair distance away. The light blue line is reasonably shallow, repeatedly tested and reasonably long held. It offers reasonable technical significance. If the green line is breached, then OBV should stop at the light blue line.
I have taken some time to look back over price data back to December 2010. I have noted wide ranging days (a wide range compared to several days immediately prior) which completed a trend with a spike in volume and looked at how long the following correction lasted. This list is not exhaustive; it is the few that appeared to be clear from a visual identification. (I did not find any wide ranging days with volume spikes at the end of movements for the end of the last bull market from December 2010 to September 2011). Results are listed here:
Past wide ranging days with volume spikes at the end of movements:
Date, Price range, Volume (K), Result (any candlestick pattern?)
26 Sep 2011, $128.07, 150.3, 31 day correction (hammer)
4 Jan 2013, $38.19, 297.1, 12 day correction (hammer)
15 Apr 2013, $83.03, 24.4, low next day, 8 day correction
19 Jul 2013, $26.87, 222.1, 2 day correction
15 Oct 2013, $35.88, 298.9, 9 day correction (hammer)
18 Dec 2013, $28.23, 183.7, 5 day correction
19 Jul 2014, $45.65, 158.5, 5 day correction
My conclusion is that a wide ranging day at the end of a movement which has a volume spike should result in a correction lasting two to eight days. If the wide ranging day is also a single candlestick reversal pattern (a hammer in a downtrend, or a shooting star or hanging man in an uptrend), then the correction that follows it may be more long lasting.
In this instance for 11th February, 2016, the candlestick is not a reversal pattern, so a more brief correction looks most likely.
The decline in volume for Friday supports the Elliott wave count in that it expects this is a correction against the trend and not a new downwards trend. The fall in price was not supported by volume.
ADX is above 45 and rising. This indicates the trend is overextended, so a correction should be expected. This supports the Elliott wave count.
ATR is overall still rising. If the slight dip for Friday turns into a downwards move for ATR, then it would be indicating a correction is unfolding.
RSI is extreme overbought. A correction should be expected.
Stochastics shows divergence with price at the high. This also supports the idea of a correction unfolding here.
On Balance Volume may find support at the dark blue or green lines. If OBV finds support and turns up at either of those lines, then the correction may be over. If OBV breaks below these lines, then the correction may continue and may be deeper than the Elliott wave count expects.
Some horizontal support lines are added by looking back over the last 3 years for prior areas of support and resistance. The support lines in order are about 1,240, 1,230, 1,225, and 1,215. This general area saw a lot of price congestion back from October 2014 to October 2015.
This analysis is published @ 08:30 p.m. EST.
My conclusion so far is minute iv is not over.
This sideways move looks like a triangle. A second wave can’t have a triangle as the sole structure. So it is more likely a B wave.
Which means minute iv may move lower. The target is the same, 1,184. It may be met tomorrow. The pink channel may provide support. If it ends tomorrow then it may total a Fibonacci 5 days.
Jan 27th US FED FOMC news release the US markets went down and gold up.
This time Jan 27th minutes released 2:00 pm today it appears the markets are going up and gold down so far.
Gold dropped after FOMC but just intraday correction and now above price just before the FOMC release time as US FED may delay interest hikes until evidence of inflation.
Just need a comment from Lara on next move.
It’s coming. It will probably be pretty much the same as yesterday.
This is either over, or we may see one last low before it is done. If we do then the target at 1,185 is still the most likely place for it to end.
I’m on the sidelines waiting.
Reminder: Fed minutes from the Jan 26-27 meeting will be released at 2pm EST today.
FOMC minutes
Lara: In a “running flat” what is the fib ratio for wave b to wave a?
I know that wave c does not close below wave a.
Ron Rosen continues to publish weekly wave count and claims gold is in running flat from 2008 high of 1033. Wave a ended at 681 and wave b at 1923.
I am glad I found your excellent service.
In a running flat B is 105% or more of A.
C ends slightly before A and so is slightly truncated.
C must end within the territory of A though.
If I recall correctly Ron Rosens running flat wave count sees C ending above A? Not even in A price territory?
I may be thinking of another running flat for Gold that I saw though….
Lara the quality of your analysis has jumped up a few notches, amazing, thank you.
Thank you Richard.
I will be sending an email to all members tomorrow with some good news 🙂
The analysis will change slightly for the better, I hope.
Terrific Lara, I look forward to it.
Yes lara volume profile is bearish….but i feel that red candlestick was a sure call as ther was a holiday on monday only for US markets and markets opened way down the nyse last close…seeing the range of trade that was yesterday i feel that the high volume red candlestick must not be a concern…
Again all analyst are shouting that the counter trend of gold is over and we are heading to new lows..many of our respected members too believe that…we can see bearish comments also here…it is creating a hint to teror to buy gold.. :)..
But im long.. 🙂
Thank u again for your great efforts
Speaking of bears, I am one of them and have been for a long time. Personally, I am considering the idea that gold just completed a first 5 down and is now making a 3 up with waves A and B complete. There is a gap at 1237/8 that needs to be filled before downward movement can continue in earnest. Perhaps an up day now to take care of that?
Matt, repeating my question below from a few days ago which I think you missed:
It’s a brave call to be bearish at the moment Matt! I can see why you might be somewhat bearish but would be interested to know what you anticipate.
Do you believe we are in a late 1999 type situation where the stock market needs to get its panics over with first? In other words we have a 12-18 months wait before things really take off. Or do you believe we are heading substantially sub $1000 in the near future?
US Stocks may have started a multiyear decline in May 2015. I expect that when all is said and done, stocks will be substantially cheaper in a couple years. The S&P could lose 50-75% of its value. However, stocks are perhaps staging a relief rally for a few months that could be quite strong.
This relief rally in stocks could coincide with a decline in gold. I am still looking for 1000 or below this year. Whatever the case may be with gold, the bottom is not far off. Could be as soon as April/May. Either that, or (more likely) it bounces one last time around then and heads to final lows closer to the end of the year.
This huge bear market rally in gold shocked everyone, but was necessary to squeeze the absolute maximum out of the bears and to shake confidence. It also served to convince bulls that the great new rise has begun. However, I think a squeeze on the other side may well be in the cards too.
Thanks.
US Stocks may have started a multi-year decline….Agreed
..stocks are perhaps staging a relief rally for a few months….doubt it. A month at best.
Gold may pull back to the breakout area ($1100-$1130) but I doubt below.
Believe the lows for the gold stocks are in.
Unlike in recent years where everything went up and down together, the psychology now is gold behaves opposite to the GM. Don’t believe this is likely to change in the near future.
Finally the bond market will implode one day. Possibly this year. If it does, what’s left to buy?
Having said all that, what better way to completely destroy the gold bull psychology than the rally we have just had followed by sub $1000.
i’m definitely bearish. There are going to be a lot of people lose a lot of money here shortly for being long. There may be 1 more up, but after that…just my thoughts
My comments applied to the general stock market and gold, not miners. I have less experience with miners, but have always been taught that they are a few months ahead of gold itself. If that is the case, miners may go down substantially but not actually make a new low (like gold). I don’t really want to comment further on this topic, because it is one in which I am not knowledgeable. It’s just a thought.
As for stocks, this is a common time of year for a prolonged rally…..especially considering that stocks have been hammered for so long. One reason for this is that the US population puts tax refunds back into the market. That will be particularly true if the market is perceived as cheap and/or a rally gains steam and late comers don’t want to miss out. How about “sell in May and go away?” That leaves several weeks yet. 🙂
Hi Matt – do you have an EW bearish count that you could post which makes you bearish, or is there other technical anaysis you use?
All Lara’s bear counts invalidated. I’m very interested in knowing what you are seeing if you don’t mind sharing your idea.
I’m bearish emotionally (as it makes sense to me that gold would decline with the broader markets), but very bullish technically (due to what price is saying) so my money is with the bull.
Ruppu I think Long was a good call as gold already went above 1205.71.
“A new high above 1,205.17 would provide a little confidence that the correction, minute wave iv is over. A new high above 1,205.17 would be part of subminuette wave iii. The next wave up of minute wave v may show a strong increase in upwards momentum.”
That would be the case… except that on the way down it managed to make a movement that sure looks like a five on the hourly chart.
It managed to have a small correction that remained below 1,205.17 and then a slight new low. So a five down is what it looks like.
And so now the price points to differentiate whether we are going up or down from here are 1,216.92 and 1,190.90. A new high now above 1,216.92 would indicate more upwards movement, a new low below 1,190.90 would indicate more downwards movement.
I agree, and I did consider that the candlestick for StockCharts for that day may include all the activity outside the NY session of 16th February.
It may be that the high volume for that candlestick isn’t actually particularly bearish. But I will err on the side of caution. I know that may be frustratingly conservative for some, and many will disagree. That will be my judgement.
If we can see another downwards day with low volume I’ll have more confidence in the bullish wave count. Or, if we see an upwards day with high volume that would do it too.