
Sideways movement in a narrow range looks like a triangle. The question is: where did price enter the triangle and so in what direction will the breakout be?
I have three hourly wave counts to try to answer this question.
Summary: It looks like today minute wave iv is incomplete. It looks like price is now moving sideways to complete a triangle. The breakout is most likely to be downwards, which should be confirmed below 1,201.5. If that happens, the target is at 1,184.
New updates to this analysis are in bold.
Last published weekly chart is here.
DAILY ELLIOTT WAVE COUNT
Click chart to enlarge.
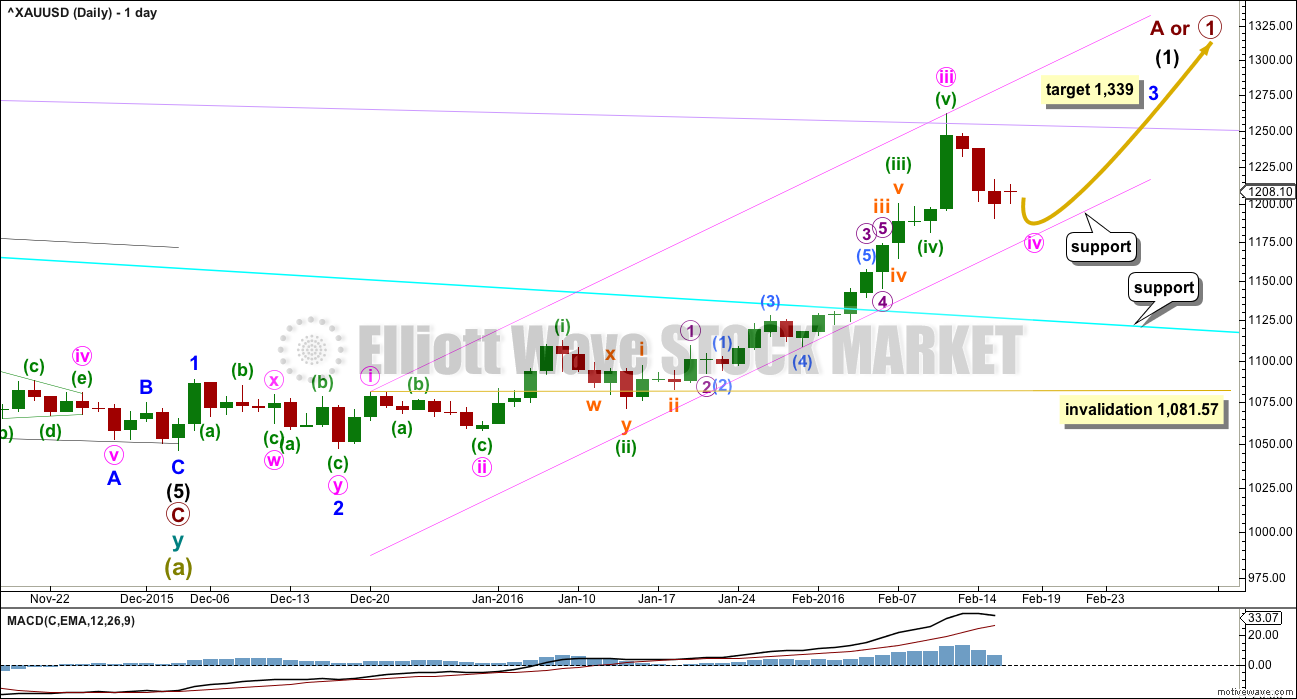
The cyan trend line is now breached by a full weekly candlestick above and not touching it. This gives substantial confidence that Gold has very likely changed from bear to bull.
So far, within the first five up, the middle of the third wave is now most likely complete. The strongest move may still be ahead. Gold typically exhibits swift strong fifth waves to end its third wave impulses. Look out for surprises to the upside for minute wave v and minor wave 5.
At 1,339 minor wave 3 would reach 6.854 the length of minor wave 1.
Minute waves i, ii and now iii are complete within minor wave 3.
The fourth wave corrections are so far more brief and shallow than expected within this impulse unfolding upwards. This pattern may continue, which is why I say look out for surprises to the upside. Gold typically exhibits swift strong fifth waves to end its third wave impulses, and this often forces the fourth wave corrections which unfold right before to be over more quickly and be very shallow. It gives Gold’s impulses a curved look at a higher time frame.
The pink channel is a best fit. Draw the first trend line from the highs labeled minute waves i to iii then place a parallel copy lower to contain the whole upwards wave. If it continues any lower, then minute wave iv should find strong support at the lower edge.
Minute wave ii was a deep 0.68 zigzag. Minute wave iv should be shallow and may be a flat, combination or triangle most likely. Minute wave ii lasted 7 days. The balance of probability has changed today with minute wave iv likely to continue a little lower. The target is at 1,184 where it would reach down to the 0.382 Fibonacci ratio of minute wave iii. If it ends in one more day, it would total a Fibonacci five, but it may be longer lasting and continue for a further four trading days to total a Fibonacci eight. At this stage, one more day only looks more likely.
MAIN HOURLY WAVE COUNT
Click chart to enlarge.
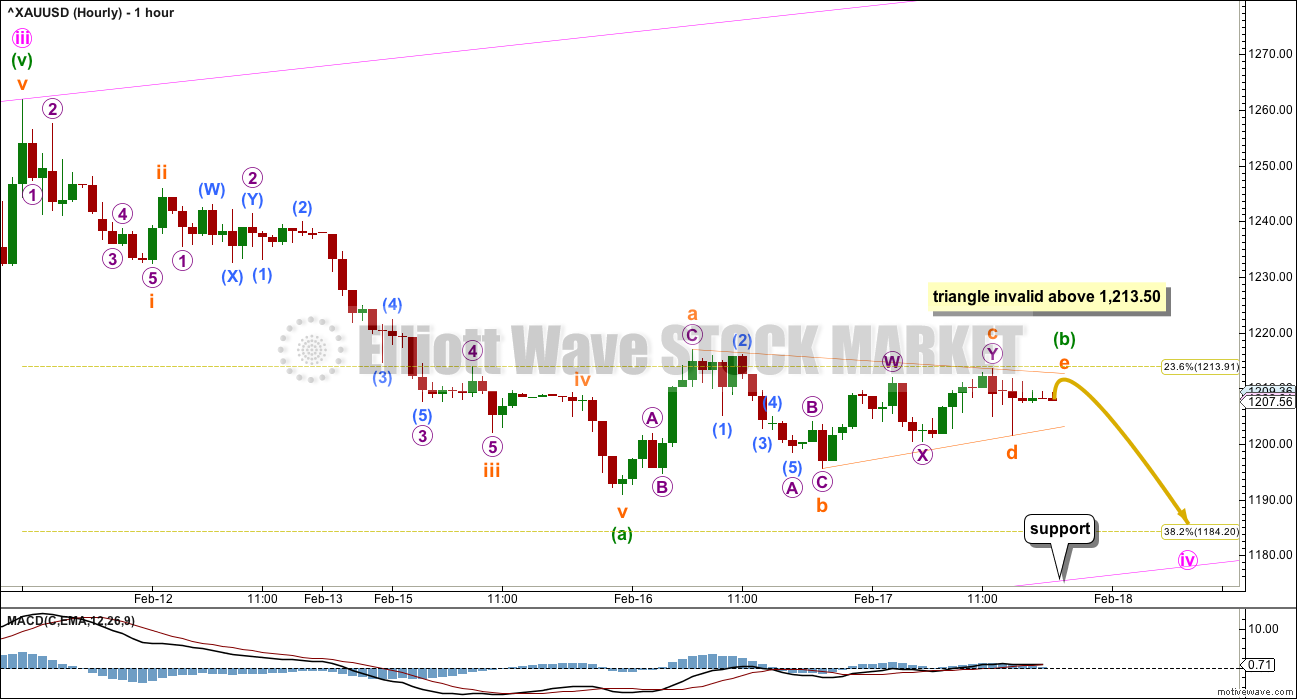
Minute wave ii was a deep 0.68 zigzag.
If minute wave iv completes as a shallow zigzag, then there would be alternation in depth but not structure. Alternation is a guideline, not a rule, and is not always perfect. A wave count which expects more alternation should have a greater probability than a wave count that expects less, but towards the end of a structure it may become clearer how it is unfolding. At this stage, minute wave iv does look like it is a zigzag.
The most important difference today between this wave count and the first alternate below is the structure of the first part of this downwards wave, here labelled subminuette wave i. If a triangle is unfolding for a B wave, then it will be more shallow than 90% of the A wave, so the A wave must be a five wave structure. To see the A wave as a five subminuette wave i has a problem because within it micro wave 3 looks like a three wave structure when it should be a five. For this reason alternates must be considered.
Sideways movement for the last session looks like a triangle. Second wave corrections may not have triangles as the sole corrective structure, so this triangle may be a B wave within a zigzag.
The triangle is supported by MACD hovering at the zero line.
If this triangle is correctly labelled, then the breakout should be downwards when it is complete. A new low below the end of subminuette wave d at 1,201.50 would most likely be a downwards breakout, especially if downwards movement is swift and strong.
Movements out of Gold’s triangles are sometimes quite short. If minute wave iv ends at the 0.382 Fibonacci ratio at 1,184, then minuette wave (c) may be short. It would be 0.618 the length of minuette wave (a) if it is 43.90 in length, or 0.382 the length of minuette wave (a) if it is 27.14 in length.
If this wave count is accurate, then as soon as price makes a new low below the end of minuette wave (a) at 1,190.90 then be alert for the possible end to this correction.
If price comes down to touch the lower pink line, it should find strong support there.
When minuette wave (b) is complete, then a channel may be drawn about this downwards zigzag. The upper edge of that channel should be used to confirm when the correction for minute wave iv is over. Only when the upper edge of that channel is breached by upwards movement may confidence be had that the correction is over.
For now, because minuette wave (b) is most likely incomplete, the channel cannot yet be drawn.
ALTERNATE HOURLY WAVE COUNT
Click chart to enlarge.
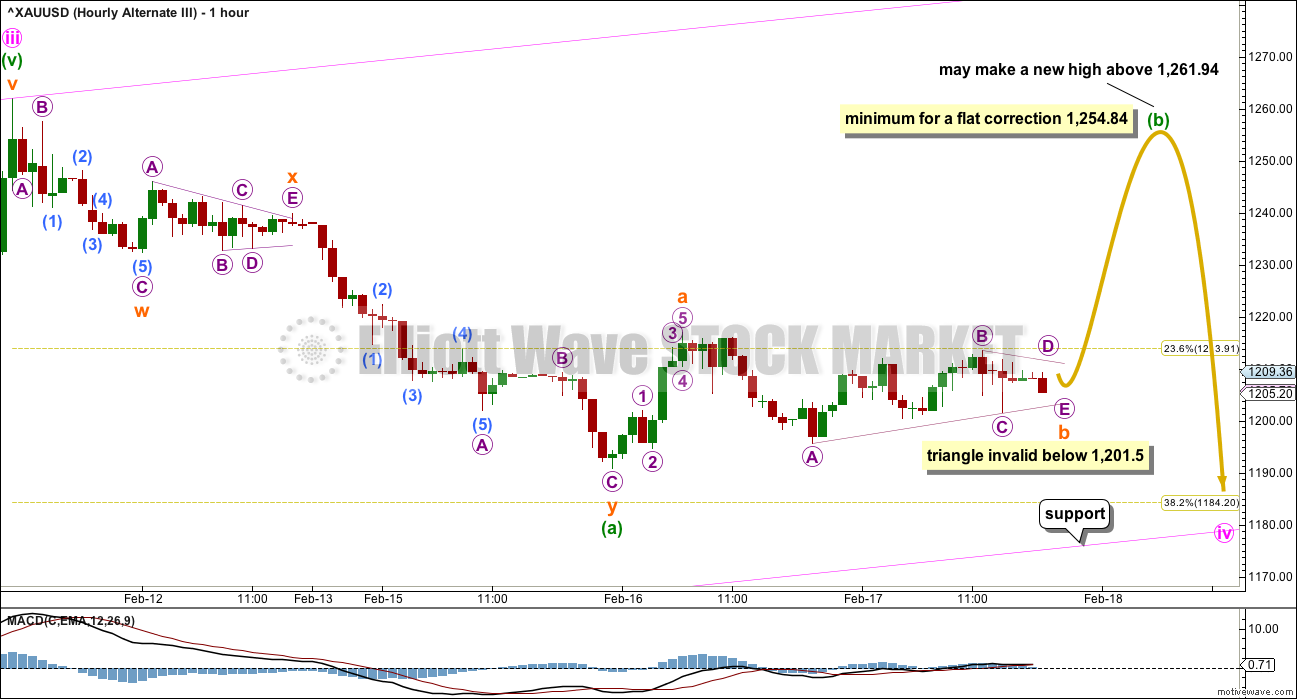
I have learned the hard way to always consider other possibilities with triangles. What if this triangle is a B wave within a B wave?
If the triangle is a B wave within a zigzag, then the breakout should be upwards. Now minuette wave (a) may again be seen as a three, a double zigzag.
Minute wave iv is seen as a flat correction for this wave count.
Within a flat correction, minuette wave (b) must retrace a minimum 90% of minuette wave (a) at 1,254.84. It may also make a new high above the start of minuette wave (a) at 1,261.94 as in an expanded flat.
If price remains above 1,201.50 and moves strongly higher in the next 24 hours, then this should be the wave count which is used.
When minuette wave (b) is a complete zigzag and has met the minimum requirement at or above 1,254.84, then a target may be calculated for minuette wave (c) downwards. For now the target will remain the 0.382 Fibonacci ratio at 1,184.
SECOND ALTERNATE HOURLY WAVE COUNT

Click chart to enlarge.
At this stage, I would judge this second alternate to have the lowest probability of all three hourly charts.
If minute wave iv is complete as a shallow double zigzag, then minute wave v must have begun. Sideways movement may be micro wave B within subminuette wave ii. It may be complete as a double zigzag as labelled, or it may continue as a triangle (not labelled). Either way micro wave C must move lower and should end below the end of micro wave A at 1,195.66 to avoid a truncation. It may not move below the start of subminuette wave i below 1,190.90.
This wave count is possible but less likely. All possibilities at this stage should be considered.
TECHNICAL ANALYSIS
Click chart to enlarge. Chart courtesy of StockCharts.com.
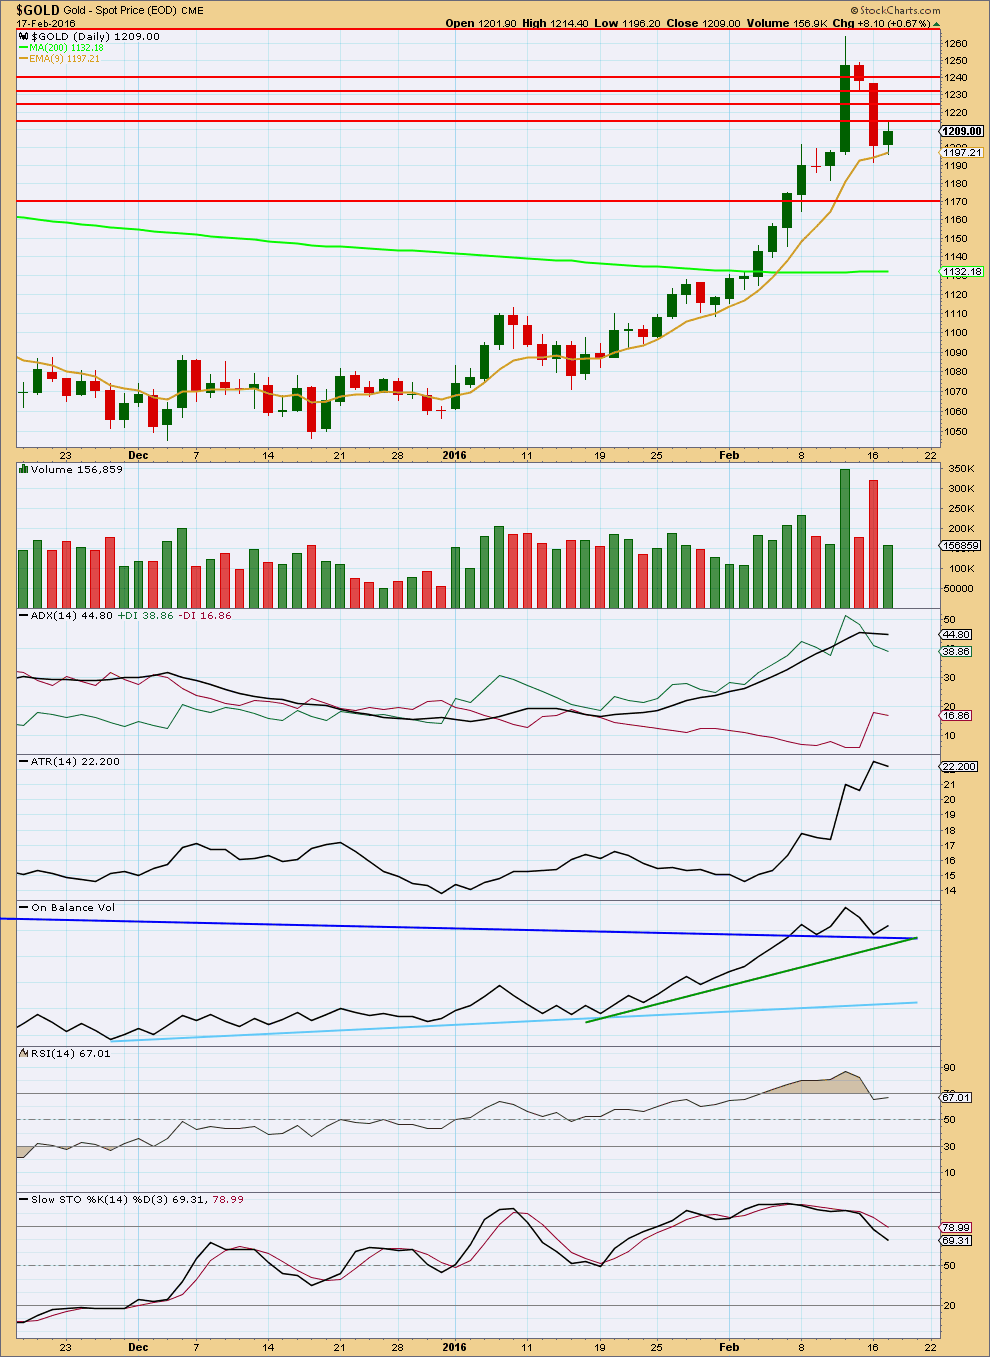
A small inside day completing a green candlestick on lighter volume is bearish. More downwards movement should be expected.
So far the 9 day Exponential Moving Average is providing support.
The lowest of a group of horizontal trend lines is today providing resistance.
ADX is flat indicating the market is not trending. It has not indicated a trend change yet, so it should be expected that the market is consolidating.
ATR may be beginning to decrease, but overall for the last several days it was increasing as price moved higher.
On Balance Volume has today found support at the dark blue line. This line is reasonably shallow, long held, and has been tested a few times. It has good technical significance and may assist to continue to help to hold up price. This suggests that although volume indicates more downwards movement ahead it may not be very deep; OBV may hold it up.
If the dark blue and green lines are breached by OBV, then the next line to offer support is the light blue line which is a long way away.
This correction has returned RSI from overbought. Stochastics is also returning from overbought.
I have taken some time to look back over price data back to December 2010. I have noted wide ranging days (a wide range compared to several days immediately prior) which completed a trend with a spike in volume and looked at how long the following correction lasted. This list is not exhaustive; it is the few that appeared to be clear from a visual identification. (I did not find any wide ranging days with volume spikes at the end of movements for the end of the last bull market from December 2010 to September 2011). Results are listed here:
Past wide ranging days with volume spikes at the end of movements:
Date, Price range, Volume (K), Result (any candlestick pattern?)
26 Sep 2011, $128.07, 150.3, 31 day correction (hammer)
4 Jan 2013, $38.19, 297.1, 12 day correction (hammer)
15 Apr 2013, $83.03, 24.4, low next day, 8 day correction
19 Jul 2013, $26.87, 222.1, 2 day correction
15 Oct 2013, $35.88, 298.9, 9 day correction (hammer)
18 Dec 2013, $28.23, 183.7, 5 day correction
19 Jul 2014, $45.65, 158.5, 5 day correction
My conclusion is that a wide ranging day at the end of a movement which has a volume spike should result in a correction lasting two to eight days. If the wide ranging day is also a single candlestick reversal pattern (a hammer in a downtrend, or a shooting star or hanging man in an uptrend), then the correction that follows it may be more long lasting.
In this instance for 11th February, 2016, the candlestick is not a reversal pattern, so a more brief correction looks most likely.
This analysis is published @ 07:38 p.m. EST.
StockCharts data looks like it is finalised for the day. Today shows a slight increase in volume.
This perfectly illustrates why my comments to members here in the comments sections may not be a good idea.
I have done this for a long time now due to members requests.
I am going to stop providing comments before the close *Edit: at least comments with too much detail. I’ll provide something.
Today my comments below about minute iv continuing was based on volume data showing a decline for the session. But that data is not finalised often until after 6:30pm EST and so any comment before that time comes with the caveat that the situation / analysis may change once data is final.
Today that is what has happened.
With upwards movement showing an increase in volume, albeit only sight, the probability shifts to seeing minute wave iv complete and minute wave v underway.
Which means my time on charts this morning, making comments and preparing analysis to be published as soon as I can, is mostly wasted. I have to redo the analysis that I had prepared.
I am going to learn from this experience and not do it again, despite pressure from members.
Lara thank you for clarifying things and for your integrity.
Gold may go up to between 1255 to 1262 (or a new high) then drop to 1191 or below if minute wave iv or keep going up if minute wave v.
So far that’s my main hourly wave count.
When this session is closed and StockCharts data is available I’ll be relying heavily on volume to determine the main and alternate hourly wave counts.
So far from COMEX data today has lighter volume than yesterday.
Two upward days on declining volume fits a consolidation better than it fits an upwards trend.
Lara would it be possible to add a 3 hour “MACD Two Lines” indicator into your Technical Analysis section to cover the gap between daily and hourly as it can signal a good time to buy or sell please?
I have the option of 2 hour.
But I’m not familiar with that entry technique. As I understand it, it is very simple. When the lines cross it indicates the trend direction / change.
I prefer to use trend lines.
I would have to study that particular technique before I’m confident enough to include it in the analysis.
In the meantime feel free to publish a chart of how you’re using it.
Lara
I emailed you a screenshot of gold /GC and MACD at 78 minute time frame
MACDTwoLines (3, 10, 16, EXPONENTIAL)
It gave a Buy today at 8 am and peaked at 3 pm
I didn’t know how to copy it or paste it to your site, sorry.
Thank you Richard.
When you make a comment there is a grey button right above the text box with “Choose File”.
You may upload a jpg, gif or png with your comment.
GDX – Daily, 195, 78 and 39 minutes charts. 39 Fired buy at 530 am, 195,78, 39 minute all MACD Buys at 8 am EST this morning for bullish all day.
I missed seeing these signals this morning for an all day bullish event GDX and would of been NUGT also. These long time frames are very strong signs.
Buy GSS at $0.32 for a move to $3.00 plus, CDE, AUY, EG, NGD, IMVHO
Lara you mentioned below , ” This is an impulse coming to an end. When intermediate (1) is over and intermediate (2) down is complete… that will be a golden opportunity.”
I’m guessing that since the target for minor 3 is at 1,339 that rough guess intermediate wave (1) may be at about 1,500 in a couple of weeks?
Just remember this is cycle wave b. It looks like an impulse wave . Lara has written about this wave many times. I will not get ahead of this.
Cycle b can be one of 23 possible structures.
But the first five up should be clear on the daily and weekly charts for a move of this degree.
So when intermediate (1) up is complete then intermediate (2) down should unfold.
When that is done then another five up should complete, it may be (3) or (c). Either way it should present a good trading opportunity, we should have time to position ourselves for a long ride up.
That’s a few weeks away yet though. For now (1) is incomplete.
1,500 looks to be about reasonable.
But I can’t calculate a target for intermediate (1) to end until minor 4 is done.
So that is an extremely rough guess only at this stage.
RSI is overbought now at 1233..i think a new high will make it extremely over bought…it will invite wave C…and a healthy correction is needed to bring RSI to neutral level for another big run…
It is also possible that the healthy correction may actually begin intermediate 2…
The boost in prices till now is indicating that we are in minutte 5
When gold multi-year bear changes to a new gold bull market the technical indicators can become much more overbought that during the bear market.
“I see some of you attempting to look at the overbought nature of the technicals on the miners and metals and view it as simply another topping pattern just like all the others we have had for years.
The issue that many overlook is that we apply those technicals differently during bull moves vs. bear moves. You see, if the market has truly bottomed and transitioned into a bull phase, then overbought indicators simply remain overbought as the market continues higher in a 3rd wave. This is when technicals imbed and why so many are caught off guard when a market transitions from bear to bull.
So, do not assume an overbought indication in the techncials will mark a top this time, and maintain an open mind to the potential that the market may have finally transitioned. Due to the potential of a bottoming pattern in place in GDX, we now need more than just an overbought indication on the technicals to confirm a top to a corrective rally. We also need to see a Fibonacci Pinball support level broken by an impulsive structure to the downside.
In conclusion, this post is simply to note that indicators should be used differently during bull phases and bear phases, and one has to be able to understand how to use them appropriately during the different phases of a market move.”
Good advice.
Just as indicators can remain extreme to the downside when the bear market moves lower, they can remain extreme to the upside as a bull market moves higher.
There will be just two hourly wave counts today.
The downwards move from the high of minute iii will be seen only as a double zigzag.
This is either minute wave iv in its entirety, or its just wave A of a larger flat correction for minute wave iv.
Either way, short term at least more upwards movement is expected to a minimum 1,254.84. It may make a new high.
Volume will help to tell us which wave count is correct. If minute wave v is underway then volume should increase.
If this is part of a consolidation then volume should decline.
If members are entering long here on the basis that it could be a strong fifth wave up then please understand the risk. Price could turn down to make new lows below 1,190.9.
My approach would be wait for a small correction, enter long, and put my stop just below 1,200.85. When my position becomes positive I’d move my stop up to break even.
As always, I could be wrong. Manage risk to your account carefully. Do not invest more than 5% of equity in any one position. In this case due to the risk then only 3% would be wiser.
Removed, duplicate
Lara,
Thanks for your very timely update. In a bull trend , highly likely Minute iv is over.
Strong upward thrust from 1201.30 last night is good sort of confirmation.
Excellent analysis. 2nd ALT. Hrly. above.
LARA, Where do you see this fifth wave taking us ( if and when we are in a fifth wave) ? Is this your 1339 target ,to complete intermediate wave 1 ? Thanks, and congratulations on your RIA.
1,339 is the target for Minor wave 3. Intermediate wave (1) would be higher.
Not to disbelieve you Richard ,but then where does lara see intermediate 1 ?
Look on Lara’s daily chart and see 1,339 besides Minor wave 3.
“At 1,339 minor wave 3 would reach 6.854 the length of minor wave 1. When minute wave iv is complete, then this target may also be calculated at minute degree. At that stage, it may widen to a zone or it may change.”
Lara has not given a projection for intermediate wave (1).
I cannot calculate a target for intermediate (1) until minor 3 and 4 within it are complete.
At this stage there is no target for intermediate (1).
Gold has gone more bullish than expected we need new charts.
Main hourly is still valid however no more triangle down to 1184 area.
Triangle requirement was invalidated above 1213.50 at 10:41 am EST
Gold is more bullish than expected and many of Several of Lara’s lower targets are not met as shorter and briefer than expected due to strength of bullish wave.
(Also thanks to the US FED for strong gold?)
Upside target is 1339 however even higher later than that.
Any wave counts?
I AGREE WITH YOU RICHARD Think that talk of negative interest rates is fast eroding confidence in the dollar (and the Fed) I think we see something like laras second alternate( without a move below 1201) moving soon to the 1339 target after maybe one more rally in the SPX to 1970 SPX area (possibly). Congratulations LARA on your financial Advisor status.
Yes “Negative interest rates give gold a boost.”
It is hard to think of more countries already moved or threatening (USA) to move to negative rates. Sounds insanely desperate, which is good for gold. Just surprising how bullish gold is now, even faster than EW if that is possible?
It was possible for gold to become parabolic in 1979 t0 1980 when it moved to $800, (however that move was for different reasons (inflationary expectations) , but now ,of course it is moving because of currency problems(:wars:) but when oil eventualy moves higher again(not for awhile) then we can add inflationary pressures to golds continuing rise. Yes I do expect gold to challenge its old high of $1920 either this year or next. IMHO
1920 this year, awesome possibility, I like the thought of that.
Keep an eye on volume Richard.
This is two upwards days, small upwards days, on light volume.
We’re not out of this correction just yet I think.
But as always, I could be wrong and there is a strong fifth wave approaching. If I am wrong I will be proven wrong quite strongly. And so entering long here may possibly be worth it if you understand that the risk is price may turn back down to touch that lower pink trend line (it doesn’t have to stop there, but it is likely to).
Hi Lara, I appreciate the warning. No disrepect intended. I’m just frustrated because I didn’t bullish wave yet as I’ve been expecting a downturn to buy the dip to ride up.
I’d love a drop down to the pink line at 1180 area. Who knows but dips seem to happen overnight lately then best to buy low early in the day and ride the bull up intra day then sell by day end.
I think Janet Yellen and the US FED Jan 27th minutes released yesterday spooked the markets and are sending gold up more than expected. She even mentioned they would consider negative interest rates if needed and that is bullish gold.
I’m frustrated with it too. I had a nice position earlier on before the bull was confirmed, but closed it out and took profit because the bear wave count remained valid.
And then after the bear was invalidated Gold was hitting the support lines where I wanted to enter while I slept. And so I missed it.
There is always another opportunity. Let the frustration go and focus on solving the puzzle.
I do let the frustration go every day thanks and am still optimistic and working on the gold bull puzzle. Perhaps just intraday trade buy low sell high whatever shows up as that’s the trend lately.
This is an impulse coming to an end. When intermediate (1) is over and intermediate (2) down is complete… that will be a golden opportunity.
Pun intended.
Gold has just got up to a high of 1,214.40 at 10:41 am EST
However if gold goes above 1,213.50 the main hourly has marked on it,
“Triangle invalid above 1,213.50”
Then Likelyhood is triangle won’t happen.
Super news email at 5 am EST today thanks Lara and congratulations on your achievement.
It’s great for us with Lara finally being able to give us some trading advice.
“I am pleased to announce that I am now a Registered Financial Advisor.
I am now legally able to provide financial advice. The analysis will change
slightly. When I am confident that my technical analysis indicates an entry
opportunity for a trade, I may advise members of this and I may advise
members how to manage risk. I will only provide this guidance when I am confident that my analysis indicates a high probability set up.”
The main hourly chart didn’t breakout of triangle as described when gold went below 1201.50 at 6:01 am EST down to 1,200.83.
“If this triangle is correctly labelled, then the breakout should be downwards when it is complete. A new low below the end of subminuette wave d at 1,201.50 would most likely be a downwards breakout, especially if downwards movement is swift and strong.”
The 2nd Hourly chart was invalidated at 6 am below 1,201.50.
“If price remains above 1,201.50 and moves strongly higher in the next 24 hours, then this should be the wave count which is used.”
Main Hourly also invalid with break of 1213.5.
Editorial: Negative interest rates give gold a boost
A new kind of race to the bottom
By: John Cumming 2016-02-16
http://www.northernminer.com/news/editorial-negative-interest-rates-give-gold-a-boost/1003762418/
Lara, just by reading and analyzing the written and charts portions of your forecast I can feel the neural pathways in my brain expanding. I think it may help prevent alzheimer’s, thank you. Your brain must be really supercharged to be able to put this whole analysis together or maybe you meditate a lot or maybe all your surfing puts you in ‘The Zone’ in order to be able to comprehend and master Elliott Wave and produce this deluxe analysis?
🙂 I think I just love charts and spend a lot of time looking at them.
And there’s been no surf these last few days. So more time to work