
To end this week, I still have just the one daily chart but now four hourly wave counts.
I will not try to pick a winner. The labelling of 1-2-3-4 is not intended to indicate which is more or less likely. Volume and price next week should tell us which one is correct.
Summary: Minute wave iv may or may not be over. Only a clear five up on the hourly chart would confirm it. I have three possible structures which may be unfolding for minute iv. What looks clear still is that the trend is up and corrections present an opportunity to join the trend.
New updates to this analysis are in bold.
Last published weekly chart is here.
DAILY ELLIOTT WAVE COUNT
Click chart to enlarge.
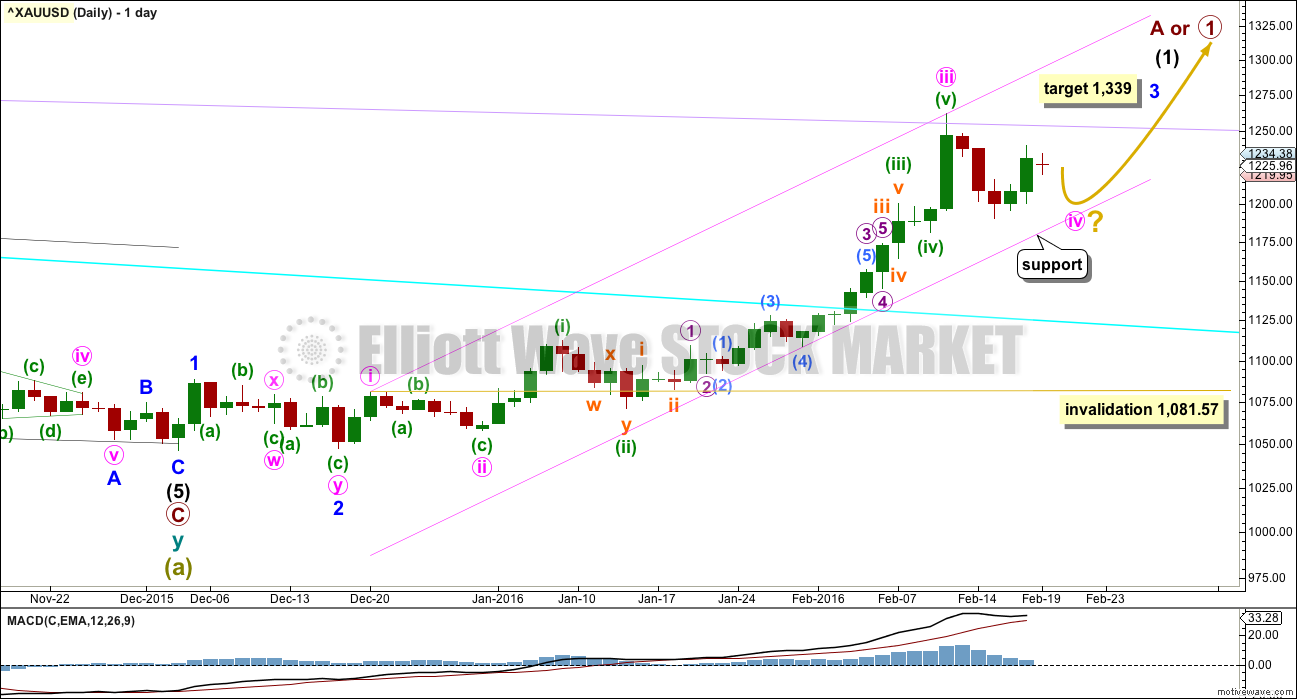
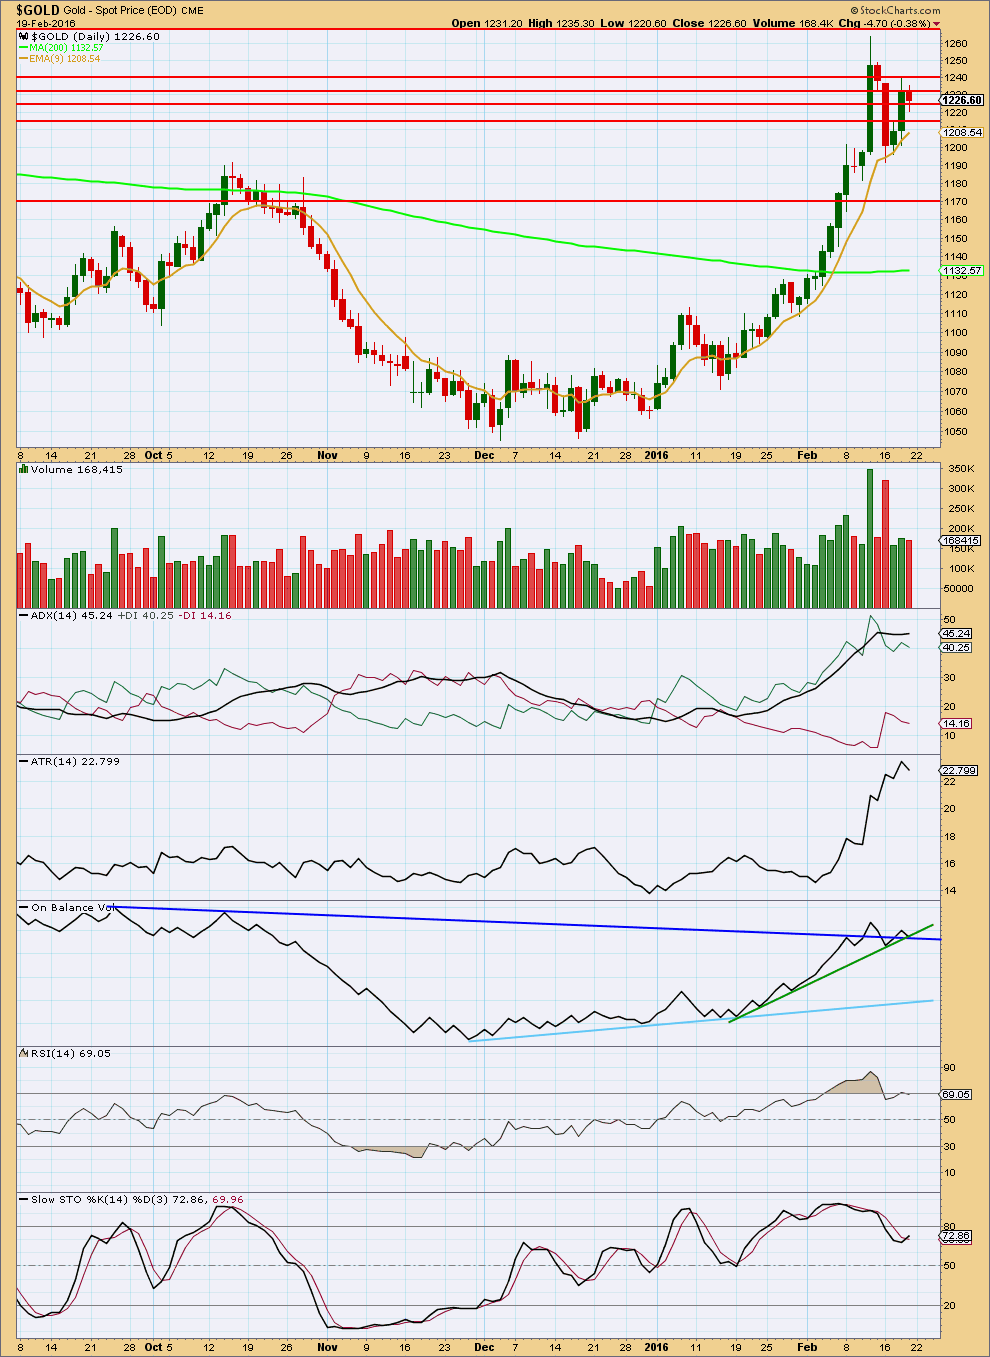
The cyan trend line is now breached by a full weekly candlestick above and not touching it. This gives substantial confidence that Gold has very likely changed from bear to bull.
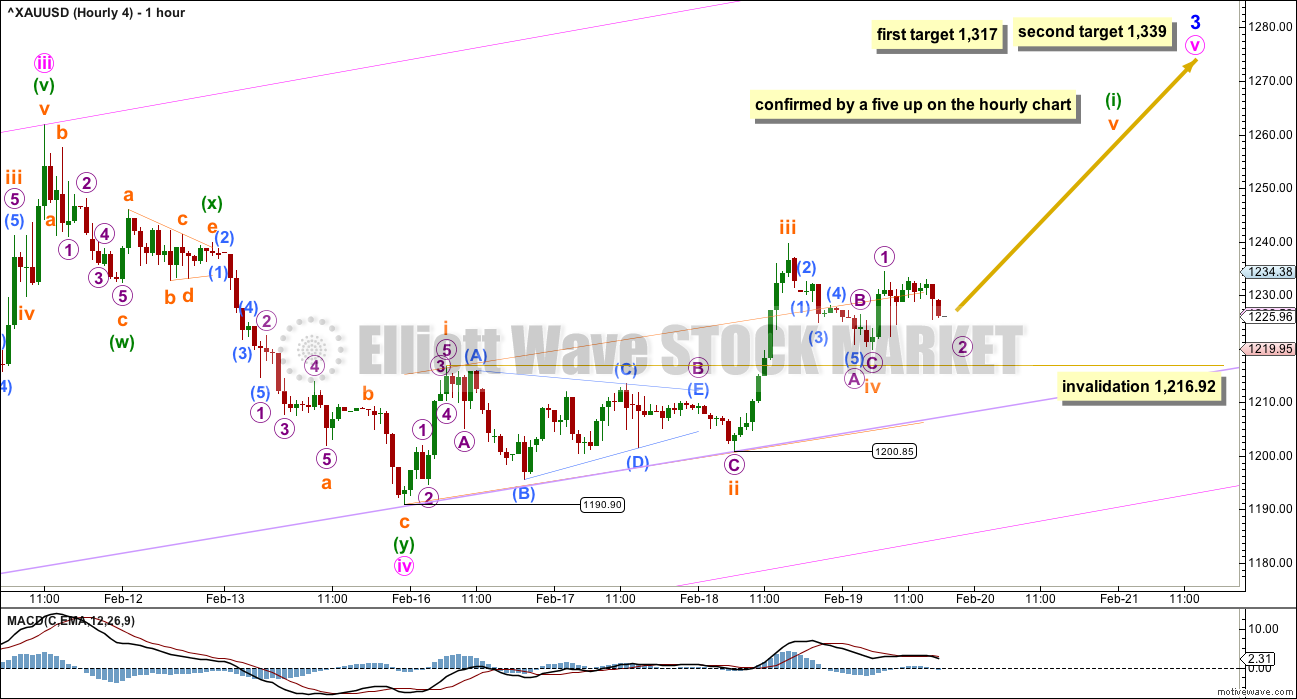
So far, within the first five up, the middle of the third wave is now most likely complete. The strongest move may still be ahead. Gold typically exhibits swift strong fifth waves to end its third wave impulses. Look out for surprises to the upside for minute wave v and minor wave 5.
At 1,339 minor wave 3 would reach 6.854 the length of minor wave 1. When minute wave iv is confirmed as over, then this target may be calculated at a second degree. At that stage, it may widen to a zone, it may change, or a second target may be added.
Minute waves i, ii and now iii are complete within minor wave 3.
The fourth wave corrections are so far more brief and shallow than expected within this impulse unfolding upwards. This pattern may continue, which is why I say look out for surprises to the upside. Gold typically exhibits swift strong fifth waves to end its third wave impulses, and this often forces the fourth wave corrections which unfold right before to be over more quickly and be very shallow. It gives Gold’s impulses a curved look at a higher time frame.
The pink channel is a best fit. Draw the first trend line from the highs labeled minute waves i to iii then place a parallel copy lower to contain the whole upwards wave. If minute wave iv continues next week, then look for it to find support at the lower pink line. If price touches that line, it should offer a low risk entry point to join the upwards trend.
If it continues any further, then minute wave iv may not move into minute wave i price territory below 1,081.57.
At the end of this week, it is not clear that minute wave iv is over. The last three days may be the start of minute wave v, but if so it is not so far very convincing. Sometimes waves start off slowly and end strongly. This may be happening. Alternatively, minute wave iv may be continuing sideways. I will not pick a winner while the situation is unclear. I will outline exactly what we need to see to have confidence this correction is over.
HOURLY WAVE COUNT 1
Click chart to enlarge.
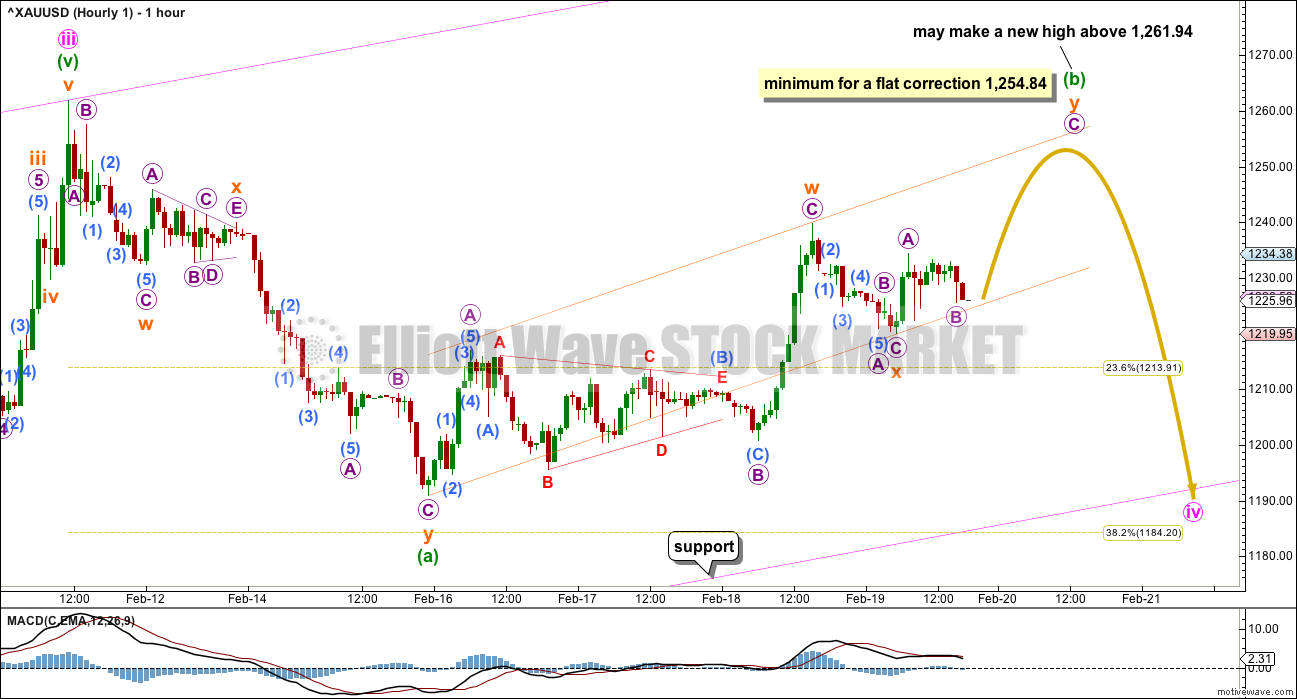
The first of three wave counts which see minute wave iv continuing looks at a flat correction. These are very common. The most common type of flat is an expanded flat where minuette wave (b) would move above the start of minuette wave (a) at 1,261.94.
If upwards movement continues next week and it has a corrective count (3, 7, 11, 15 etc. adding multiples of 4), then this wave count should be expected to be likely.
Minuette wave (b) may be unfolding as another double zigzag. It must reach up to a minimum 90% of minuette wave (a) at or above 1,254.84.
When minuette wave (b) is complete, then its length would determine what type of flat should be unfolding. At that stage, a target may be calculated for minuette wave (c) downwards to end. Minuette wave (c) would be extremely likely to make a new low below the end of minuette wave (a) at 1,190.9. It may find support at the lower pink line.
This wave count may take a further two days to complete the structure, but that now looks to be too brief. The next Fibonacci ratio in the sequence after eight is thirteen, which would see minute wave iv continue for a further seven days. That looks to be too long. It may not exhibit a Fibonacci duration.
HOURLY WAVE COUNT 2
Click chart to enlarge.
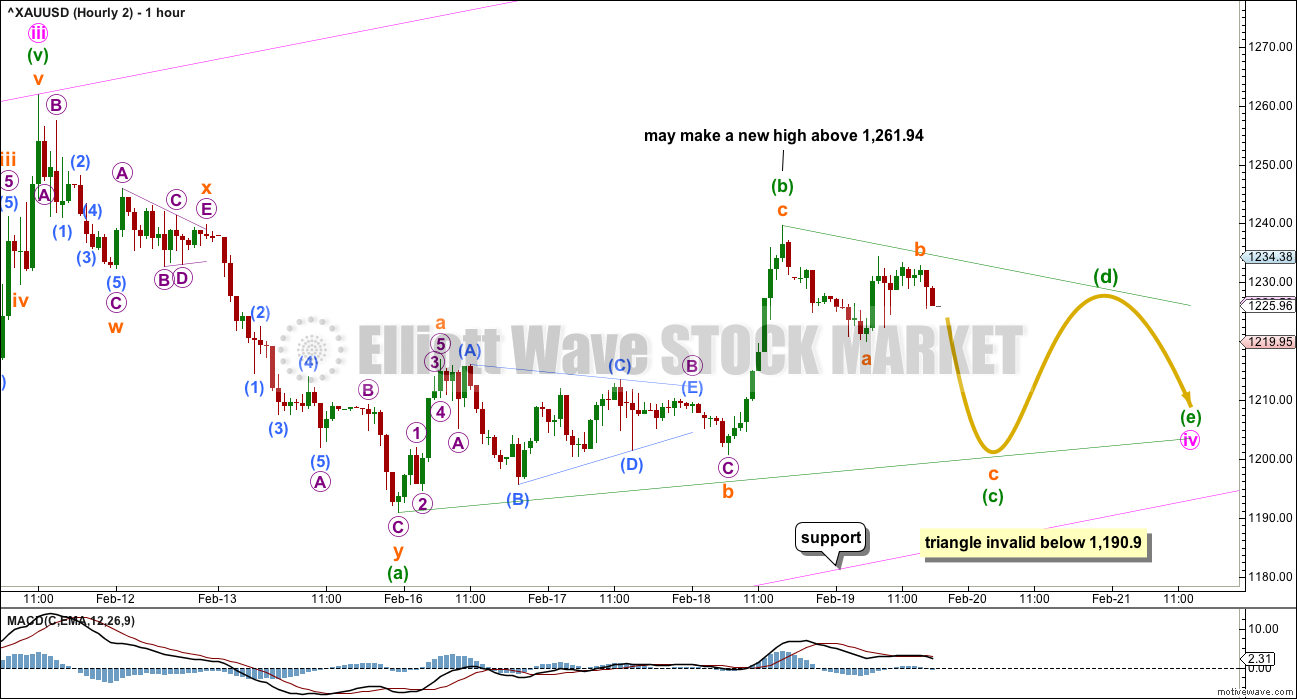
Minute wave iv may be continuing sideways as a triangle. Within the triangle, minuette wave (b) may be complete at 0.69 the length of minuette wave (a). One of the triangle’s subwaves is often close to 0.618 of its predecessor.
Minuette wave (b) may also continue higher as a double zigzag. It may make a new high above the start of minuette wave (a) at 1,261.94 as in a running triangle. 40% of triangles are running triangles, so this is a reasonable possibility.
Minuette wave (c) may not move beyond the end of minuette wave (a) at 1,190.9 for a contracting or barrier triangle. Expanding triangles are one of the rarest Elliott wave structures, so it will not be considered here.
The triangle idea would be invalidated below 1,190.9.
This wave count could see minute wave iv continue sideways in an ever decreasing range for a further seven days to total a Fibonacci thirteen. Triangles take time and test our patience.
If MACD begins to hover close to zero, then this wave count would have technical support.
HOURLY WAVE COUNT 3
Click chart to enlarge.
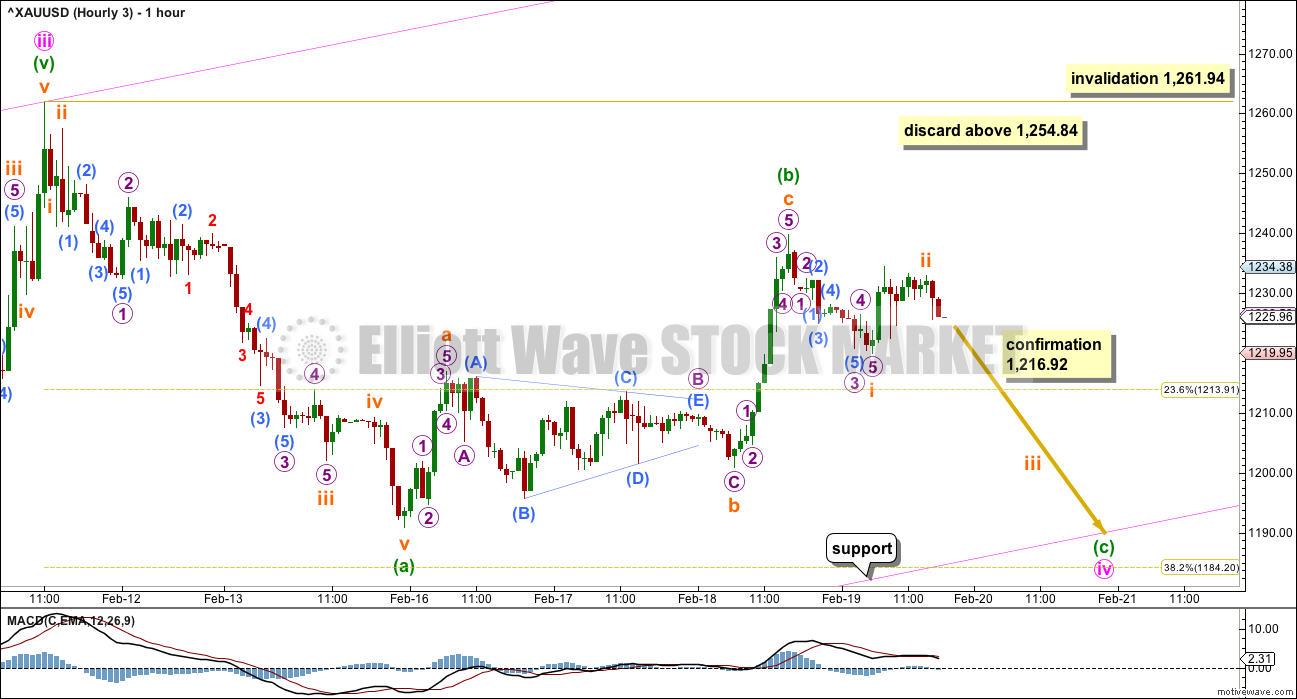
What if my analysis of the downwards wave labelled here minuette wave (a) is wrong for the first two hourly wave counts? What if it was not a double zigzag but was an impulse?
Zigzags and impulses often have a very similar look. Both possibilities must be considered.
If a single zigzag is completing for minute wave iv, there would still be inadequate alternation between minute waves ii and iv. There would be alternation in depth but not structure. A new low below 1,216.92 would invalidate wave counts #1 and #4, leaving this wave count #3 and the triangle wave count #2.
This wave count expects a little more downwards movement to end about 1,184, if minute wave iv is to end at the 0.382 Fibonacci ratio and find support at the pink trend line.
Minuette wave (c) would be extremely likely to make at least a slight new low below the end of minuette wave (a) at 1,190.9 to avoid a truncation. Once it has done that, then look for support at the pink trend line. If that happens, it should offer a low risk entry to join the upwards trend.
HOURLY WAVE COUNT 4
Click chart to enlarge.
If minute wave iv is complete, then it was a shallow double zigzag. There is little alternation in structure with the single zigzag of minute wave ii, but there is good alternation in depth.
Fourth wave corrections within Gold’s third wave impulses are often brief and shallow, sometimes surprisingly so. This is the wave count that looks at what a surprise to the upside would look like. If price begins to move very strong up and remains above 1,216.92, then this wave count would be possible. When minuette wave (i) is a complete five wave structure, then this wave count would be confirmed and would be the only wave count.
When minuette wave (i) is complete then minuette wave (ii) should move price lower for a short correction. It may be brief and it may be shallow, but it should move lower. If this wave count is correct, then the lower pink trend line may not again be touched on the way up. A lilac line is added on this chart across the two lows as marked. Minuette wave (ii) may come down to touch that line. It was also tested once earlier, off to the left of the chart.
TECHNICAL ANALYSIS
Click chart to enlarge. Chart courtesy of StockCharts.com.
Volume remains light for the last three days. Some increase in volume for the second upwards day may be an early sign of bullishness, but volume is still lighter than prior upwards days. Overall, it looks like a consolidation may be continuing. A break to a new high on a day with an increase in volume would indicate an upwards breakout is underway.
For Friday’s session, ADX is now slightly increasing indicating the market is trending upwards.
ATR is increasing overall indicating the market is trending.
ADX and ATR are indicating that Elliott wave count #4 should be seriously considered. However, they are based on 14 day averages and so necessarily are lagging indicators. If price has been consolidating only for 5 days, they will not yet indicate that.
On Balance Volume has found support at both the dark blue and green lines. The green line isn’t very technically significant; it is too steep. The dark blue line is technically significant though; it is shallow and long held. If OBV bounces up from here on Monday, then its strength would be reinforced. That may support wave count #4.
RSI has returned from overbought, just. RSI can remain extreme for some time during a trending market. When RSI shows divergence with price at a high, then it would be a reasonably reliable indicator of a deeper and longer lasting correction. At this stage, RSI showed no divergence with price at the last high, so a more brief correction looks more likely. This supports the Elliott wave count which sees this correction as either over or continuing for a minute degree wave.
Stochastics has returned from overbought. It too did not show any divergence with price at the last high.
I have taken some time to look back over price data back to December 2010. I have noted wide ranging days (a wide range compared to several days immediately prior) which completed a trend with a spike in volume and looked at how long the following correction lasted. This list is not exhaustive; it is the few that appeared to be clear from a visual identification. (I did not find any wide ranging days with volume spikes at the end of movements for the end of the last bull market from December 2010 to September 2011). Results are listed here:
Past wide ranging days with volume spikes at the end of movements:
Date, Price range, Volume (K), Result (any candlestick pattern?)
26 Sep 2011, $128.07, 150.3, 31 day correction (hammer)
4 Jan 2013, $38.19, 297.1, 12 day correction (hammer)
15 Apr 2013, $83.03, 24.4, low next day, 8 day correction
19 Jul 2013, $26.87, 222.1, 2 day correction
15 Oct 2013, $35.88, 298.9, 9 day correction (hammer)
18 Dec 2013, $28.23, 183.7, 5 day correction
19 Jul 2014, $45.65, 158.5, 5 day correction
My conclusion is that a wide ranging day at the end of a movement which has a volume spike should result in a correction lasting two to eight days. If the wide ranging day is also a single candlestick reversal pattern (a hammer in a downtrend, or a shooting star or hanging man in an uptrend), then the correction that follows it may be more long lasting.
In this instance for 11th February, 2016, the candlestick is not a reversal pattern, so a more brief correction looks most likely.
This analysis is published @ 10:15 p.m. EST.
Martin Armstrong – Gold Update: February 16, 2016
https://www.armstrongeconomics.com/markets-by-sector/precious-metals/gold/gold-update-february-16th-2016/
Lately it seems that Oil, Gold and the S&P are in synch.
Oil and the S&P go up, while Gold goes down. This relationship may persist, until it doesn’t anymore. So it should be considered but it cannot be relied upon.
Today Oil went up to invalidate its wave count. The S&P went up as the wave count expected it to. And Gold went down giving us a little clarity; this fourth wave correction isn’t over yet.
I will have two hourly charts for Gold today. Minute iv may be continuing sideways as a regular contracting triangle (more likely – it would have alternation with the zigzag of minute ii) or it may be completing as a zigzag (less likely due to inadequate alternation).
Either way, this correction for Gold is incomplete.
The triangle would see choppy overlapping movement in an ever decreasing range for a few days yet. Maybe to total a Fibonacci 13 days.
The zigzag could end in one more day to total a Fibonacci 8.
See my comment below about the pink channel also. If that’s touched price may bounce up from there. For the zigzag that may happen tomorrow.
Thanks a lot Lara for your helpful comment.
Lara could we please get an update in GDX as it is crazy bullish the last two weeks. GDX already last week at 18.91 exceeded the 18.46 high given in the last update February 7th.
Curious thing is that the miners are going up even while gold is going down.
I think the miners were so extremely oversold and feared and ignored that as the buyers come back to the miners they go up even on sideways days in gold.
There appears to be a rally in GDX eveyday.
Not today, hopefully tomorrow Richard. It’s on my list 🙂
Super Lara thanks.
Come to think of wave iv bottom???? It may be more risky to trying to wait and pick bottom for wave iv.
What comes next is an explosive move up to 1339.
Lara has done an excellent job to give us various options. Two of them are eliminated.
I may ease in to miners here going forward. Duhhhh!
If hourly wave count #3 is unfolding then : “Minuette wave (c) would be extremely likely to make at least a slight new low below the end of minuette wave (a) at 1,190.9 to avoid a truncation.”
If hourly wave count # 2 is unfolding then : “Minuette wave (c) may not move beyond the end of minuette wave (a) at 1,190.9 for a contracting or barrier triangle.”
Gold is heading below 1200.
Agreed 1196 and 1184
Hopefully GDX has dropped by then either 1196 or 1184.
It seeems that GDX is averaging up daily.
Right now gold is at 1210.55 and GDX is at 18.40
Friday gold closed at 1229.20 and GDX was at 18.38
The miners are attracting more buying back in as gold stays high as the miners were extremely oversold and feared and hated and now investors are cautious about the markets and seeing gold go up and decided to buy some miners.
Friday night Rambus post:
http://rambus1.com/2016/02/20/late-friday-night-charts-38/
“I had been looking for one last capitulation move down in the PM complex but with the recent developments on these ratio charts I have to go with the new information as it comes in. As the information changes so do I. If you have ever wondered what it feels like to buy at the bottom of a bear market I think now is a good time to find out. It always looks easy in hindsight but to live through the moment is another matter altogether.”
Dreamer thanks for Rambus Chartology new article on gold bottoming.
I really enjoy his gold articles. They have great charts. He is good with gold forecasting. He makes a good case that gold and the miners bottomed.
If a trend line is drawn across the three daily lows of 16th, 17th and 18th February, this trend line is touched now.
If price breaks below that trend line then I’d expect the next support line would be the lower edge of the pink channel.
And if price touches the pink trend line then it is very likely to bounce up from there.
This may happen within the next few hours, before the next analysis is out.
If price behaves like this (bounces up from that pink trend line) then it should offer a reasonably low risk entry opportunity for a long position to join the trend.
The risk is technically at 1,081.57 using the Elliott wave invalidation point. But that is a very long way away. So there would be two higher points to calculate risk from:
1. The pink trend line should hold, but be aware it may be overshot and price may turn back up into the channel. If a stop is put just below this line then it could be taken out by an overshoot. I cannot say exactly how much this could be by, it is up to each member to manage your risk accordingly.
2. If you choose to let this market have more room to move then the next trend line with strong technical significance would be the cyan line on the daily chart, the final bear market trend line. To see how to draw that look at the weekly chart. On a semi log scale (daily and weekly). This trend line should now offer very strong support. I would not expect that line to be breached. If overshot (unlikely) then not by much.
For members who may not be aware I’m in New Zealand, currently (with daylight savings) 18 hours ahead of New York. So I’m asleep while New York has it’s morning. Sometimes important price points are reached while I’m asleep.
Good luck!
And remember, manage risk. It is the single thing that traders can do that is the most important thing to stay alive in this game. Do not invest more than 5% of your equity on any one trade. Preferably limit risk to no more than 3% of equity.
The above comment looks at the possibility that minute wave iv could end soon and what we may do if that happens.
It is made to cover this possibility.
My comment should not be read as “this is what the market must do”.
Minute wave iv may also continue sideways as a triangle for a few days yet.
Thanks lara for the update
Hourly wave count #3 has been confirmed below 1,216.92.
Hourly wave count 1 and 4 were invalidated at 10:48 pm EST gold dropped below 1,216.92 invalidation point and reached low of 1215.76 at 10:58 pm.
” A new low below 1,216.92 would invalidate wave counts #1 and #4, leaving this wave count #3 and the triangle wave count #2.”
Lara
Movement Invalidated hourly count 3…
So we heading downward to touch last low of atleast 1200 ..??..
Another question lara if this is minor 4 which is a rare possibility what would be the target for minor 4..??..jst an aprrox target..
Ohh sorry i too meant confirmed..lol
It’s either a zigzag or a triangle.
The important thing to note is this means that minute iv is incomplete. It’s continuing. The market is still in a correction.
Good a correction a buying opportunity lower down to get into the up trend.
Exactly 🙂
Thomas
Way to go for benefiting from this bull market in PM sector.
I am also invested in many juniors and micro juniors specially emerging gold producers and expanding gold reserves thru extensive exploration.
If you care to share which micro junior do you have in mind??
There are many share this sentiment in PM sector right now.
ABX Barrick has been doing the best out of GDX this year.
Has Gold finally bottomed? – Gunner 24 Gold forecasting analysis Feb 21, 2016
http://www.gunner24.com/newsletter/nl-022116/
good report.
Thanks Ceaser/Lara It works now.
You’re welcome.
That must have been Cesar. I didn’t do anything 🙂
This is for bear lovers..
We are on a EW platform here…and we have invalidated the bears with a big bang…
I just want to say that being bearish here dosnt have any sense…its a clear trend untill now…and we must be confident on the system we are learning and following…
The negative views may manipulate members positive approach and may keep us away from the profits…i think it already happend….
So just flow with LARA’S analysis and the trend…let time and price determine golds destiny…
Thank you lara for extreme analysis
I hope we will see $1300 – $1900. I’ve actually put money in a micro-cap gold company with 1 producing mine, and 1 fully permitted, fully funded mine with 1 million ounces resources and another 5 million ounces potential. When gold goes to $1500+ and the share price goes back to where it was before the 2013 crash, I’ll make 1 million dollars. So I’m hoping really bad for the best… but I can’t help it but plan for the worst at this time, “The Ides of March”, and betting only a small portion of my net worth like Lara is telling us.
At this stage, hard to tell how much upside beyond 1281-82 Gold price will fetch given that daily RSI keeps tagging 70+ and weekly RSI keeps coming in close to tag 70…. Is it possible that a healthy correction for a break below 1182-81 occurs before Gold price heads on up to track 1300+?…. Lets wait and see. Personally long on the drop/s, expecting a pullback / short term decline on Monday and will remain to be seen if Lara’s indicative 1216.92 holds…
“This is an impulse coming to an end. When intermediate (1) is over and intermediate (2) down is complete… that will be a golden opportunity.” – Lara
This is the best plan in my opinion. This echoes Gary Tanashian’s (my fav. macro analyst) view that there’s no clear actionable trend in gold miners yet. He’s saying that bull is not confirmed until “HUI is up in the 200’s”. When there’s a clear trend Gary will not be afraid to pound the table and goes all in again like he did in 2008.
” What NFTRH does best is identify oncoming trend changes and then manage them.
What NFTRH does worst is flounder around during late stage trends because I will not
lather you up even if that late stage trend still appears very bullish. In other words, I
won’t try to create ‘actionable’ when taking action is a high risk proposition.
The preferred mode continues to be ‘spot a new trend and ride it!’ ” – Gary
This week, COT data is bearish, HUI is near the top of the downtrend channel, the “PDAC curse” is here when gold tends to drop dramatically almost every year, all my favourite analysts sold their positions Thursday because Goldman Sachs pumped gold that morning. So it’s so hard to be brave at this point even though $1313 gold target is so delicious. Best plan is to wait for a clear trend like Lara is saying and only risk 3%.
“Gold Daily/ Weekly –The rally since December 3rd continues to look like an incomplete 4 of 5-waves higher. This means there’s likely going to be at least one more move higher to fulfill the setup. Near-term support seems fairly strong between 1,192 and 1,185 (includes 38.2% retrace of the entire Dec./Feb. rise). This entire wave count stands within the A leg of an ABC counter-trend rise. Over time, should have potential to reach as far as 1,381-1,392. This longer-term target includes 38.2% retrace of the ‘11/’15 decline as well as the target from a declining wedge that developed off the Mar. ’14 high. ” – Goldman Sach. Thursday 8AM
http://incakolanews.blogspot.ca/2016/02/for-those-who-care-about-goldman-sachs.html
http://nftrh.com/2016/02/19/various-markets-weekly-views/
First post here actually, I don’t see this clear break everyone speaks of?
It actually looks fairly routine for this trend, it just hit the upper trend line, consolidation then a break downward rinse and repeat, until it’s broken.
Added to that is seasonality, either it topped or will top within the next two weeks then we are short until end of March.
Just my 2 cents.
I am looking for March low.
Is your chart on a semi log or arithmetic scale? It looks arithmetic to me.
It makes a difference to trend lines.
Longer term charts (daily and above) should always be on a semi or log scale.
Gold correction Alert thru COT data.
Looking at recent past COT data and gold’s price behaviour only conclusion to draw is gold will correct here.
Large commercial shorts increased significantly in second week in a row. Now the shorts stands at high as previous highs of May 2015 and Oct 2015. A deep correction unfolded from those highs.
Commercial shorts: 392,944 up from last week + 52148 Net short position 163420.
which is 23.4% of the open interest.
Compare this to Dec 4 2015 bottom Net short was only 7050 only vs today’s 163420.
One of Lara’s wave count will be validated.
YES and this could be setting up as a big SHORT squeeze IMHO. Commercials not always right.
Sometimes these warnings come just a few days before a trend change?
Maybe minute iv is over and minute v will move sharply higher, and then minor 4 will take its time moving lower / sideways.
That could be the trend change that the bearish COT is looking for possibly.
OR…
My analysis of minor 3 as incomplete is wrong and this correction is the start of minor 4, not minute iv. If price breaks below the pink trend line I’d have to consider that. The subdivisions would be squished up though.