
Upwards movement confirmed the alternate bear hourly Elliott wave count.
Summary: The wave counts still diverge. In the short term, expect price to continue higher slowly to the cyan trend line on the daily charts and the target at 1,135. Price should find strong resistance at that line. Thereafter, a break below the upwards sloping cyan line on the alternate bull hourly chart would be strong indication of a trend change. A new low below 1,092.4 would provide price confirmation.
New updates to this analysis are in bold.
Last published weekly charts with the bigger picture are here.
MAIN BEAR ELLIOTT WAVE COUNT
Click chart to enlarge.
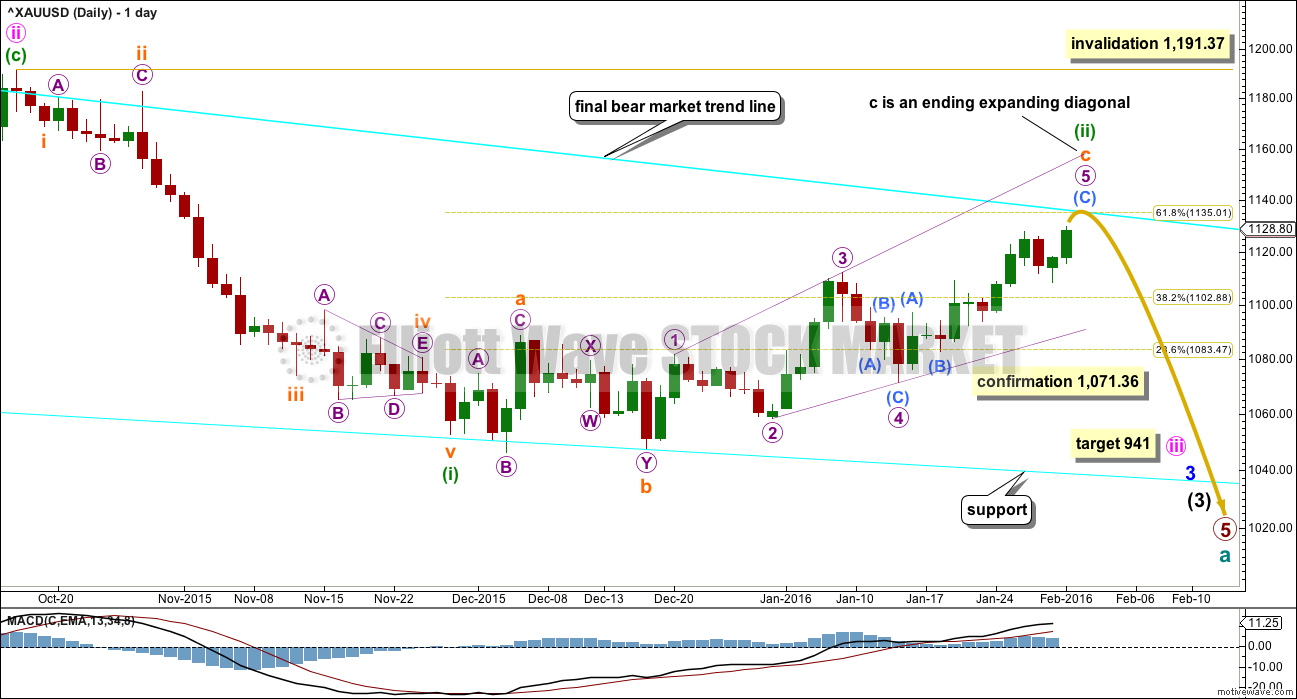
Gold has been in a bear market since September 2011. There has not yet been confirmation of a change from bear to bull, so at this stage any bull wave count would be trying to pick a low which is not advised. Price remains below the 200 day moving average and below the cyan trend line. The bear market should be expected to be intact until we have technical confirmation of a big trend change.
The final line of resistance (cyan line copied over from weekly charts) is only overshot and not so far properly breached. Simple is best, and the simplest method to confirm a trend change is a trend line.
Minute wave ii is a complete zigzag and deep at 0.73 the length of minute wave i.
At 941 minute wave iii would reach 1.618 the length of minute wave i.
Minuette wave (i) is complete.
Minuette wave (ii) looks like a fairly typical expanded flat correction which may end about the 0.618 Fibonacci ratio at 1,135.
Subminuette wave c may be an almost complete ending contracting diagonal.
Price should find resistance at the final bear market trend line. If that line is breached, it would indicate a trend change from bear to bull. At that stage, the bull wave count would be preferred.
MAIN BEAR HOURLY CHART
Click chart to enlarge.
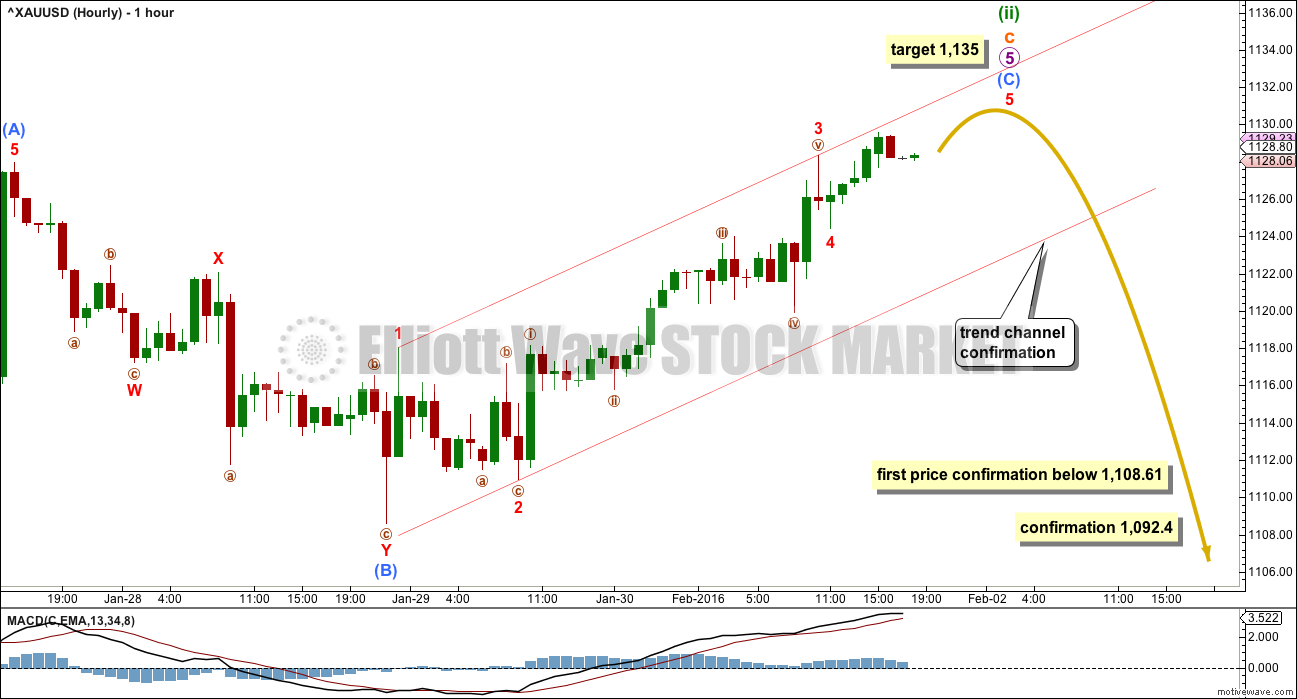
All subwaves must subdivide as zigzags within the ending diagonal of subminuette wave c. Micro wave 5 must be a zigzag.
Within the zigzag, submicro wave (A) may have ended and submicro wave (B) may also have ended as a double zigzag.
Upwards movement for Monday has shown a small increase in momentum beyond the last high of submicro wave (A).
The target remains the same at the 0.618 Fibonacci ratio of minuette wave (i) at 1,135. This is where upwards movement should come to touch the cyan trend line on the daily chart.
The structure of submicro wave (C) could be complete at any stage now. A clear breach of the small red channel drawn about it would be the earliest indication that it may be over.
First price confirmation of a trend change would come with a new low below 1,108.61. At that stage, downwards movement could not be a second wave correction within submicro wave (C), so at that stage submicro wave (C) would have to be over.
A new low below 1,092.4 would invalidate the alternate hourly count below and provide further confirmation of a trend change.
ALTERNATE BULL WAVE COUNT
Click chart to enlarge.
This was published here as a second alternate wave count. I will use it as the only regular alternate bull wave count because it is the only bull wave count to meet all Elliott wave rules.
I want to remind members that last time Gold saw a reasonable upwards movement from 24th July, 2015, to 15th October, 2015, there were many who expected that rise meant the bear market had ended and a new bull market had begun. It turned out that idea was premature: price turned around and made new lows. On 21st August I developed three bullish wave counts, partly in response to a demand from members, and one by one they have all been eliminated.
Now, again, price rises and there is a demand for bullish wave counts.
It is my strong view that this is premature. I will publish this wave count with that strong caveat.
Eventually the market will change from bear to bull, and when that change is confirmed that is the time to have confidence in a bull wave count. That time is not now.
Price remains below the 200 day moving average. Price has made a series of lower highs and lower lows down to the last recent low. There is not a clear five up on the daily chart. Price remains below the bear market trend line. While price remains below that line this wave count will be an alternate and comes with a strong warning that it is premature.
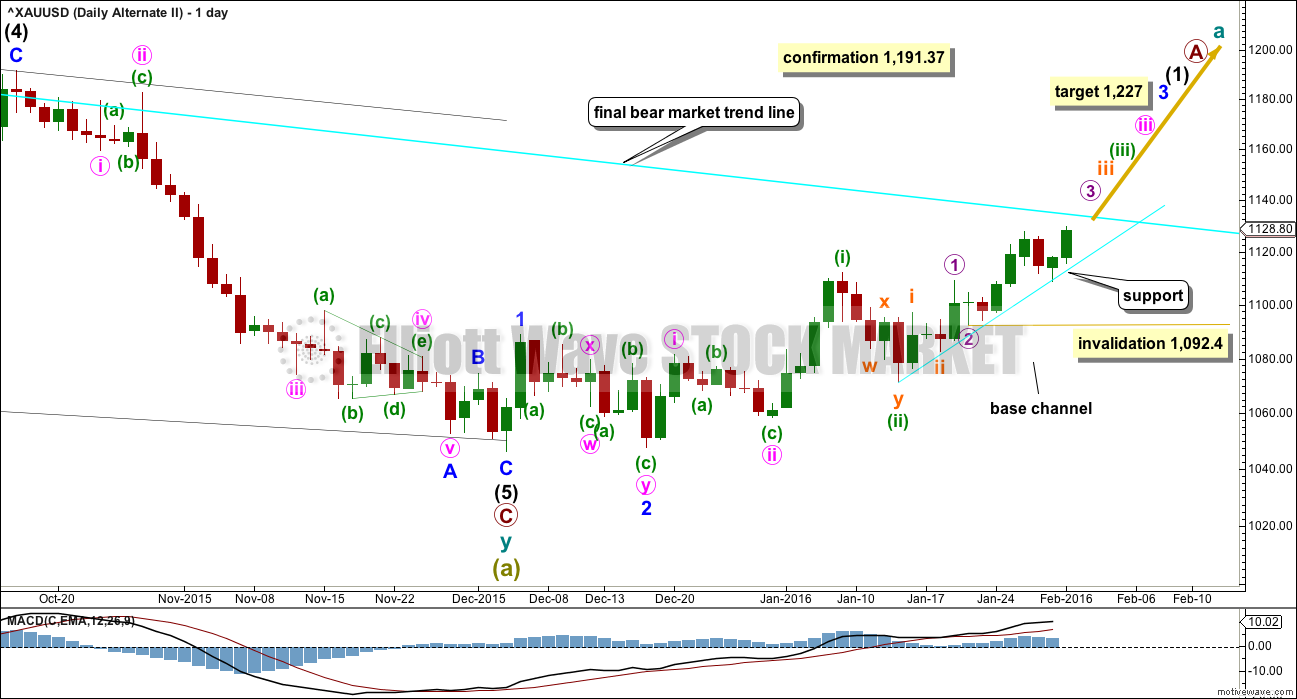
Downwards movement from the all time high for this bull wave count is seen as a big double zigzag which would most likely be complete at super cycle degree for an A wave.
When an A wave subdivides as a three, then the larger structure may be either a flat or triangle. The B wave may make a new price extreme beyond the start of the A wave within flats and triangles. Here, super cycle wave (b) may move above 1,920.18 as in an expanded flat or running triangle.
When the first move of a larger correction subdivides as a multiple (w-x-y), then a combination may be eliminated. Combinations may not have multiples within multiples, because that would increase the number of corrective structures within a multiple beyond three and violate the rule.
A new wave up at super cycle degree must begin with a clear five up on the daily chart (and probably the weekly as well). So far only minor waves 1 and 2 are complete. At 1,227 minor wave 3 would reach 4.236 the length of minor wave 1.
Minute waves i and ii are complete within minor wave 3. The acceleration channel is not working, so a more conservative base channel is drawn about these two waves. Copy it over to the hourly chart. A lower degree second wave correction for minuette wave (ii) should not breach a base channel drawn about a first and second wave one or more degrees higher.
The daily chart is on a semi-log scale and the hourly chart is on an arithmetic scale. This means channels sit slightly differently between these charts. The base channel has been breached now by upwards movement on both charts. The base channel on the hourly chart on an arithmetic scale is today perfectly showing where downwards movement is finding support. It may continue to do so.
Only submicro wave (1) may be complete within micro wave 3. This is shown on the hourly chart.
Gold often exhibits swift strong fifth waves, particularly the fifth waves to end its third wave impulses. Be aware of this tendency, because it could mean that any one of or more than one of micro wave 5, subminuette wave v, minuette wave (v) and minute wave v could be very strong upwards movements. If this is the case, then for this wave count it would take price comfortably above the final bear market trend line. If that happens, then this wave count would be the preferred wave count.
The hourly chart for this alternate today will show the whole of movement from the end of micro wave 2.
Click chart to enlarge.
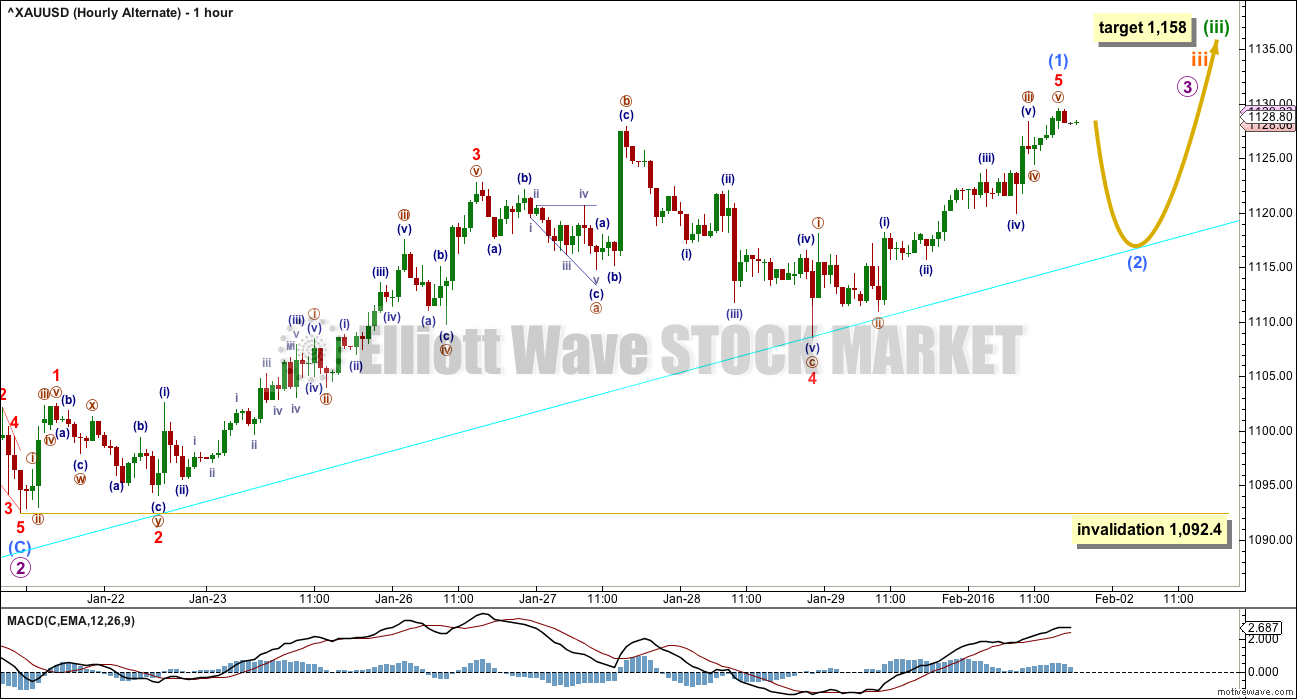
It may again be that only submicro wave (1) is completing now within the middle of this third wave.
This new way of looking at upwards movement resolves a couple of problems. Now minuscule waves 2 and 4 exhibit alternation within the impulse of submicro wave (1): minuscule wave 2 is a double zigzag and minuscule wave 4 is an expanded flat. Now the downwards wave labelled nano wave c within minuscule wave 4 can be seen as a five.
Upwards movement to start this big third wave is so far finding support at the short term cyan trend line copied over from the daily chart. If this wave count is correct, then price must continue to find support at that line. Upwards movement should be increasing in momentum and should be supported by volume. The slope of the wave up should increase, not decrease, as the middle of a third wave unfolds.
A break below the cyan line would substantially reduce the probability of this wave count.
Submicro wave (2) may not move beyond the start of submicro wave (1) below 1,092.4.
The target for minuette wave (iii) remains the same. At 1,158 it would reach 1.618 the length of minuette wave (i).
TECHNICAL ANALYSIS
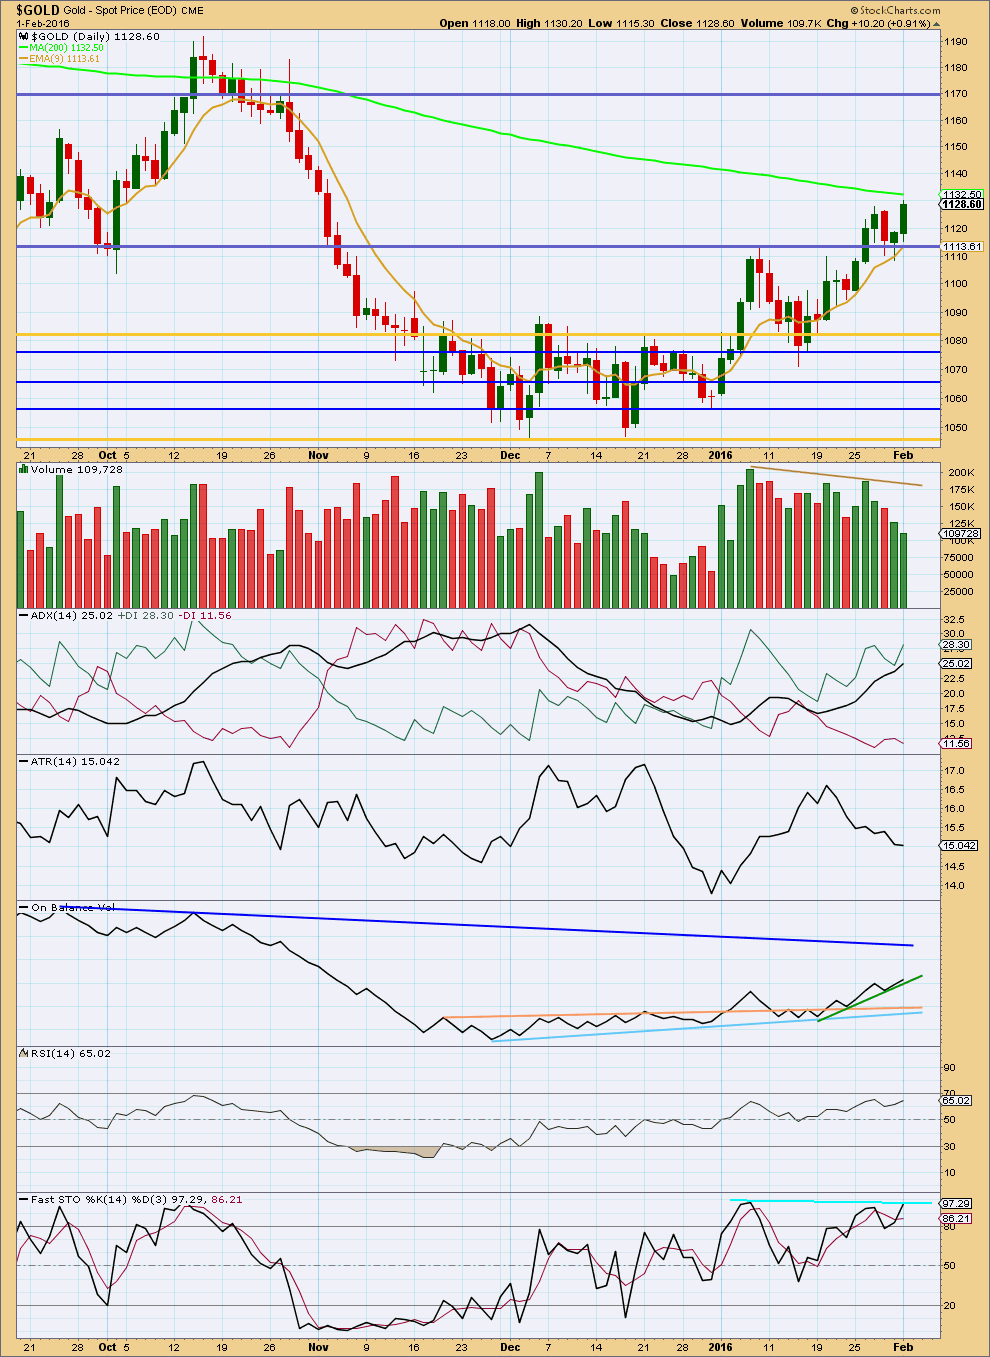
Click chart to enlarge. Chart courtesy of StockCharts.com.
Price is making new highs and volume continues to consistently decline. This strongly favours the main bear wave count over the bull.
ADX and ATR are still divergent. ADX indicates an upwards trend is in place but ATR indicates the market is not trending. This also favours the main bear wave count over the bull. If this upwards movement is a short term trend within a larger correction, then this divergence between ADX and ATR makes sense.
On Balance Volume would provide some weak bearish indication, if it breaks below the short term green line. It should find resistance at the upper blue line.
RSI has not yet reached an extreme and does not show divergence.
Stochastics still shows divergence. Stochastics is failing to make corresponding highs while price is making new highs. The divergence is weak, so it provides weak support to the main bear wave count.
This analysis is published @ 08:49 p.m. EST.
….with a bearish key reversal in play, expecting Gold price to drop for a break below Tuesday low (1122.60) and if can break below 1114-13 to test 1111-10…. Gold price remains bullish, will look to stay long (personal choice) unless a break below 1110 occurs (rising support)…..
* IMHO a bullish crossover of 20dma above 100dma is not far from in the making unless Gold price gets below 100dma 1107-06 before the crossover occurs, which looks unlikely but one never knows* lol Good luck all.
Todays analysis will be pretty much the same as yesterday.
We don’t have confirmation that the downwards trend has resumed. There remains a risk that price could yet move higher. We don’t have a high in place confirmed.
We need to see the upwards sloping cyan trend line on the alternate daily chart breached before any confidence may be had that a high may be in place.
Gold is struggling to make new highs, it doesn’t look good for the bull wave count at all. I expect price may be finding strong resistance about that final bear market trend line. It is very long held and highly technically significant.
This will be my personal approach to this market:
I’m out at the moment. I closed my buy positions a few days ago. I didn’t get the full movement, but I got the middle and that’s good enough for me. I think actually that is all anyone should ever aim for.
I’m going to wait until that cyan line on the alternate daily chart is breached by downwards movement before I even consider entering short. While I think the bear count has more support at this time there is the risk that the final bear market trend line could be overshot again. And I don’t want to try and pick the high.
If the upwards sloping line on the alternate chart is breached then I’ll look at the technicals carefully, and mostly I’ll be looking at volume. If we see a good down day with high volume I’ll have confidence to find an entry for a short position.
For now I’ll wait.
Gold struggling. Seems the correction up is done. Going short April gold contracts, to under $1000. Thanks lara.
Hi. You may be pre-empting this going short just yet. A break above 1131 looks imminent with upside risk coming in at 1148-49 with a breach above here likely to carry on further for a test of 1165-66. Gold price is having difficulty getting below 1122 and bottomy this week with support at 1107-06 rising by about $3 a day. IMHO it is probably better to initiate longs on the pullback/drop/s….Gold price remains highly bullish and has not shown signs of topping just yet. I guess time and price will tell. Good luck.
The cyan trend line on the hourly alternate chart has not been breached yet.
The risk remains that Gold may continue higher while we still don’t have any confirmation of a trend change.
The channel on the main hourly chart isn’t breached either.
Please manage risk carefully. If you want to pick a high (which is entirely your prerogative) then ensure you manage the risk to your account.
Submicro wave 1 maybe 1131.11 at 9:51 high, submicro 2 maybe at 1122.38 low at 12:19 pm then turned up maybe in submicro wave (3) quicker and sharper up.
Alternate Hourly – Only submicro wave (1) may be completing now. Upwards movement is finding support at the short term cyan trend line (about the 1,125 area). If this wave count is correct, then price must continue to find support at that line. Upwards movement should be increasing in momentum and the slope of the wave up should increase.
It seems that the channel it was breach and in this moment the prices are retesting it.
It didn’t appear to be breached by at least 1 full hour candlestick for a proper breach.
Thanks Richard !
I do not have a computer in this moment and on the iphone it seems breach, but I cannot draw a chanell perfectly….
Not breached yet.
Gold made a low of the day at 1,122.38 at 12:19 pm and didn’t quite breach the bear hourly wave count small red channel lower edge, which looks around the 1,125 area. Don’t know if it is on the way back up to the 1,135 target or if the high is over and it’s on the way down even lower.
“The structure of submicro wave (C) could be complete at any stage now. A clear breach of the small red channel drawn about it would be the earliest indication that it may be over. “
Gold and oil and the US stock markets are all dropping today.
Perhaps gold is dropping to complete Alternate hourly – submicro wave (2) at about 1,117 area before heading back up.
DUST is moving up today from yesterday’s low of 12.30.
Today DUST low of 12.50 and now at 13.37.at 12:01 pm.
Or perhaps another wave count is in play to do with main hourly wave count heading up to finish at 1,135 area.
Any wave counts?
Hi Lara,
Is there a way to know which “bottom” is correct when drawing a Fibonacci retracement?
I have been using 1108.26 and then “updating it” with each new high, but today a Fibonacci retracement using 1119.66 as the base seems to be attracting the candles in a stall pattern to the proper places….
Is there a hard rule about selecting the correct bottom?
11:30 new york time…
.a strange thing seems to have happened….about an hour after london opened (6:00 new york) the price bottomed out at 618 % with the 1119.66 base line,
BUT at 11:30 New York time, the price bottomed out at exactly the 38.2% of the 1108.26 base line of the Fibonacci
I guess that suggests one Fibonacci retracement is NOT enough …..different times during the day require different retracement calculations..
I use Fibonacci retracements on Elliott waves.
From the start to the end of the wave exactly. The orthodox end that is, the end of the final fifth wave.
And I only use a Fibonacci retracement when the wave is complete.