
Two hourly Elliott wave counts were invalidated, which leaves only two.
The situation is becoming clearer.
Summary: Minute wave iv may continue sideways as a triangle, possibly for six more days to total a Fibonacci thirteen. In the short term, a new high above 1,219.95 would confirm this idea. Alternatively, minute wave iv may end in one more day if it is a zigzag and touches the lower pink trend line. A new low below 1,190.9 would invalidate the triangle and confirm a zigzag.
New updates to this analysis are in bold.
Last published weekly chart is here.
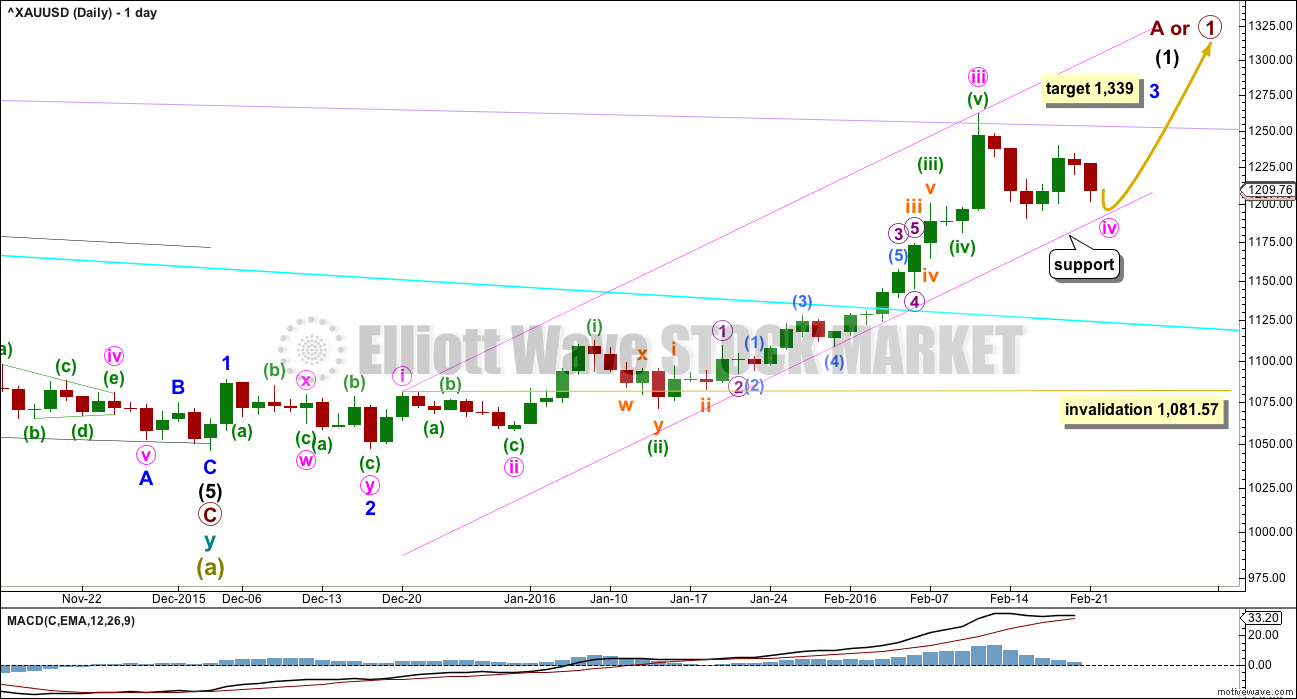
DAILY ELLIOTT WAVE COUNT
Click chart to enlarge.
Gold has very likely changed from bear to bull.
So far, within the first five up, the middle of the third wave is now most likely complete. The strongest move may still be ahead. Gold typically exhibits swift strong fifth waves to end its third wave impulses. Look out for surprises to the upside for minute wave v and minor wave 5.
At 1,339 minor wave 3 would reach 6.854 the length of minor wave 1. When minute wave iv is confirmed as over, then this target may be calculated at a second degree. At that stage, it may widen to a zone, it may change, or a second target may be added.
Minute waves i, ii and now iii are complete within minor wave 3.
The pink channel is a best fit. Draw the first trend line from the highs labeled minute waves i to iii then place a parallel copy lower to contain the whole upwards wave. Minute wave iv may find support at the lower pink line. If price touches that line, it should offer a low risk entry point to join the upwards trend.
Minute wave iv may not move into minute wave i price territory below 1,081.57.
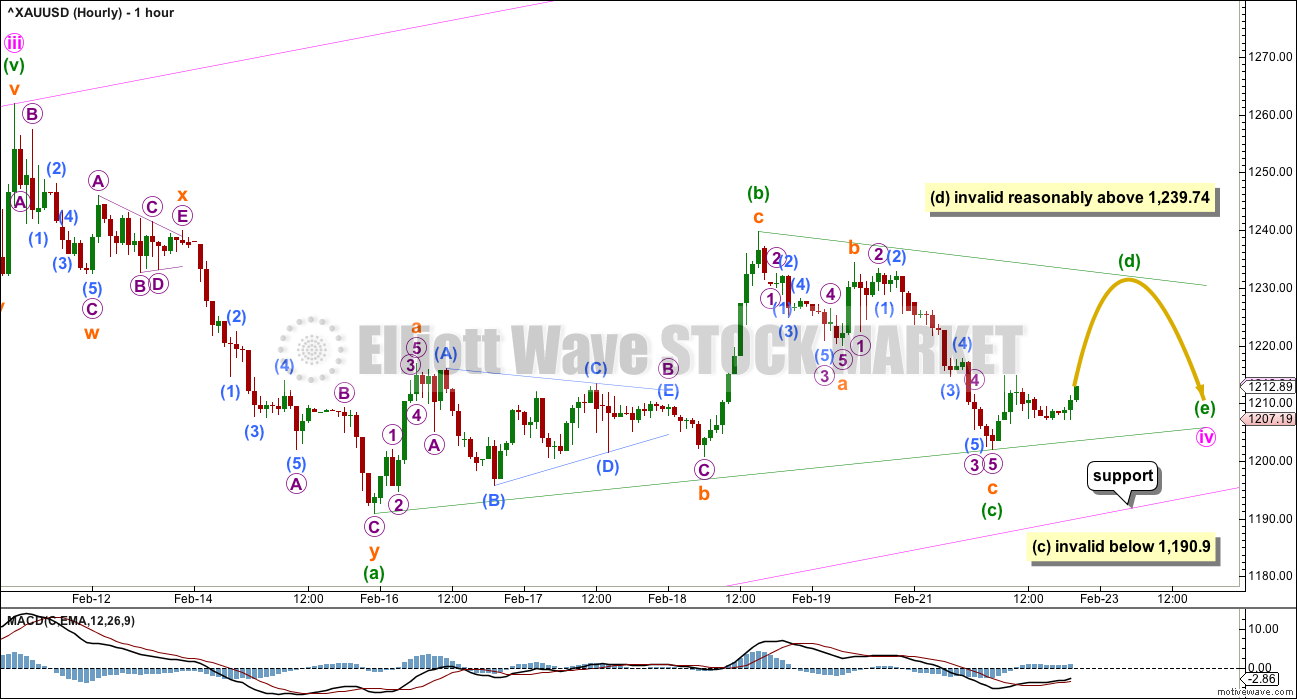
MAIN HOURLY WAVE COUNT
Click chart to enlarge.
This main hourly wave count expects to see alternation in structure between the zigzag of minute wave ii and the triangle of minute wave iv. This is the main wave count for this reason only.
If minute wave iv is a triangle, then it may be a regular contracting or barrier triangle. So far minuette waves (a) and (b) may be complete.
Minuette wave (c) may not move beyond the end of minuette wave (a) within both a contracting and barrier triangle. A new low below 1,190.9 would invalidate the triangle and confirm the alternate wave count below.
Minuette wave (d) may not move beyond the end of minuette wave (b), above 1,239.74, within a regular contracting triangle.
Minuette wave (d) may not move reasonably beyond the end of minuette wave (b), above 1,239.74, within a regular barrier triangle. A barrier triangle may be correct as long as the (b)-(d) trend line remains essentially flat. In practice this means the minuette wave (d) may move slightly above 1,239.74. This is the only Elliott wave rule which is not black and white.
Minuette wave (e) may not move beyond the end of minuette wave (c) for both a regular contracting and regular barrier triangle. Minuette wave (e) is most likely to fall short of the (a)-(c) trend line. If it does not end short of that line, then it may end with an overshoot of the line.
If MACD begins to hover about zero on the hourly chart, then this main wave count would be supported.
So far minute wave iv has lasted seven daily candlesticks. A triangle would not be able to complete in just one more day to total a Fibonacci eight. If minute wave iv is a triangle and completes with a Fibonacci duration, then it may continue now for a further seven days to total a Fibonacci thirteen.
If it takes that long, then it may end when price comes to touch the lower edge of the pink channel.
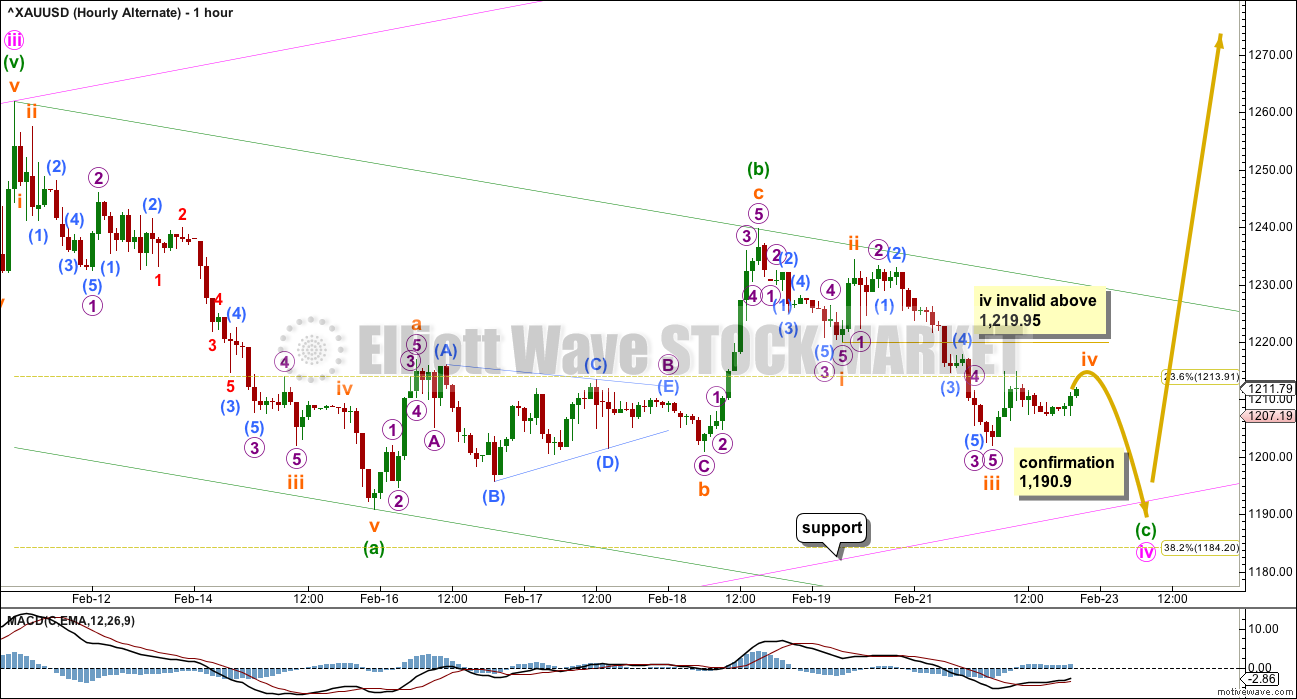
ALTERNATE HOURY WAVE COUNT
Click chart to enlarge.
This alternate wave count is an alternate only because it would see minute waves ii and iv both single zigzags, so there would be no alternation in structure. Alternation is a guideline, not a rule, and is not always perfect. So this wave count is valid, but must necessarily have a lower probability than the main wave count.
What if my analysis of the downwards wave labelled here minuette wave (a) is wrong for the main hourly wave count? What if it was not a double zigzag but was an impulse?
Zigzags and impulses often have a very similar look. Both possibilities must be considered.
If a single zigzag is completing for minute wave iv, there would still be inadequate alternation between minute waves ii and iv. There would be alternation in depth but not structure.
This wave count expects a little more downwards movement to end about 1,184, if minute wave iv is to end at the 0.382 Fibonacci ratio and find support at the pink trend line.
In the short term, minuette wave (c) of the zigzag must complete as a five wave structure. Within minuette wave (c), subminuette wave iv may not move into subminuette wave i price territory above 1,219.95. A new high above 1,219.95 short term (before a new low below 1,190.9) would invalidate this alternate wave count and confirm the main hourly wave count.
Minuette wave (c) would be extremely likely to make at least a slight new low below the end of minuette wave (a) at 1,190.9 to avoid a truncation. Once it has done that, then look for support at the pink trend line. If that happens, it should offer a low risk entry to join the upwards trend.
TECHNICAL ANALYSIS
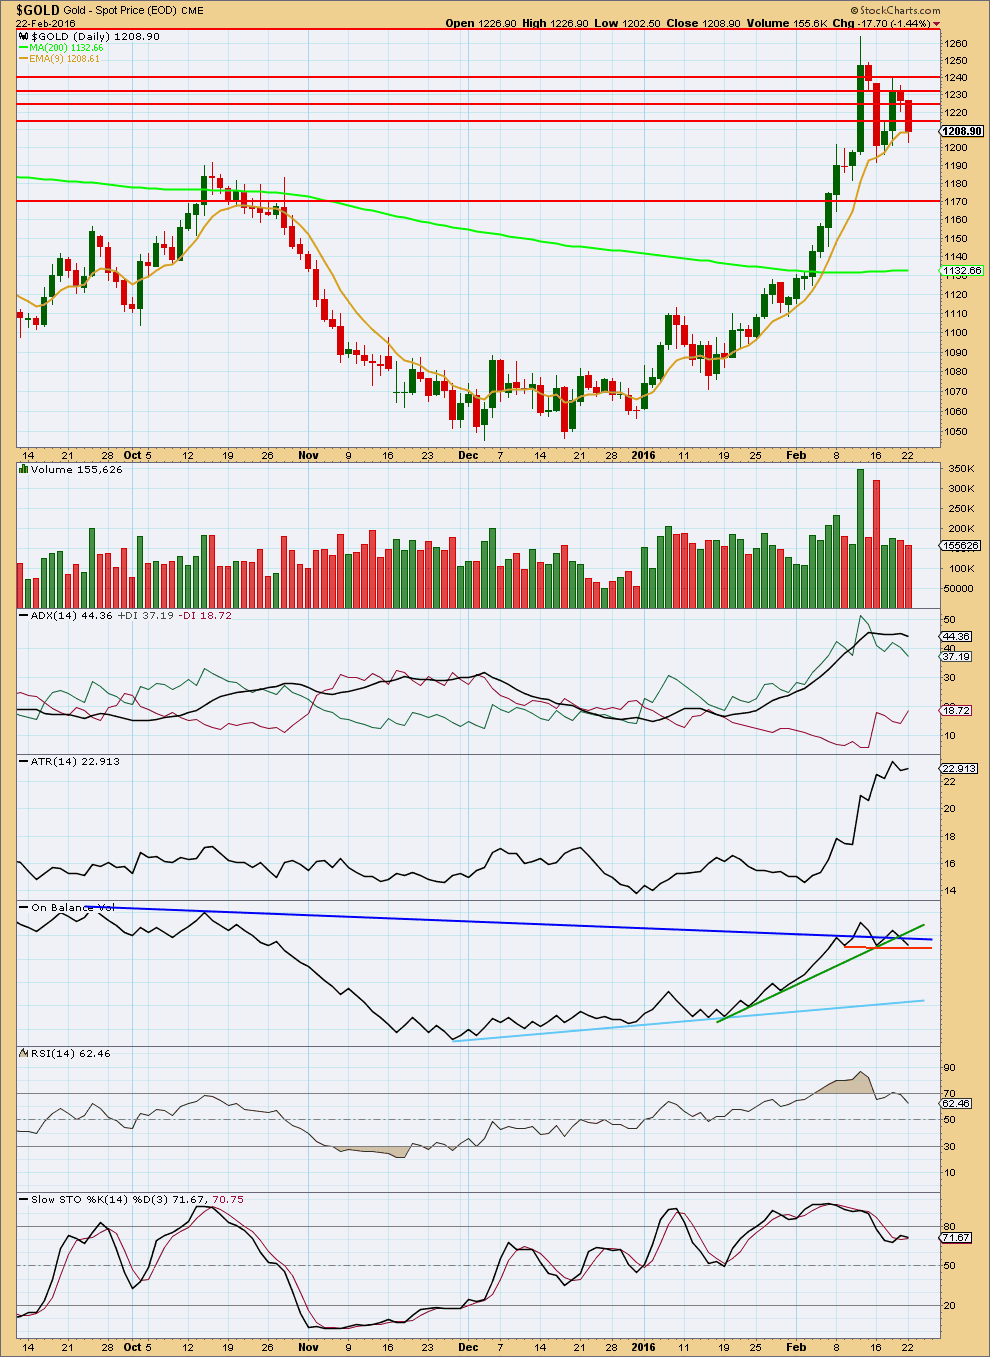
Click chart to enlarge. Chart courtesy of StockCharts.com.
Overall, as price moves sideways, volume declines for the last six days (with the exception of the outlier of 16th February). Overall, this looks typical of a correction.
Two days in a row price has fallen on declining volume. This is bullish and indicates that the fall in price is not supported by volume and is more likely a correction against the trend rather than the start of a new downwards trend.
ADX agrees as it is declining, indicating the market is not trending. ADX has not indicated a trend change: the +DX line remains above the -DX line, so the trend when it resumes would still be up.
ATR disagrees as it is slightly increasing today. This is more typical of a trending market.
On Balance Volume broke below the dark blue trend line and the green line. The next line of support also is not very technically significant. The short red line has only been tested once before; OBV is touching this today. The next line to offer support for OBV would be the light blue line which is a long way away.
This correction has returned RSI from overbought. Only when RSI shows divergence with price at two consecutive swing highs will I expect to see a deeper and longer lasting correction unfold. So far RSI has not shown divergence with price at highs.
Stochastics is returning from overbought.
I have taken some time to look back over price data back to December 2010. I have noted wide ranging days (a wide range compared to several days immediately prior) which completed a trend with a spike in volume and looked at how long the following correction lasted. This list is not exhaustive; it is the few that appeared to be clear from a visual identification. (I did not find any wide ranging days with volume spikes at the end of movements for the end of the last bull market from December 2010 to September 2011). Results are listed here:
Past wide ranging days with volume spikes at the end of movements:
Date, Price range, Volume (K), Result (any candlestick pattern?)
26 Sep 2011, $128.07, 150.3, 31 day correction (hammer)
4 Jan 2013, $38.19, 297.1, 12 day correction (hammer)
15 Apr 2013, $83.03, 24.4, low next day, 8 day correction
19 Jul 2013, $26.87, 222.1, 2 day correction
15 Oct 2013, $35.88, 298.9, 9 day correction (hammer)
18 Dec 2013, $28.23, 183.7, 5 day correction
19 Jul 2014, $45.65, 158.5, 5 day correction
My conclusion is that a wide ranging day at the end of a movement which has a volume spike should result in a correction lasting two to eight days. If the wide ranging day is also a single candlestick reversal pattern (a hammer in a downtrend, or a shooting star or hanging man in an uptrend), then the correction that follows it may be more long lasting.
In this instance for 11th February, 2016, the candlestick is not a reversal pattern, so a more brief correction looks most likely.
This analysis is published @ 09:50 p.m. EST.
Whatever your longer term views may be, please be open to the idea of a severe decline in gold prices over the next couple months. Gold rose too quickly for this pace to be sustained. Seasonality should be a factor too in bringing it back down. I’m looking for lower 1100s by Apr/May and see this week as a superb shorting opportunity.
The decline you refer to will likely be Intermediate wave 2, which will be a great buying opportunity.
Lara, please forgive my posting of a different topic– I am wondering when do you typically post your updates for the S&P500 analysis that you do?
My apologies Lara. Just read the FAQs which provided your answer, and I imagine it is much like EWG.
No worries.
I need to wait until StockCharts volume data is finalised. That happens at 6:30pm EST.
The analysis of each market takes an hour absolute minimum. Often a fair bit longer.
I usually do Gold first.
So far so good for the triangle scenario.
Wave D upwards so far has a count of five, it needs one more high to have a count of seven so that it fits as a zigzag.
It can’t move substantially above 1,239.74.
And then E down can’t move below 1,201.95.
I’ll be looking at seeing this triangle as a B wave within a larger zigzag. What would that look like? I have to chart it and check it all fits.
So I may have another idea for you today.
But again, the conclusion is fairly strong that minute iv isn’t over. More sideways movement in a typical consolidation for a few days yet.
Take this as an opportunity. An opportunity to get nicely positioned for the next wave which should be up.
I used corrective instead of impulsive numbering for wave 1, due to the 4th sub-wave violating slightly the 1st sub-wave. Wave 2 is in A-B-C form leading to the 3, whereas the A-B-C-D-E refers to a corrective Z-wave with 1 being replaced by X. I change nothing in my published chart.
Perhaps you would prefer the following count: http://www.tradingview.com/x/wpzPmVs9/
There are many ways of interpreting a chart via EW.
Kind regards
cfetrader
That makes no sense.
Richard, I don’t think this person understands Elliott wave.
The wave count here is not fitted into the bigger picture, he’s only labelled a small portion of the price movement.
A-B-C-D-E is triangle labelling. That’s most definitely not a triangle. It meets the rules of no Elliott wave triangle. A “Z” wave should be a three or a triangle, and that’s not a triangle.
I wouldn’t be looking at this persons work. It will waste your time, and put you on the wrong track.
Thanks Lara, you’re the best.
🙂 No worries. That’s what I’m here for
Lara to the rescue.
Gold hasn’t completed a full 5 wave count up to intermediate wave (1) yet.
Perhaps it may complete it in March?
That my rough guess may be the $1500 area.
Then intermediate (2) down to test a new low or not.
Perhaps it may complete it down before the summer.
Then if no new gold low then intermediate wave (3) up in a very strong and long wave up dollar and time wise.
Any other rough guesses?
“key support lying between $1,190 and $1,200 an ounce”
This sound like Lara but it is not.
Lara is 1202 or maybe pink line (maybe 1195 area)
Gold rebounds as safe-haven demand returns – Feb 23, 2016 12:11 p.m. ET
http://www.marketwatch.com/story/gold-rebounds-as-safe-haven-demand-returns-2016-02-23
If wave iv is triangle then Lara:” Minuette wave (e) may not move beyond the end of minuette wave (c) for both a regular contracting and regular barrier triangle.”
Gold move down will be limited to wave c price point 1202.
Yes, it looks like a triangle.
My only concern now is that triangles are very tricky structures. Just when you think you have it correctly labelled it morphs into a combination or the triangle was a B wave within another corrective structure.
What I am reasonably confident of is minute iv is not over and is very likely a triangle.
Tomorrow I’ll be looking for an alternate corrective structure unfolding. So there may be more than one hourly chart again.
I’m sure Lara will post an oil update soon and I look forward to her analysis. At this point I think Minor 4 is continuing and I think a triangle is most likely based on the recent hourly movement and because a triangle will provide alternation with Minor wave 2 as opposed to another flat.
Oil is being proofed now and will be published shortly.
Thank you for your patience.
Yes, a triangle is definitely a possibility.
The alternate hourly wave count was invalidated at 10:30 pm EST when gold went above the 1,219.95 invalidation point up to 1,221.04.
“A new high above 1,219.95 short term (before a new low below 1,190.9) would invalidate this alternate wave count and confirm the main hourly wave count.”
Main Hourly wave is the only hourly left now. – If minute wave iv is a triangle and completes with a Fibonacci duration, then it may continue now for a further seven days.
Lara the date on your hourly charts for today should be Feb 22 instead of Feb 21.
Lara thank u..
Triangle is confirmed meanwhile as it is trading above the confirmation price…the early asian markets move suggest that we might might reach our wave d target in a day or two and wave e may end before fib 13days…anyways good thing is this week may have a completed minutte 4 likely…
Ruppu thanks for noticing the invalidation.
EW gold chart – from cfetrader
The current c-wave target centers around the pitchfork median line at approximately 1170. The strange thing about EW numbering (http://bit.ly/218TF7B) is that both a bullish & bearish case can be made:
(1) Bullish: Wave 1(w-x-y-x-z), Wave 2(a-b-c), Wave 3(pending; target 1450).
(2) Bearish: Corrective wave a-b-c extension d-e (with further subdivisions possible with respect to e; target <=1000).
https://www.tradingview.com/x/H5aQcdoL
Is this chart labelling meets EW rules..??..
We have invalidated bears with price so how can the chart still continue…for bears we need a new chart analysis
It is not from Lara. It is from someone else. They are doing their own analysis and charts.
A first wave may not subdivide as a corrective structure (with the exception of a first wave in a leading or ending diagonal which should be a zigzag).
Furthermore triples (W-X-Y-X-Z) are very rare.
A second wave as A-B-C-D-E? No. Second waves may not be triangles, and as that possibility is shown it violates the rules for all kinds of triangles.
This wave count does not meet Elliott wave rules.
Do not follow that analyst in regards to Elliott wave. It is not a good use of your time.
And the trajectory of that first wave?
It makes zero sense in terms of Elliott wave.