
One of the remaining two hourly Elliott wave counts was invalidated.
I will continue to consider all possibilities. I have a new idea today.
Summary: The correction is incomplete. If it totals a Fibonacci thirteen when complete, then it may end in another five sessions. The upwards trend should resume when the correction is complete.
New updates to this analysis are in bold.
Last published weekly chart is here.
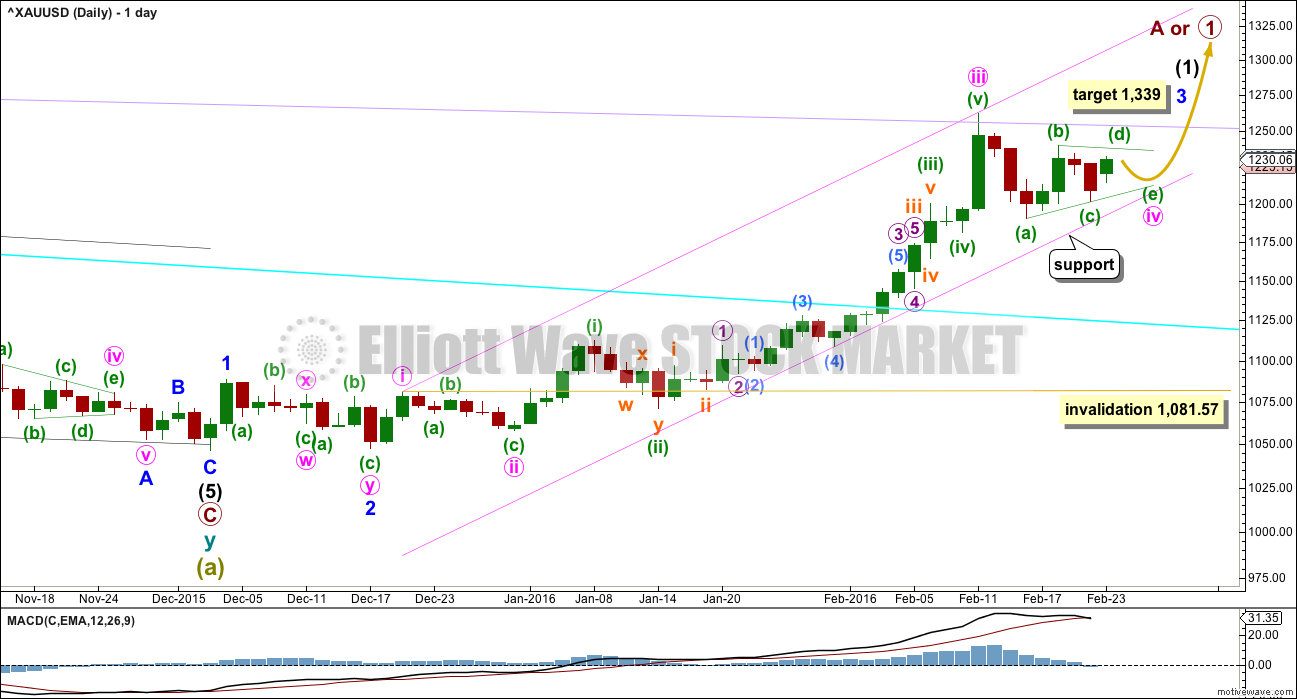
DAILY ELLIOTT WAVE COUNT
Click chart to enlarge.
Gold has very likely changed from bear to bull.
So far, within the first five up, the middle of the third wave is now most likely complete. The strongest move may still be ahead. Gold typically exhibits swift strong fifth waves to end its third wave impulses. Look out for surprises to the upside for minute wave v and minor wave 5.
At 1,339 minor wave 3 would reach 6.854 the length of minor wave 1. When minute wave iv is confirmed as over, then this target may be calculated at a second degree. At that stage, it may widen to a zone, it may change, or a second target may be added.
Minute waves i, ii and now iii are complete within minor wave 3.
The pink channel is a best fit. Draw the first trend line from the highs labeled minute waves i to iii then place a parallel copy lower to contain the whole upwards wave. Minute wave iv may find support at the lower pink line. If price touches that line, it should offer a low risk entry point to join the upwards trend.
Minute wave iv may not move into minute wave i price territory below 1,081.57.
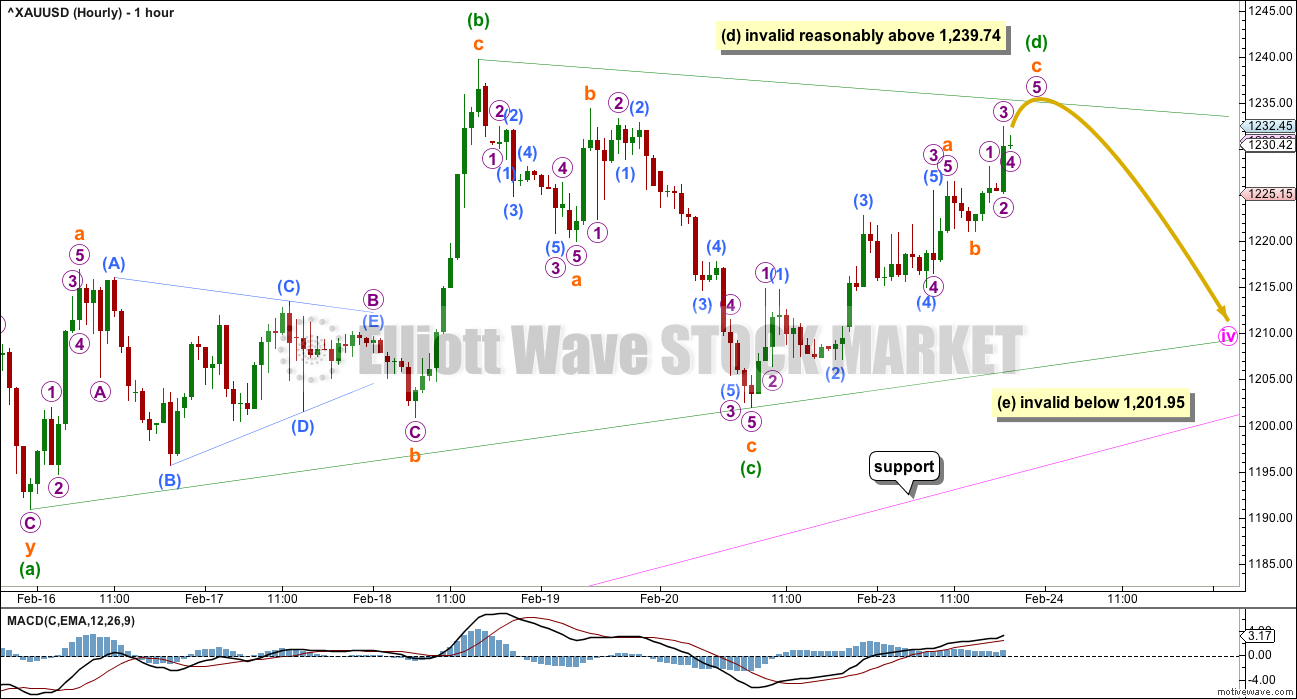
MAIN HOURLY WAVE COUNT
Click chart to enlarge.
This main hourly wave count expects to see alternation in structure between the zigzag of minute wave ii and the triangle of minute wave iv. This is the main wave count for this reason only.
If minute wave iv is a triangle, then it may be a regular contracting or barrier triangle. So far minuette waves (a), (b) and (c) may be complete.
Minuette wave (d) may not move beyond the end of minuette wave (b), above 1,239.74, within a regular contracting triangle.
Minuette wave (d) may not move reasonably beyond the end of minuette wave (b), above 1,239.74, within a regular barrier triangle. A barrier triangle may be correct as long as the (b)-(d) trend line remains essentially flat. In practice this means the minuette wave (d) may move slightly above 1,239.74. This is the only Elliott wave rule which is not black and white.
Minuette wave (e) may not move beyond the end of minuette wave (c) below 1,201.95 for both a regular contracting and regular barrier triangle. Minuette wave (e) is most likely to fall short of the (a)-(c) trend line. If it does not end short of that line, then it may end with an overshoot of the line.
If MACD begins to hover about zero on the hourly chart, then this main wave count would be supported. This is not always seen while a triangle unfolds, but it is often seen. Sometimes MACD does not sit on zero until the triangle is ending.
So far minute wave iv has lasted eight daily candlesticks. If minute wave iv is a triangle and completes with a Fibonacci duration, then it may continue now for a further six days to total a Fibonacci thirteen.
If it takes that long, then it may end when price comes to touch the lower edge of the pink channel.
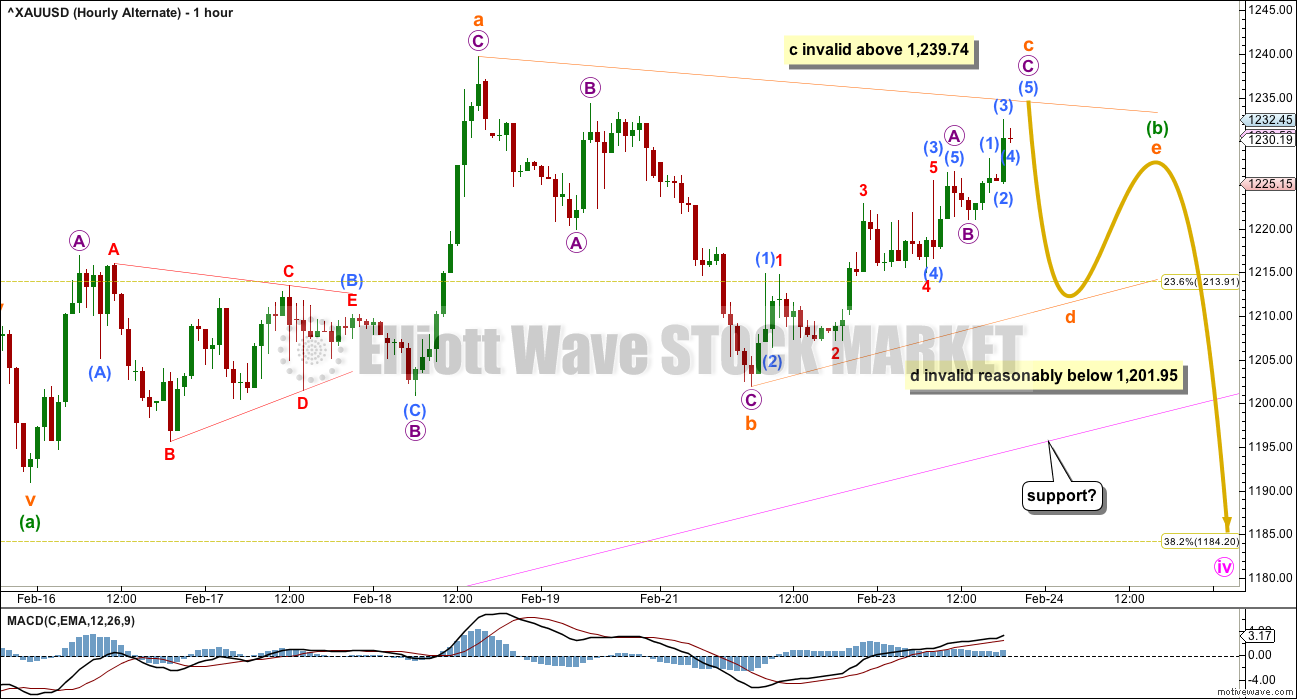
ALTERNATE HOURLY WAVE COUNT
Click chart to enlarge.
I have learned to always consider alternates when a triangle looks like it is unfolding. It is easy to mistake the beginning point of the triangle. Price should break out of the triangle in the same direction it entered, and so it is important to consider alternate possibilities with a triangle beginning at a different point.
What if minute wave iv is a zigzag and the triangle is wave B within it?
Minuette wave (a) for this idea is seen as a five wave impulse, in the same way as yesterday’s alternate saw it.
Minuette wave (b) may be an unfolding regular contracting or barrier triangle. Within both types of triangle, subminuette wave c may not move beyond the end of subminuette wave a above 1,239.74. This invalidation point is black and white for this wave count.
The rule for subminuette wave d is the same as described for minuette wave (d) on the main hourly wave count. Here, subminuette wave d may not move beyond the end of subminuette wave b below 1,201.95. This wave count will remain valid as long as the b-d trend line remains essentially flat.
Thereafter, subminuette wave e may not move beyond the end of subminuette wave c.
If the triangle completes for minuette wave (b), then a final five wave structure downwards for minuette wave (c) should unfold to complete a zigzag for minute wave iv. Minuette wave (c) would be extremely likely to move beyond the end of minuette wave (a) below 1,190.9 to avoid a truncation. At this stage, that would require a breach of the lower edge of the pink channel.
Minuette wave (c) may end about 1,184, so that minute wave iv corrects to the 0.382 Fibonacci ratio.
This wave count expects to see no alternation in structure between minute waves ii and iv. It is an alternate for that reason, so it must have a lower probability.
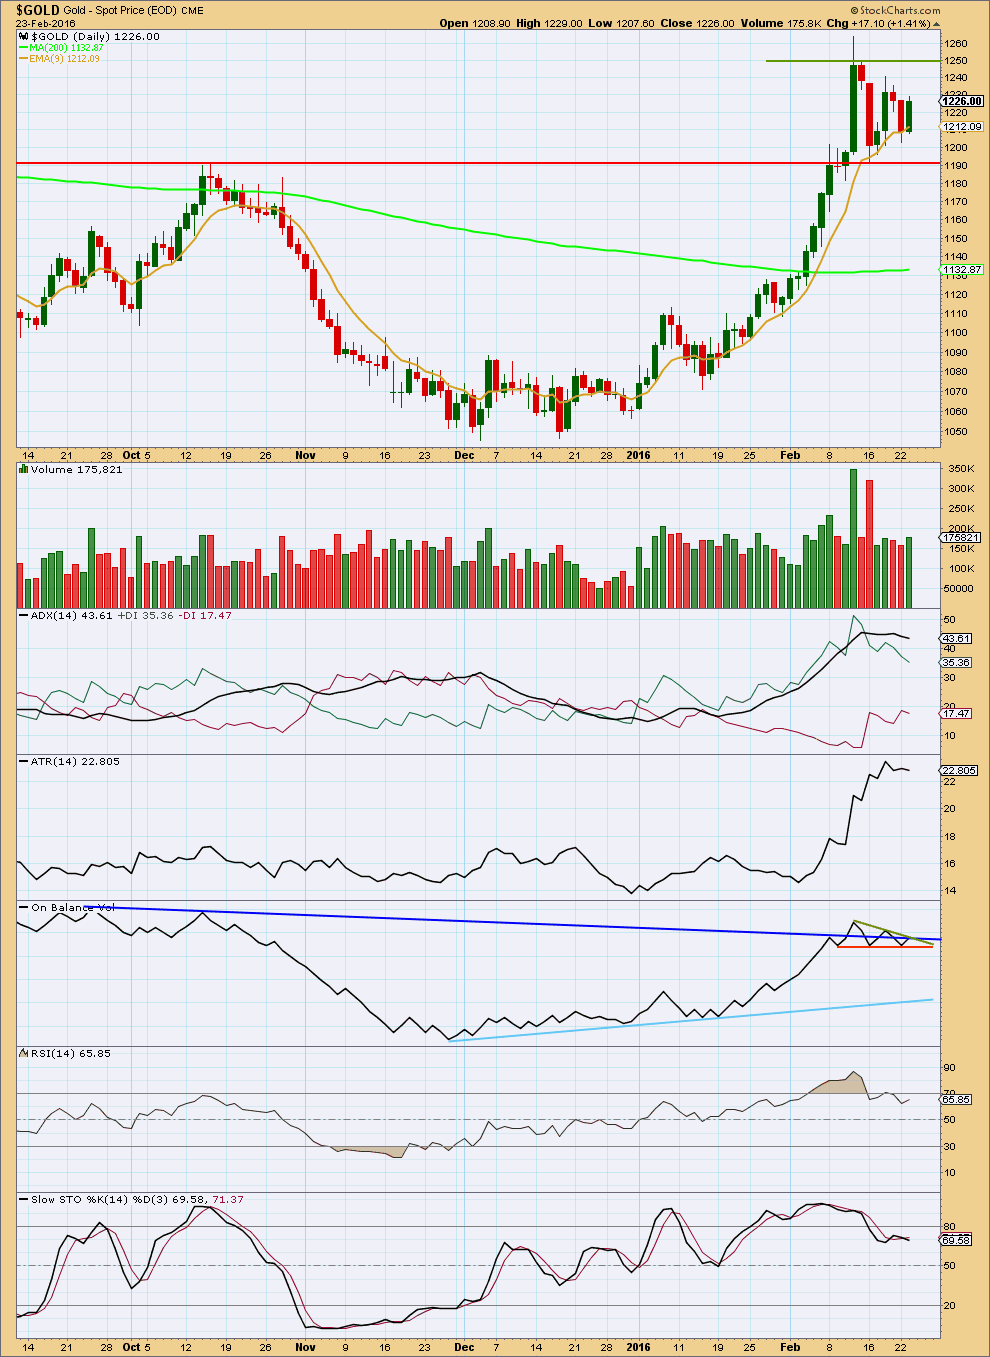
TECHNICAL ANALYSIS
Click chart to enlarge. Chart courtesy of StockCharts.com.
A slight increase in volume for upwards movement during Tuesday’s session may be some support for the idea that price may break out of this correction upwards.
The strong volume for 16th February may be an anomaly. Volume for this daily candlestick may include after hours trading for Monday 15th February which was a holiday in the USA. If this candlestick is ignored, then strongest volume during this consolidation may be for an upwards day. This suggests price may break out upwards; this supports the Elliott wave count.
If strong volume for the candlestick of 16th February is not ignored, then strongest volume during this consolidation is for a downwards day. This indicates price should break out of the consolidation downwards; this does not support the Elliott wave count.
So far during this consolidation price is finding support at the 9 day Exponential Moving Average.
ADX is declining indicating the market is not trending. ATR agrees as it too is flat.
On Balance Volume is constrained within three trend lines. A break above or below these lines may be an early indication of the direction for price to break out of the consolidation.
The trend lines on price to delineate this consolidation zone are adjusted today. The lower edge is at 1,191. This red horizontal line has previously provided resistance and now provides support. The upper edge of this consolidation is delineated by a shorter olive green line. This is about 1,250. A break above 1,250 or below 1,191 on a day with an increase in volume would be a classic breakout of a consolidation. At that stage, price should be expected to continue in the same direction of the breakout. The Elliott wave count expects the breakout to be upwards.
I have taken some time to look back over price data back to December 2010. I have noted wide ranging days (a wide range compared to several days immediately prior) which completed a trend with a spike in volume and looked at how long the following correction lasted. This list is not exhaustive; it is the few that appeared to be clear from a visual identification. (I did not find any wide ranging days with volume spikes at the end of movements for the end of the last bull market from December 2010 to September 2011). Results are listed here:
Past wide ranging days with volume spikes at the end of movements:
Date, Price range, Volume (K), Result (any candlestick pattern?)
26 Sep 2011, $128.07, 150.3, 31 day correction (hammer)
4 Jan 2013, $38.19, 297.1, 12 day correction (hammer)
15 Apr 2013, $83.03, 24.4, low next day, 8 day correction
19 Jul 2013, $26.87, 222.1, 2 day correction
15 Oct 2013, $35.88, 298.9, 9 day correction (hammer)
18 Dec 2013, $28.23, 183.7, 5 day correction
19 Jul 2014, $45.65, 158.5, 5 day correction
My conclusion is that a wide ranging day at the end of a movement which has a volume spike should result in a correction lasting two to eight days. If the wide ranging day is also a single candlestick reversal pattern (a hammer in a downtrend, or a shooting star or hanging man in an uptrend), then the correction that follows it may be more long lasting.
In this instance the correction has now lasted eight days and is incomplete.
This analysis is published @ 09:24 p.m. EST.
Avi Gilburt’s EW latest…EW 55-60% probability that the low is in for gold.
Wednesday February 24, 2016 15:10
http://www.kitco.com/commentaries/2016-02-24/What-Are-The-Probabilities-For-Lower-Lows-In-Metals.html
A view…. 1218/1216 likely holding with downside risk 1197 for an upside move is expecting for a take out of 1253….
You’re good at picking short term direction, but I’m not clear on what you’re saying. Is it that the direction now is down, but there is support not far away? Thereafter, gold should move strongly to the upside?
Personally, I believe that there is a low chance that gold will touch 1253 anytime soon.
Hi Matt: Gold price remains bullish. The low is probably already in at 1221 with unlikely to break below 1218/16 is what I am saying and if it does then 1198-97 ought to hold… I am looking to stay long on the drops… Was long on Wednesday, went short at 1251 and long again now expecting for Gold price to take out 1253 although buying in to weakness below pivot is risky…. Lets just wait for Lara’s analysis… Good luck.
Thanks for clarifying. I’m using higher prices to add to shorts.
You’re correct on the low.
Thanks Matt: I learn everyday from Lara’s analysis and the various posts here…. Looks like Gold price is already on its way up for a likely break through 1246-50 range…. To add to shorts, a break above 1265 could occur
IMHO – a two week long correction that still hasn’t managed to break the monthly high adds to the bearish case.
Gold the ‘Superhero’ May Shoot Up to $1,400: Top Forecaster
Ranjeetha Pakiam February 24, 2016 — 7:03 AM EST
http://www.bloomberg.com/news/articles/2016-02-24/how-gold-the-superhero-prompted-top-forecaster-into-a-rethink
And this is what I have second. Minute iv incomplete as a zigzag.
I want to draw a line in the sand at 1,261.94. Minuette (a) will subdivide as either a double zigzag or an impulse. Which technically means I shouldn’t be putting an invalidation at 1,261.94. But the time this structure has taken, and the inability of B to move 90% of A makes it look like a possible zigzag not a flat. Because a flat would need more upwards movement and even more time.
If this is right then while the S&P goes down hard Gold also goes down. I’m having trouble with this idea even though the subdivisions fit. I need to spend a reasonable amount of time looking at both Gold and S&P side by side and go back over daily candles for the last 2-3 months and see how many days they were in synch and how many they weren’t.
So there is a lot of work to be done today which may change this very early update for you all.
I am sorry for it, it just can’t be helped. Things take time to try and be on the right side.
Lara your charts and comments are very helpful, thank you.
Unless S&P has another zig zag up in store whilst gold completes wave c down?
Or Gold is continuing a triangle sideways while the S&P mucks about…
My analysis indicates that the S&P is on its way up (bear market rally) and should break definitively higher in the coming days/weeks. Gold, on the other hand, should continue down.
Okay, here’s what I have first. The triangle could have completed with a small E wave.
But this doesn’t look quite right.
E waves more often fall short of the A-C trend line, sometimes surprisingly short. But this looks too extreme. And the upwards movement for subminuette i could be a five, but it looks better as a three.
This is labelled just “hourly” for now, I may swap it around when I’ve had more time to consider more alternates.
And this is invalidated.
My conclusion must be that the correction is still not over.
Volume today will be really important. And I’m still concerned about how to view that volume spike for 16th February.
StockCharts volume data is quite different to COMEX volume data. I’m not publishing both, but I note the differences each day. I’m choosing to put more weight on StockCharts data, I’m making the assumption that their data may be more global but COMEX is more US based.
Gold is a global market. It would be ideal to have full volume data from the entire globe.
I agree lara
This upwards move so far could be one of two things. A B wave within minute iv or the start of minute v.
With price now back down below 1,237.97 this hour can’t be a fourth wave correction within a continuing impulse up. It looks like it’s over.
The triangle is invalidated, or it ended with a tiny E wave but that doesn’t look right.
The upwards move today is 0.87 of minuette (a). So this can’t be a flat. Minuette (a) fits as a five, this upwards move fits as a three (double zigzag) so now a five down for minuette (c) would complete a zigzag for minute iv. Target the pink trend line or 1,184.
My concern is that Gold has lately been moving in synch with the indices. As the indices go down Gold has been going up.
My wave counts for the indices are a little clearer. They’re going down. So I’d expect Gold to go up.
This kind relationship works… until it doesn’t anymore. Just because they’ve been in synch so far for a while doesn’t mean they have to continue that relationship.
Thanks Lara for the clarification. It’s mind boggling that gold could now still go down, “so now a five down for minuette (c) would complete a zigzag for minute iv. Target the pink trend line or 1,184.”
We may have missed the boat but it’s still coming back for us fence sitters to buy back into miners lower down at 1,184 in the fence sitter price territory.
I’m sure today has a lot of investors confused and gave a big shock to overnight holders of DUST and JDST. You did rightfully warn surprises would be to the upside.
As soon as we have confirmation that minute iv is over and minute v is underway, then join the trend.
Don’t wait for the perfect opportunity, because swift strong fifth waves won’t give you that.
Be prepared for your position to be underwater for 2-3 days, but it should be more likely profitable quickly than not.
Using trend lines, like what I did back Feb 4th / 5th with the green and lilac lines… draw across the last lows, and join the trend when price gets close on a small correction.
I too am a visual thinker. (And am novice to EW) I find it extremely difficult sometimes to follow a written description. Could you please post a ‘work in progress’ chart so I may follow what you are saying?
Yes, I’m working on it 🙂
Bless your heart. Thank you!
Risk is to ignore the juniors/micro juniors in this PM sector bull market.
Miners have 4 to 1 leverage over price of gold.
No sectors equities perform like this.
http://www.kitco.com/stocks/changepercentage_desc.html
Waiting for pull back.
Its this a flat correction
Even though I am a bear until mid year, this move suggests a blow out to 1300-1330
You may be right. Gold is very bullish and also helped by a collapsing oil price which spooks markets down and gold up. Too may surprises to the upside while waiting for a pullback to buy miners.
Oil dropped 4% news at 8:30 am EST and I think that rocked markets down and gold up because oil down means world economy down.
MR GOLD!!!!!..
Are you fooling us..??…
Lol
I realize that I’m in the minority, but am very bearish despite today’s move.
The scenario that may be playing out is a 2nd wave correction. The 1st wave down to 1191 was a clean 5, if you ask me. This upward movement is a 3. A plunge seems imminent to me. Naturally, if gold exceeds the recent Feb high, my idea will be invalidated.
I love your idea. I am out of my 30% positions early.
Yes I agree there will be a down movement.
BUT gold never look back once it made low in 1976 at 99. Kept going higher.
Gold was in different wave count then expanded flat completed wave c .
This is different wave count cycle wave b per Lara.
I am glad I have Lara’s EW expertise on my side.
Unless there is a new high coming right now, I believe gold will reverse to a red weekly candle. Stocks and the USD hit their lows days ago and are actually in the process of going up – even though it doesn’t look like it today. Oil may also have hit its lows and is just bobbling around in the lower area. The strength of these markets will hurt gold soon enough.
I couldn’t agree more. Lara PleasE provide an (alt) bearish count sooner rather than later. Thank you.
Will do.
Sorry Pierre, I just read your comment more carefully.
No, I will not be providing a bearish wave count for Gold.
It is above it’s 200 day moving average. Gold recently made an important new high above the prior major high of October 2015 at 1,191.70. Gold has broken above a long held bear market trend line. There are now three full weekly candlesticks above that line.
To publish a bear wave count because members ask me to would be to go against all my technical analysis observations. I’m not going to do that.
All new wave counts needed. Gold is above 1239??
It is a break out from a bullish flag on daily gold chart.
Lara: Main Hourly count; “Minuette wave (d) may not move reasonably beyond the end of minuette wave (b), above 1,239.74, within a regular barrier triangle. ”
Alternate hourly count;”Minuette wave (b) may be an unfolding regular contracting or barrier triangle. Within both types of triangle, subminuette wave c may not move beyond the end of subminuette wave a above 1,239.74. This invalidation point is black and white for this wave count.”
Watch out here comes the 1204 or lower for gold????
Gold seasonal is at play. But can not decide which part of wave count is playing the seasonal.
Is March-April low after gold completes 1339 or is it now at 1204???
Seasonal cycle is like this with Feb high March low, Apr -May high then Jun-Jul low.
What this spike means…have we ended minutte 4
Lara the accuracy of your analysis is better with this trending market, which is helpful.
Lara I meant that as a compliment.
LOL
No worries Richard.
Even if it’s a criticism that would be okay. That’s not how I read it though.