
Last analysis expected a correction should continue.
Although price breached a short term upper invalidation point the red candlestick with a long upper shadow fits a correction.
Summary: The correction is most likely still incomplete. It may continue sideways for a few days or it may end more quickly with a final wave down to 1,184 – 1,182. A new low below 1,190.9 would indicate a quicker end to this correction. When this correction is complete, then the next wave for Gold should be a strong fifth wave up. Volume analysis indicates strong upwards movement may be closer than the wave count expects; continue to look out for surprises to the upside for this market at this time.
New updates to this analysis are in bold.
Last published weekly chart is here.
DAILY ELLIOTT WAVE COUNT
Click chart to enlarge.
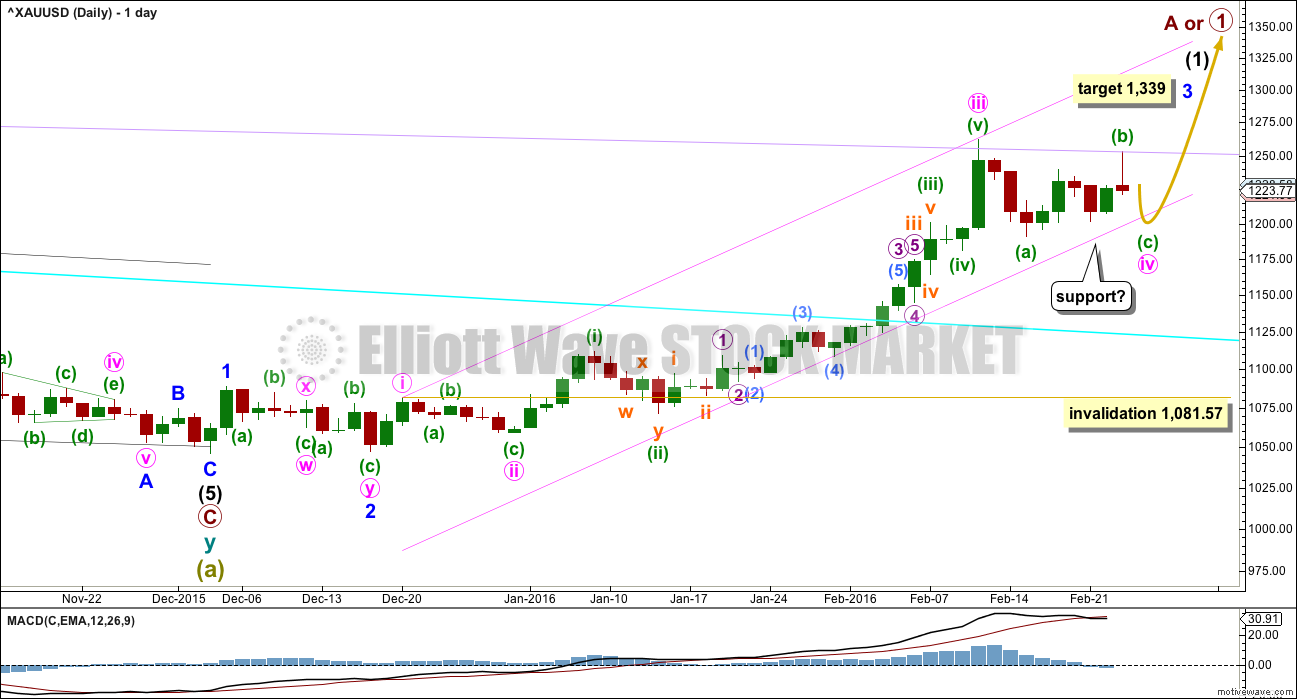
Gold has very likely changed from bear to bull.
So far, within the first five up, the middle of the third wave is now most likely complete. The strongest move may still be ahead. Gold typically exhibits swift strong fifth waves to end its third wave impulses. Look out for surprises to the upside for minute wave v and minor wave 5.
At 1,339 minor wave 3 would reach 6.854 the length of minor wave 1. When minute wave iv is confirmed as over, then this target may be calculated at a second degree. At that stage, it may widen to a zone, it may change, or a second target may be added.
Minute waves i, ii and now iii are complete within minor wave 3.
The pink channel is a best fit. Draw the first trend line from the highs labeled minute waves i to iii then place a parallel copy lower to contain the whole upwards wave. Minute wave iv may find support at the lower pink line. If price touches that line, it should offer a low risk entry point to join the upwards trend. The main hourly wave count today expects this line to be breached. Sometimes fourth waves are not nicely contained within channels; sometimes the channel is overshot. If this channel is overshot, it should not be by too much and price should return back into the channel fairly promptly. If this channel is breached by a full daily candlestick below and not touching it, then the wave count would be in doubt at the daily chart level.
Minute wave iv may not move into minute wave i price territory below 1,081.57.
MAIN HOURLY WAVE COUNT
Click chart to enlarge.
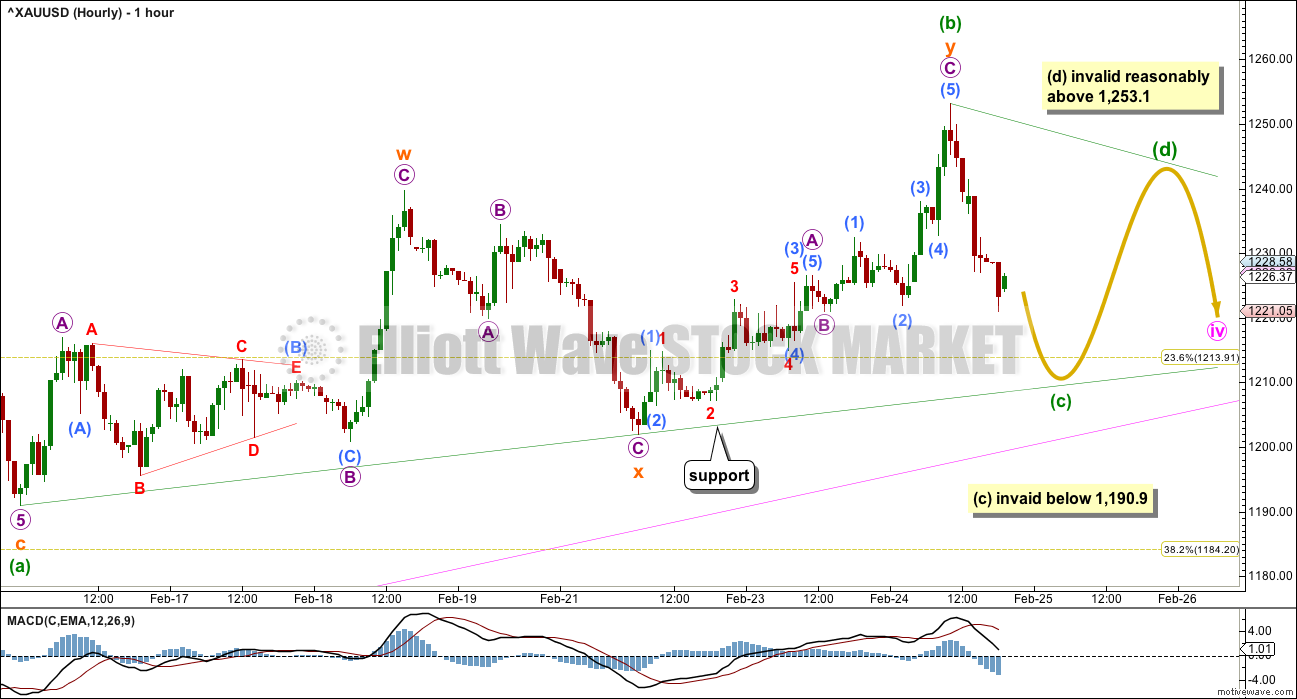
This main hourly wave count expects to see alternation in structure between the zigzag of minute wave ii and the triangle of minute wave iv. This is the main wave count for this reason only.
Unexpected upwards movement for a spike up on Wednesday may have been a continuation of minuette wave (b) within a triangle.
Minuette wave (b) subdivides as a double zigzag. Minuette wave (a) may be seen as a single zigzag. Minuette wave (b) is less than 0.9 the length of minuette wave (a), so a flat correction is not possible as the minimum requirement was not met. A triangle may still be unfolding sideways.
Within a possible regular contracting or barrier triangle, minuette wave (c) may not move below the end of minuette wave (a) at 1,190.9. Thereafter, minuette wave (d) may not move substantially above the end of minuette wave (b) at 1,253.1. The triangle will remain valid as long as the (b)-(d) trend line remains essentially flat.
This main wave count expects minute wave iv to find support at the pink trend line. It may end about the 0.236 Fibonacci ratio at 1,213.91. If it continues for a further four sessions, it may total a Fibonacci thirteen daily candlesticks.
The divergence between price and MACD at the hourly chart level supports this wave count. Subminuette wave y made a new high above subminuette wave w, but MACD made a lower high. This indicates weakness in upwards movement from price.
ALTERNATE HOURLY WAVE COUNT
Click chart to enlarge.
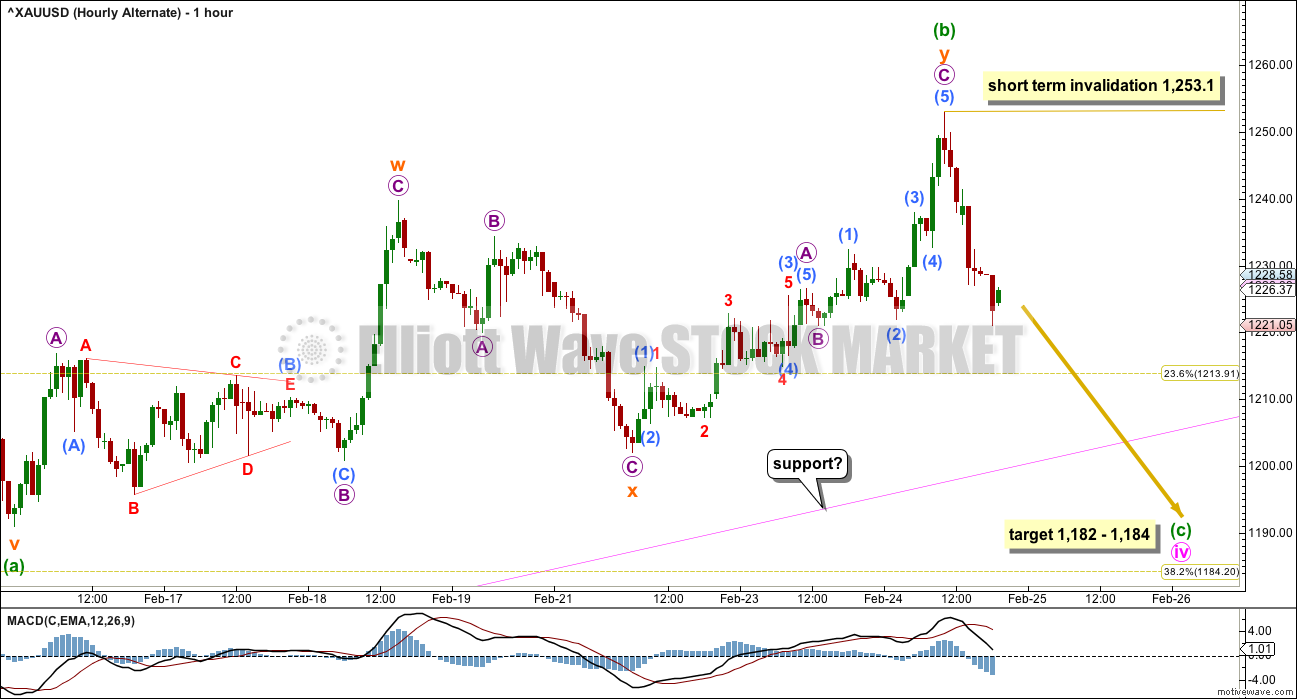
Minute wave iv may be continuing as a zigzag. This would offer no structural alternation with minute wave ii which was also a zigzag. For this reason, this must be an alternate wave count with a lower probability.
If any movement below 1,190.9 is seen, then the triangle would be invalidated leaving only this alternate wave count. At that stage, expect price to continue lower to the target and overshoot the pink trend line.
At 1,182 minuette wave (c) would reach equality in length with minuette wave (a). This is close to the 0.382 Fibonacci ratio at 1,184 giving a $2 target zone with a reasonable probability.
This alternate wave count could see minute wave iv end in just one session. It would not exhibit a Fibonacci duration.
TECHNICAL ANALYSIS
Click chart to enlarge. Chart courtesy of StockCharts.com.
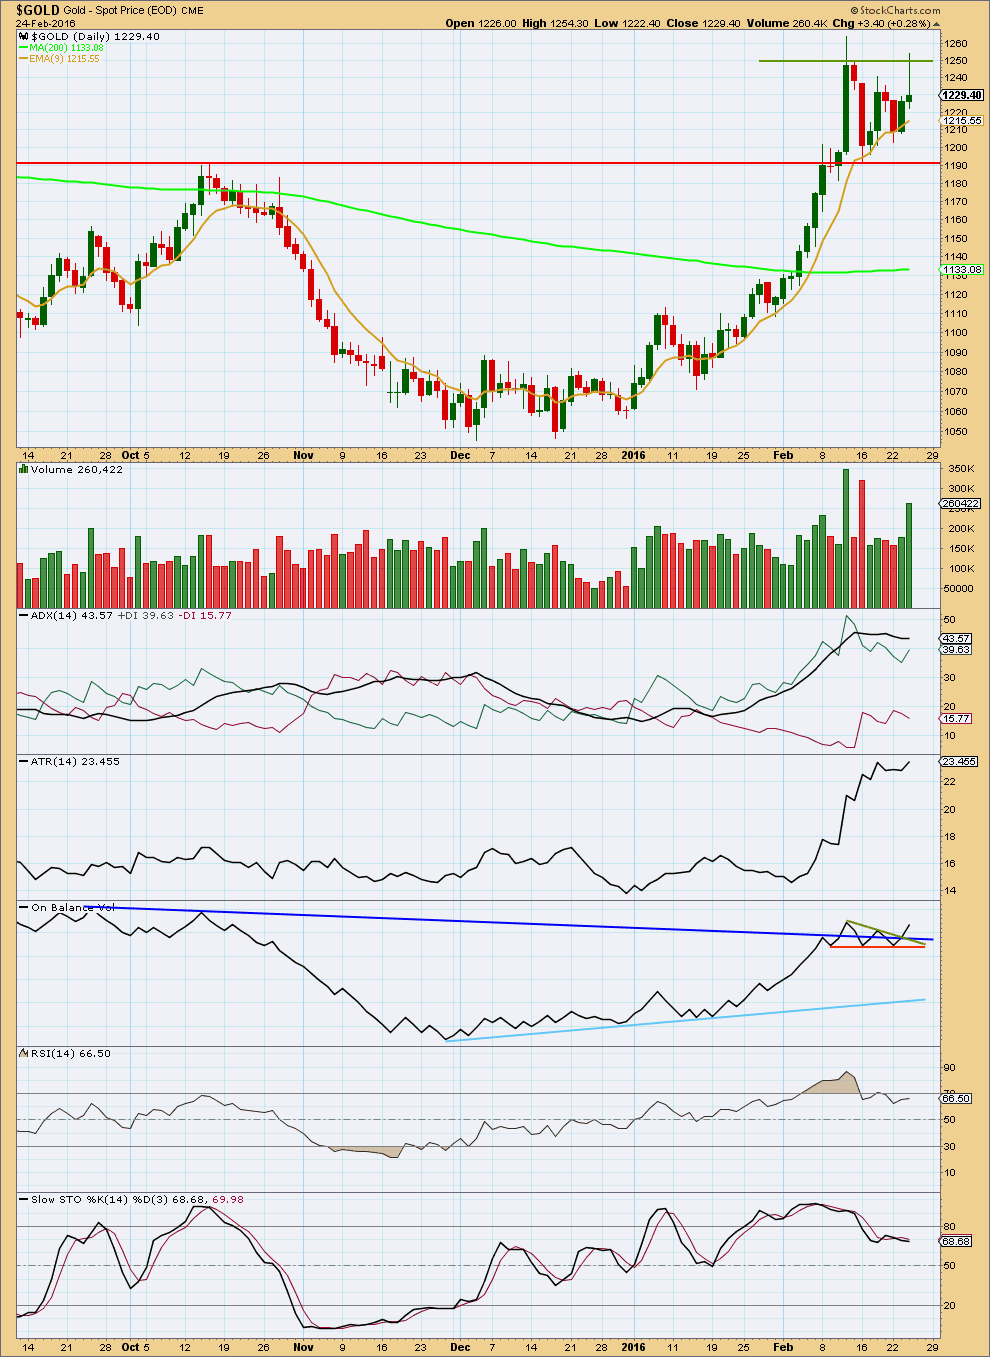
Finalised volume data for Wednesday’s session shows a green candlestick with strong volume. The rise in price was supported by volume. This may be an indicator that when price breaks out of this consolidation zone it may be upwards. The long upper shadow on Wednesday’s candlestick is bearish; the bulls pushed price strongly higher but the bears were able to bring price down closer to the lows of the day.
The strong volume for 16th February may be an anomaly. Volume for this daily candlestick may include after hours trading for Monday 15th February which was a holiday in the USA. If this candlestick is ignored, then strongest volume during this consolidation is for an upwards day. This suggests price may break out upwards; this supports the Elliott wave count.
If strong volume for the candlestick of 16th February is not ignored, then strongest volume during this consolidation is for a downwards day. This indicates price should break out of the consolidation downwards; this does not support the Elliott wave count.
So far during this consolidation price is finding support at the 9 day Exponential Moving Average.
ADX is flat today indicating the market is not trending but consolidating. Overall, ATR still agrees as it is overall flat still.
On Balance Volume has broken above its dark blue and green trend lines. OBV is often a reliable leading indicator. A break of a trend line often precedes a break of price in the same direction. This break upwards by OBV today is strong support for the Elliott wave count which expects the breakout of this consolidation may be upwards.
The trend lines on price to delineate this consolidation zone are adjusted today. The lower edge is at 1,191. This red horizontal line has previously provided resistance and now provides support. The upper edge of this consolidation is delineated by a shorter olive green line. This is about 1,250. A break above 1,250 or below 1,191 on a day with an increase in volume would be a classic breakout of a consolidation. At that stage, price should be expected to continue in the same direction of the breakout. The Elliott wave count expects the breakout to be upwards.
This analysis is published @ 09:42 p.m. EST.
On my chart I have Matrix points as well as some of the Elliott waves but space prevents me from putting any more on (I am learning EW). However, I have found a very interesting picture. The MC1 -1, MC2-1 and the bottom of the A wave have all converged together and from what I understand this can often mean a resulting big move and in this case the move is up. Hopefully I have been able to upload the chart so that you can see for yourself. The move also was around the end of one complete (lunar) year. I find that the Elliott waves and the Matrix confirm each other
The giant triangle/pennant, or whatever you want to call it, is clearly beginning to narrow to a now roughly $30 zone (1215-1245). To see more precise figures, draw a line across the recent tops (Feb 11 and 24) and bottoms (Feb 16 and 22). Whichever side breaks is the winning direction. Lookout for minor fakeouts though. I personally still believe the bearish case is stronger at these elevated/overbought prices.
This upwards move looks like wave B within minuette (c) down.
Minuette (c) for the main hourly count has to subdivide as a zigzag. So it needs a B wave in there to make it look like a three.
For the alternate this is a second wave bounce.
And so how low the next wave down goes should tell us which wave count is correct. If it makes a new low below 1,190.9 then we shall have our answer; its a zigzag and its going to end quickly. But if it remains above 1,190.9 and finds support at the green (a)-(c) trend line on my main hourly chart then its probably a triangle and price will slowly meander sideways for days…
Triangles have a purpose. They’re tricky structures. They seem to exist primarily to test our patience. They do it very well!
And I need to keep spending more time to consider alternates. Triangles really are very tricky, I need to again consider, what if its a B wave triangle within something larger? Or an X wave triangle? What if it begins later than I have it? Then the breakout direction would be a short downwards thrust before the upwards trend resumes.
http://nftrh.com/2016/02/24/hui-log-linear/
http://nftrh.com/2016/02/25/golds-full-house/
HUI just hit the top of the downtrend channel and …
I’m hoping that Elliot Wave will be right and gold pops to $1313 right now and HUI goes to 260+ so this will be like 2009 again. It was so hard to go ALL IN and watched it crashed during 2008 crash and not sell anything too early when it bounced back for break-even … then have to wait even longer for 700%-1000% gain from low. Good luck to those who are all in right now and I hope you’ll make your 500% gain as well because you’re holding on and not sell anything even on a 60% gain from low. It must be tough to just hold and do nothing, I’ve been there.
That said, I don’t think I have the courage to go through all that again. So this time, having read “Reminiscences of a Stock Operator” over the weekend because Lara mentioned it, I’m going to wait for HUI to cross 260 then go all in again (just like Livermore waiting for his stock to cross 100 then went all in). Until then I’m going to bet 10% with Elliot Wave like Lara advises.
5%
or better yet, 3%
And yes, “Reminiscences” is a great book. Reminds us of some of the most basic tenets of trading.
Stay with the trend.
Wait for confirmation.
Thomas you mentioned, I’m going to wait for HUI to cross 260 then go all in again. HUI is now at 166 so 260 is a lot higher. HUI 260 takes us back to mid 2013 and mid 2014. Would you short gold at that level or be bullish? What about after the first full five wave count at the top of intermediate wave (1)?
Or would you want to wait for intermediate (2 )down to end maybe at HUI 120 then buy in bullish?
According to Gary Tanashian, the analyst I’ve been following since 2008 (we got in around HUI 240, saw it crashed to 150 and double down … then it exploded to 600), miners are not technically in a confirmed bull market until it clears HUI 260. So I’ll probably go all in then. Gary and I are actually currently bullish on gold but not “fully” yet. We’ll see. We may not even have to wait for HUI 260. It’s all about $GDM:$SPX (monthly) making a bull cross or EMA(10) crossing over EMA(25) as well as bullish fundamentals are still intact … still waiting for yield curves to rise like in 2008 again.
It’s just that I owe Gary for my massive 500% net worth increase during 2008-2011 when he pounded the table said all-in bull … and not lose it when Gary called bear because HUI lost 460 in 2012. We went into wait-and-see mode ever since … making small plays on bounces along the way. So it’s hard for me to go all in when Gary is not pounding the table and a full gold bull yet. I’ll do so whenever Gary makes the same call that he made in 2008-2009 again… may not even have to wait for HUI 260 …
Currently, Gary is more bullish on gold (but not “fully”) than any other time during the past 4 years. But he doesn’t want to see gold goes below $1180, or HUI goes below 140 even though it can go to 120 … because that would be abnormal after all the strength we’ve seen. So we’ll see what level intermediate (2) will bring us … I hope it’ll be above HUI 140 … better yet HUI 260
Like Livermore says, it’s never too high to buy … Gary actually called bull S&P in 2013 after it cleared the 30 years resistance …. so … yea never too high to buy.
I’m learning Elliot Wave because Gary has high regards for the system. Gary was one of Robert Prechter’s students, claiming Pretchter taught him everything he knows, so I’m very interested in Elliot Wave. I’m still learning EW here.
Movement in gold is getting a bit unclear i guess…getting short here i think its not a good idea though EW counts suggest a correction…as lara mentiond “surprises on the upside”..
It would have been so good if exchange would gave net long and net short for the day…it would hav been a great help instead of volume profile… 🙂
Less risky to short intra day versus overnight if you are really good at EW counts then do it both ways intra day at the bigger EW direction changes and have some advanced indicators to help you fine tune your buying and selling. Even fast trades like 30 minutes could add up like at 2:20 pm today buy NUGT then at 2:57 today sell and buy DUST and sell that at 3:10 pm. Just a couple of examples.
Lara: Main Hourly count above ;”This main wave count expects minute wave iv to find support at the pink trend line. It may end about the 0.236 Fibonacci ratio at 1,213.91.”
Alternate count;”This alternate wave count could see minute wave iv end in just one session. It would not exhibit a Fibonacci duration.”
Both wave counts expects corrective action in gold down to 1213 to 1184 range.
Next week is March and expect low in the first week may be???
GOLD SEEMS TO BE HANGING IN PRETTY WELL. what do you guys think? I am tempted to go short some april gold futures IF we are going to pull back all the way to 1213 or less. But I just have a feeling that with international currency problems, potential syria/iraq/iran/china problems etc staying long some of the miners here might make more sense. Opinions?
Gold is trading in near 1237..
If this is impluse wave C…Can we say that the move from 1252$ to mid 20s was wave 1 of C and right now its wave 2 of C this gives us the target for wave 3 at 1205$ and wave 5 may end near 1185$…
Seems perfect ..??…
Anyway bizarre moving gold gets down to the 1,205 pink line zone or below 1,200 and maybe down to 1184-1182 this week so I can buy miners for less sounds good to me and will be a big relief after Wednesday’s big spike up. I have my luggage packed and ready on the dock and I’ll be sitting on the fence besides the dock so when the Gold boat leaves for it’s big trip up North it won’t leave without me. I’ll be on it. I hope the boat trip is an all inclusive and has live entertainment and wi-fi so I can check Lara’s updates and do some trading?
LOL
And a wave pool for some surfing
I actually saw that a huge cruise ship has a wave pool. I wonder if they’ll let me take my longboard with me?
Yes you could take your longboard as long as you give 1 seminar for 3 hours about Elliott Wave and your website for free on the ship and then you get the opportunity to hand out your business cards for your website services and get 100 or more new subscribers. In fact you could do that for free off the ship in whatever city you travel to. Of course I get a cut for the great idea!
ROFL
Sure, it’s a deal Richard
I’ll throw in a free surf lesson too just for fun 🙂